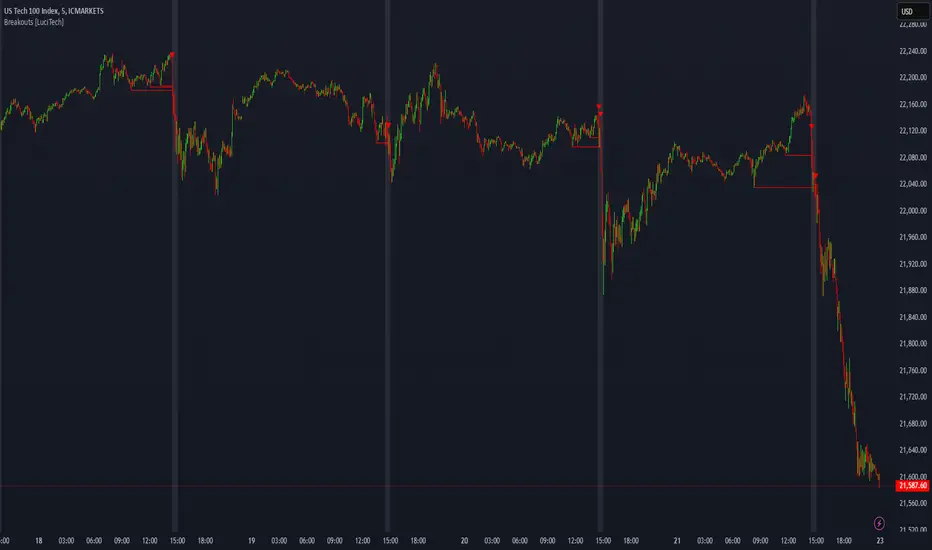
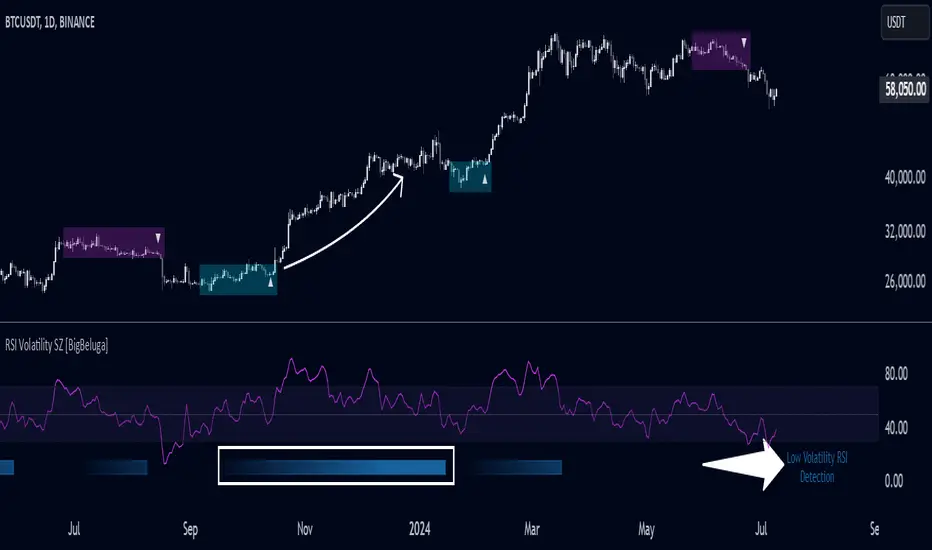
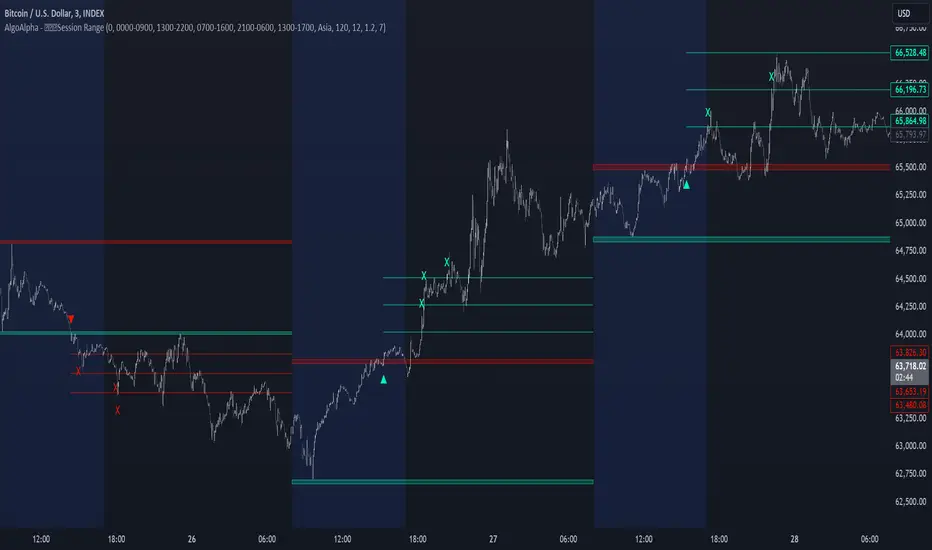
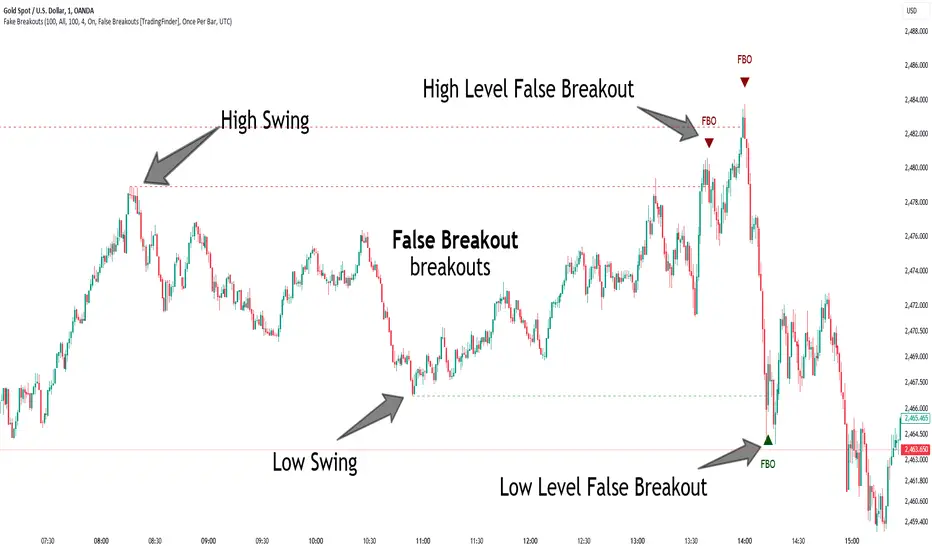
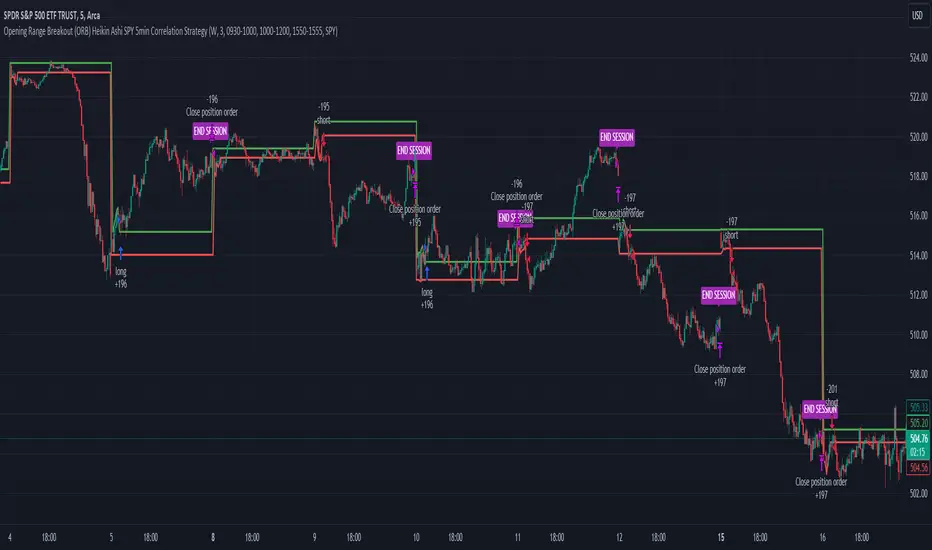
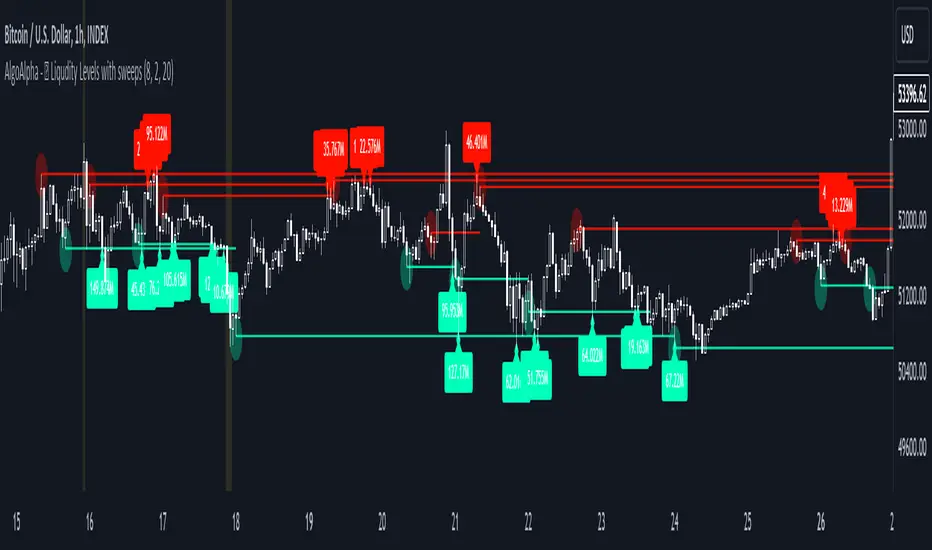
ORB & Session Liquidity Model [JOAT]ORB and Session Liquidity Model
Builds the opening range for your chosen session, maps the liquidity around it, and signals breakouts with session-aware trade control.
What it is
The first minutes of a session set a reference range that the rest of the session repeatedly reacts to. This indicator defines that opening range, tracks the liquidity sitting above and below it, and signals confirmed breakouts — with session timing, a daily trade cap and full trade framing built in. It is an original session-driven model, not a generic breakout line.
How it works
• Opening range — during a user-defined opening window (for example the first N minutes of your session), the tool records the high and low. Once the window closes, that range is locked as the reference for the rest of the day and drawn as a box.
• Session logic — the model resets cleanly each new day using a real session-change test, so counters and levels do not carry stale values across sessions. Trading is only permitted inside the active session window you define.
• Liquidity ladder — levels around the range (its extremes and projections) are drawn and labelled as the liquidity price is likely to seek. These give context for where a breakout may run to or reverse from.
• Breakout signals — a Buy fires on a confirmed close beyond the range high plus a buffer; a Sell on a confirmed close below the range low minus the buffer. A per-day maximum-trades cap and a minimum-gap control prevent the level from generating repeated prints as price oscillates around it.
Trade levels
Each breakout draws a red risk box to the stop and a green reward box to the third target, with inner dividers and right-edge labels for entry, stop and each take-profit at your R multiples. Stops relate to the range, which is the structure the trade is based on.
The dashboard
An adjustable session-console panel shows the current session phase (pre-range, range building, or live), the locked range, the directional bias relative to it, the trades used against the daily cap, the active signal, a conviction estimate, and a live first-target-before-stop tally from closed bars only.
How to use it
• Set the opening window and session to match the market you trade (indices, futures, forex sessions, crypto day boundaries).
• Wait for the range to lock, then trade confirmed breakouts in the direction of your bias; use the liquidity ladder for targets and invalidation.
• The daily cap keeps the model disciplined — respect it rather than overriding on every wiggle.
Settings
Opening-range window, session hours, breakout buffer, maximum trades per day, liquidity options, risk multiple and target R multiples, plus visual and dashboard controls.
Originality and usefulness
Opening-range breakout is a known concept; the contribution here is the integrated liquidity mapping around the range, the strict session reset and daily trade governance, the confirmed-close breakout logic, and the full non-repainting trade framing — assembled into one session-aware model and explained so each element's role is clear.
Notes and limitations
• Breakouts can fail, and range-bound sessions produce whipsaws around the levels — the buffer and daily cap reduce but do not eliminate this.
• Session settings must match the instrument; a mismatched window will define the range at the wrong time.
• The tally reflects only past bars on the current chart and is not a forecast.
• Educational and analytical tool, not financial advice.
— made with passion by officialjackofalltrades
אינדיקטור

Opening Range Breakout ORB - Signals, Targets & Alerts [LunqFX]The Opening Range Breakout (ORB) is one of the most traded intraday strategies — but most ORB indicators only draw the opening range box and leave you guessing. This Opening Range Breakout indicator goes further: it marks the opening range, detects the first genuine breakout, filters fakeouts, projects measured-move targets, and — uniquely — builds a live breakout statistics engine from the last 100 trading days of the symbol on your chart.
What makes this ORB indicator different
Instead of a static box, you get a data-driven read on how your market actually behaves after the opening range:
First-break direction split — how often the day breaks up vs down
Hold rate — how often the first breakout direction holds into the close
Fakeout rate — how often the first breakout fails back inside the range
Target hit rates — how often price reaches 1x and 2x the opening-range height
So before you take the trade you can see, for example, that on this symbol the upside breakout holds into the close 62% of the time and the 1R target is reached on 48% of breakout days.
How the opening range breakout is calculated
Auto mode works on every market with zero setup. The opening range starts at each day's open of the symbol's own exchange — stocks at the 09:30 session open, crypto at the 00:00 UTC daily open, forex and futures at their session open — and lasts a chosen number of minutes (the classic 5-minute, 15-minute or 30-minute ORB). A Custom mode lets you define any session window, such as the London or New York open.
When the opening-range window closes, the range high and low are locked and projected forward as levels.
The first candle close beyond the range (or wick, if you prefer) is treated as the breakout. Targets are projected at 1x and 2x the range height in the breakout direction.
A close back inside the range before the first target is reached is flagged as a fakeout. A breakout that reaches 1R first and only then returns is counted as a valid breakout, not a fakeout.
At the end of each trading day the outcome is recorded — direction, hold, fakeout, targets — and the dashboard percentages are plain rolling hit rates. No repainting, no curve fitting.
How to use it
Breakout day trading: trade the first breakout with more context — use the hold rate to judge whether the break on your symbol is worth taking, and size your target from the 1R / 2R hit rates.
Fakeout fade: when a symbol shows a high fakeout rate, the failed breakout back inside the range is often the better setup; the fakeout is marked in real time.
Range-quality filter: the dashboard shows the opening range as a multiple of ATR, so you can skip abnormally small ranges that tend to break out randomly.
Works on any symbol and any intraday timeframe (1m–15m recommended): index futures and CFDs (NAS100, SPX500, US30, NQ, ES), stocks and ETFs (SPY, QQQ), gold (XAUUSD), Bitcoin and crypto, and forex majors.
Dashboard
A clean on-chart panel shows today's live status (building range → inside range → breakout → target hit or fakeout), the opening-range high/low and its size in ATR, and the full statistics block with the sample size always visible.
Settings
Auto anchor (any market, zero setup) or fully custom session window with timezone control — 5 / 15 / 30-minute ORB or any session open
Close-based or wick-based breakout logic
Adjustable target multiples, rolling statistics window, and visuals
Alerts for range locked, breakout up, breakout down, fakeout, target 1 and target 2
Optional gradient momentum candles that can be switched off
No repainting
The opening range is fixed the moment its window closes. Breakouts, fakeouts and targets are confirmed on closed bars only, and the statistics are built exclusively from completed trading days — never recalculated backwards.
This indicator is an educational market-analysis tool, not financial advice. Historical statistics describe past behavior and are not a guarantee of future results. Always confirm with your own analysis and manage your risk.
אינדיקטור

[ A L P H A X ] BREAKRUNE - Pattern Breakout RSI EngineAlphaX BREAKRUNE — Pattern Breakout Intelligence + RSI Trigger Engine: Real vs Fake Breakout Classification, Five-Pattern Detection, Fakeout Reversal Signals & Pending State Machine
AlphaX BREAKRUNE is a professional-grade breakout intelligence system built around a single foundational problem that defeats most breakout traders: the inability to distinguish a genuine structural breakout from a fakeout in real time. Most breakout indicators fire on any close beyond a pattern boundary — and then leave the trader holding a loss when price immediately reverses back inside the structure. BREAKRUNE solves this at the architectural level by separating breakout detection into three sequential phases — pattern recognition, breakout classification, and RSI trigger confirmation — and requiring all three to align before a signal fires. Every raw break is first classified as PENDING, then evaluated over a configurable decision window for either TRUE BREAK or FAKEOUT status using candle body and wick geometry, and only confirmed true breaks with RSI momentum alignment produce long or short entry signals. Fakeouts become their own opportunity: when a breakout is classified as fake, BREAKRUNE reverses the bias and watches for an RSI-confirmed trap reversal signal in the opposite direction. The result is a system that profits not just from real breakouts but also from the very fakeouts that trap the crowd — with the RSI trigger layer ensuring every entry has genuine momentum behind it. Designed for traders across crypto, forex, gold, and indices on any timeframe.
━━━━━━━━━━━━━━━━━━━━━━━━━━━━━━━━━━━━━━━━
🔮 The Core Philosophy — Three Phases Before a Signal
The fundamental failure of conventional breakout systems is compression of the detection and confirmation steps into a single bar event. Price closes above resistance — signal fires. This approach has no mechanism for distinguishing momentum breakouts from stop-hunt spikes, thin-market wicks, or false structural breaks that reverse immediately.
BREAKRUNE separates these into three distinct sequential phases that every potential signal must pass through:
Phase 1 — Pattern Recognition:
The system continuously scans the pivot structure to identify one of five major pattern types — Range, Double Top/Bottom, Triangle, Wedge, or Trend Channel. The detected pattern provides the structural context for the breakout evaluation: where the resistance and support levels are, what the directional bias of the formation is, and whether the pattern height meets the minimum size requirement for a qualified break.
Phase 2 — Breakout Classification:
When a raw break of the pattern boundary occurs, the system enters PENDING state. Over the next configurable bars (the fakeout decision window), it watches for one of two outcomes. If candles close back inside the structure with a significant rejection wick, the break is reclassified as FAKEOUT. If the required number of candles all close beyond the boundary without a wick rejection, the break is classified as TRUE BREAK. No premature signal fires during this window — the system waits for the evidence.
Phase 3 — RSI Trigger Confirmation:
Only after a TRUE BREAK or FAKEOUT classification does the RSI trigger layer evaluate. For true breaks, the Fast RSI must be above the configured long trigger (default: 55) with Core RSI above 50 and both RSI slopes positive. For fakeout reversals, the Fast RSI must cross the midline in the reversal direction with positive directional slope. Both must pass the quality score gate. Only then does a signal fire.
This three-phase architecture is what makes BREAKRUNE categorically different from breakout indicators that react to a single bar event.
━━━━━━━━━━━━━━━━━━━━━━━━━━━━━━━━━━━━━━━━
📐 Five-Pattern Detection Engine
BREAKRUNE continuously classifies the current market structure into one of five pattern types using the most recent confirmed pivot highs and lows. Every pattern provides resistance (res) and support (sup) levels used as the breakout boundaries.
Pattern detection uses:
Confirmed fractal pivot highs and lows (configurable pivot length, default: 5 bars each side), ATR-normalized tolerance values for determining flat vs sloped levels, and a minimum pattern height filter to eliminate micro-structures.
━━━━━━━━━━━━━━━━━━━━━━━━━━━━━━━━━━━━━━━━
Range:
Both the most recent pivot high and pivot low are within the flat level tolerance (default: 0.35× ATR) of their respective prior pivots — price has been oscillating between approximately horizontal support and resistance. The pattern bias is neutral (patBias = 0) — a range can break either direction. The resistance is the average of the two pivot highs; support is the average of the two pivot lows.
Double Top / Double Bottom:
Two pivot highs at approximately the same level (within flat tolerance) with the current price below both peaks — Double Top, bearish bias. Or two pivot lows at the same level with current price above — Double Bottom, bullish bias. The pattern height is the distance from the support/resistance level to the opposing pivot extreme. The directional bias (patBias) is set accordingly — bearish for Double Top, bullish for Double Bottom.
Triangle (Converging):
The pivot highs are trending lower (by more than the trend shift tolerance, default: 0.20× ATR, between consecutive highs) while the pivot lows are trending higher — a symmetrical converging triangle. No directional bias is set (patBias = 0) since triangles resolve in either direction. The resistance is the most recent pivot high; support is the most recent pivot low.
Wedge:
Both pivot highs and pivot lows are trending in the same direction. Rising Wedge: both highs and lows trending upward — despite the upward direction the narrowing structure is bearish (patBias = -1). Falling Wedge: both trending downward — bullish (patBias = 1). The wedge pattern is identified when the pivot-to-pivot shift exceeds the trend tolerance on both sides in the same direction.
Trend Channel:
Pivot highs are trending in one direction and pivot lows are trending in the same direction, but the high trend direction opposes the expected wedge classification — a parallel channel. The channel bias follows the direction of the trend (upward-sloping channel = bullish patBias, downward = bearish).
Pattern freshness filter:
All pivot-based pattern detections are subject to a maximum age constraint (default: 80 bars from the most recent contributing pivot). Patterns older than this threshold are excluded from pattern detection — the oldest pivot must be within the freshness window for the pattern to be considered current and relevant.
Pattern size validation:
The pattern height (distance from support to resistance) must meet or exceed the minimum pattern height in ATR multiples (default: 1.1× ATR). This sizeOk condition contributes 2 points to the quality score — the largest single weight component — and reflects that properly sized patterns have more institutional significance than micro-structures.
━━━━━━━━━━━━━━━━━━━━━━━━━━━━━━━━━━━━━━━━
⚡ The Breakout Classifier — PENDING → TRUE BREAK or FAKEOUT
When price closes beyond a pattern boundary by more than the break threshold (default: 0.12× ATR), a raw break event is registered and the breakout classifier enters PENDING state. From this moment, every bar within the fakeout decision window (default: 5 bars) is evaluated.
Raw break detection:
Long raw break: Close above the resistance level plus break threshold, with the pattern allowing long breaks (not a bearish pattern — Double Top and Rising Wedge suppress long breaks)
Short raw break: Close below the support level minus break threshold, with the pattern allowing short breaks
PENDING state variables stored at the break bar:
The direction (pendingDir), the exact level broken (pendingLvl), the bar index of the break (pendingBar), and the pattern name (pendingPat) are all stored in persistent variables. The PENDING state is displayed on the dashboard CLASS row as PENDING — visible awareness that a break has occurred and is being evaluated.
FAKEOUT classification:
Within the fakeout window (pendingAge ≤ fakeWindow), if price closes back inside the pattern:
For a long break fakeout: close falls back below the broken resistance level AND the upper wick of the current bar exceeds the configurable minimum wick rejection ratio (default: 45% of bar range) — the bar closed back inside with a dominant upper wick, confirming selling rejection of the attempted breakout
For a short break fakeout: close rises back above the broken support AND the lower wick exceeds the minimum ratio
When these conditions are met, pendingFake is set to true and the CLASS row displays FAKEOUT — the orange classification that activates the trap reversal signal pathway.
TRUE BREAK classification:
When the configurable number of consecutive candles (default: 2 bars) all close beyond the broken level — `ta.lowest(close, confirmBars) > pendingLvl` for longs, `ta.highest(close, confirmBars) < pendingLvl` for shorts — without any fakeout having been detected, pendingTrue is set to true and CLASS displays TRUE BREAK. The confirmed candles all remaining beyond the level eliminates the single-bar false breakout.
Window expiry:
If neither FAKEOUT nor TRUE BREAK is classified within the fakeout window, the pending state expires silently — pendingDir resets to zero, the level clears, and the system resumes scanning. This prevents stale pending states from generating signals long after the relevant price action has passed.
━━━━━━━━━━━━━━━━━━━━━━━━━━━━━━━━━━━━━━━━
📊 The RSI Trigger Layer — Momentum Gating on Classified Breaks
The RSI trigger layer is the final gate before a signal fires. It ensures every entry — whether on a true break or a fakeout reversal — has genuine momentum direction behind it at the moment of entry.
Dual RSI architecture:
Fast RSI (default: 7 periods) — the timing layer. Reacts quickly to price movement and provides the momentum trigger reading
Core RSI (default: 14 periods) — the confirmation layer. The intermediate momentum context that must agree with the fast RSI direction
RSI slope measurement:
Both RSI slopes are computed over the configurable slope bars (default: 3 bars) — the current RSI value minus the value N bars ago. A positive slope means RSI is accelerating; a negative slope means decelerating.
True Break Long RSI conditions (rsiLongOk):
Fast RSI above the long trigger threshold (default: 55) — momentum has already crossed into bullish territory
Core RSI above 50 — the intermediate RSI confirms the bullish bias
Fast RSI slope positive — momentum is still accelerating upward
Core RSI slope non-negative — intermediate momentum is not rolling over
True Break Short RSI conditions (rsiShortOk):
Fast RSI below the short trigger threshold (default: 45)
Core RSI below 50
Fast RSI slope negative
Core RSI slope non-positive
Fakeout Reversal RSI conditions:
Trap Long (rsiTrapLong): Fast RSI crosses above 50 (ta.crossover) with a positive slope — the RSI midline crossover after the fakeout confirms the reversal is gaining momentum
Trap Short (rsiTrapShort): Fast RSI crosses below 50 with a negative slope
Why the RSI trigger is a layer, not a gate: The RSI conditions are required for the signal to fire but are also the primary quality score component (2 points when fully met). This dual role means the RSI is simultaneously a hard entry requirement and a quality contributor — signals that barely pass the RSI threshold score lower than signals where momentum is strongly confirmed.
━━━━━━━━━━━━━━━━━━━━━━━━━━━━━━━━━━━━━━━━
🔀 The Fakeout Reversal — Trapping the Trap
The fakeout reversal is BREAKRUNE's most distinctive and high-reward signal type. When a long breakout is classified as FAKEOUT (price returned below resistance with a rejection wick), the crowd that bought the breakout is now trapped — holding longs above what has become confirmed resistance again. The RSI trap reversal watches for the Fast RSI to cross below 50 with negative slope: the momentum of the trapped buyers failing. When this occurs within the cooldown window, a short signal fires — entering precisely as the trapped longs begin capitulating.
Why fakeout reversals often produce the strongest moves: A failed breakout above resistance concentrates stop losses of all the breakout buyers just above the resistance level. As those stops are triggered on the reversal, they add selling pressure to the downside move — creating a self-reinforcing cascade. The fakeout reversal entry captures this cascade from near the top.
Enabling/disabling: The Enable Fakeout Reversal Signals setting (default: on) controls whether trap reversal signals are active. Disabling it restricts BREAKRUNE to true break signals only — appropriate for traders who prefer pure momentum continuation entries.
Visual differentiation: True break signals are rendered in the standard bull/bear score-based colors (yellow-green for longs, red for shorts). Fakeout reversal signals fire through the same triangle shapes but with the quality score reflecting the trap penalty — trap signals score 1 point on the setup component vs 2 for true breaks, naturally producing slightly lower overall scores that are reflected in the triangle's brightness.
━━━━━━━━━━━━━━━━━━━━━━━━━━━━━━━━━━━━━━━━
🏅 The 10-Point Quality Score
Every signal — true break or fakeout reversal — is scored through a 10-point composite system before it can fire. Signals below the minimum threshold (default: 5) are suppressed regardless of classification.
Score components:
Pattern Size (up to 2 points):
sizeOk (pattern height ≥ minimum ATR threshold) scores 2 points. A zero-score here (pattern too small) alone can suppress a signal by 2 points — the largest single deduction possible. Well-sized patterns carry proportionally more institutional significance and this component enforces that.
RSI Trigger Alignment (up to 2 points):
rsiLongOk (for long signals) or rsiShortOk (for short signals) scores 2 points. This is the second largest component — reflecting that genuine momentum confirmation at the moment of entry is as important as pattern quality. Signals where RSI barely meets the threshold (Fast RSI just above 55 with flat slope) score these 2 points; signals where RSI is not aligned at all score 0.
Signal Type (1–2 points):
True break signals score 2 points; fakeout reversal (trap) signals score 1 point. This weighting reflects the inherently lower confirmation of a reversal trade versus a confirmed structural continuation — the trap trade is valid but carries more uncertainty.
Volume Confirmation (1 point):
Current bar volume meets or exceeds the volume average × multiplier (default: 1.1×). When volume confirmation is disabled in settings, this point is always awarded.
Non-Chop Market (1 point):
Choppiness Index is below the configured threshold (default: 62.0). Also enforced as a hard gate — extreme chop blocks all signals regardless of score.
HTF Bias (up to 2 points):
When useHtf is on and the higher timeframe EMA structure agrees with the signal direction (htfBull for longs, htfBear for shorts), 2 points are awarded. When HTF is disabled, 1 neutral point is always given. When HTF opposes the signal and useHtf is on, 0 points. This component has the same maximum weight as RSI and pattern size — reflecting the institutional significance of macro directional alignment.
Grade-coded signal colors:
Score 8–10 → full brightness (colBull / colBear). Score 6–7 → slightly dimmer. Score below 6 → transparent-tinted version. The triangle color communicates quality at a glance without reading the dashboard.
━━━━━━━━━━━━━━━━━━━━━━━━━━━━━━━━━━━━━━━━
📊 Live Dashboard
The 10-row real-time dashboard displays the complete internal state of the breakout classifier and all filter conditions.
PATTERN — the current detected pattern: Range, Dbl Top, Dbl Bot, Triangle, Rising Wedge, Falling Wedge, Up Channel, Down Channel. Purple color. Updates on every bar as the pivot structure evolves
CLASS — the current breakout classification state: IDLE (no pending break), PENDING (raw break registered, evaluating), TRUE BREAK (confirmed continuation), FAKEOUT (rejection detected, reversal watching). Color-coded — yellow-green for TRUE BREAK, orange for FAKEOUT, neutral for IDLE/PENDING
BIAS — the directional bias: BULL (pendingDir=1 or patBias=1), BEAR (pendingDir=-1 or patBias=-1), or NEUTRAL. Yellow-green or red
LEVELS — the current support and resistance levels as a price pair (e.g., "2450.50 / 2490.25"). The exact boundaries the breakout classifier is watching
QUALITY — the live quality score out of 10. Yellow-green when at or above the minimum threshold, neutral otherwise
RSI F/C — the live Fast RSI and Core RSI values as a pair (e.g., "58.4 / 53.7"). Yellow-green when above 50, red when below
HTF — higher timeframe EMA structure: ▲ BULL, ▼ BEAR, or — FLAT
CHOP — live Choppiness Index value. Orange when above the block threshold
VOL — CONFIRMED (volume above threshold) or LIGHT (below threshold). Yellow-green or orange
━━━━━━━━━━━━━━━━━━━━━━━━━━━━━━━━━━━━━━━━
📈 Chart Visual System
Pattern Boundary Lines — when Show Pattern Boundary Lines is enabled, a resistance line (res, red-tinted) and support line (sup, yellow-green-tinted) are drawn from the pattern's origin bar to the current bar, showing the exact levels the breakout classifier is watching
▲ Triangle (below bar) — long signal. Full brightness yellow-green for score 8+, standard for 6–7, transparent-tinted for minimum score. Fires on both TRUE BREAK longs and FAKEOUT reversal longs (trap shorts become long entries)
▼ Triangle (above bar) — short signal with matching grade-coded coloring
✕ Cross (above bar, orange) — fakeout mark for a failed long breakout. Appears when Show Fakeout Marks is enabled and fakeLongNow fires. The orange × above the bar is the visual alert that a bull breakout has been rejected
✕ Cross (below bar, orange) — fakeout mark for a failed short breakout
Candle tinting — when Show Tint Candles by Active Bias is enabled, bars are tinted yellow-green (bias=1) or red (bias=-1) during active pending or pattern-biased periods. The tint shows the directional context continuously, not just at signal bars
SL Line (red dashed) — when Show SL + TP1 + TP2 is on, the ATR-based stop loss level extending guideExtend bars forward
TP1 Line (lime dotted) — first take profit at 1.8× ATR from entry
TP2 Line (bright yellow-green dashed, width 2) — second take profit at 3.0× ATR from entry
━━━━━━━━━━━━━━━━━━━━━━━━━━━━━━━━━━━━━━━━
🚀 How to Trade with AlphaX BREAKRUNE — Step by Step
Step 1 — Read the Pattern and Levels
Check the PATTERN row on the dashboard — what structure is the system currently detecting? A Triangle or Wedge has directional bias; a Range or Double Top/Bottom has a directional expectation. Understanding the pattern context helps you assess which breakout direction is more probable
Check the LEVELS row — note the exact support and resistance prices. These are the lines the classifier is watching. If price is approaching resistance, a long break event may be imminent
Check BIAS — if it already shows BULL or BEAR from the pattern's directional classification, the system has a pre-existing directional lean before any break occurs
Step 2 — Monitor the Breakout Classification
When CLASS changes from IDLE to PENDING, a raw break has occurred. Watch the dashboard closely over the next fakeWindow bars — CLASS will shift to either TRUE BREAK or FAKEOUT
If CLASS shows FAKEOUT with an orange × appearing on the chart, the fakeout reversal pathway has activated. Check RSI F/C — is the Fast RSI approaching or crossing the 50 midline in the reversal direction?
If CLASS shows TRUE BREAK, check RSI F/C — is Fast RSI above 55 (long) or below 45 (short) with Core RSI confirming and slopes positive? If yes, a signal is likely imminent or has just fired
Step 3 — Enter on the Triangle Signal
A ▲ or ▼ triangle confirms all three phases have aligned — pattern identified, break classified, RSI triggered, quality scored
Read the triangle color — bright full-color triangle is Grade A (score 8+). This is the premium entry with all components confirming. Faded triangles are Grade C — valid but with reduced size
The QUALITY row shows the exact score. For fakeout reversal signals, the score will typically be 1 point lower than an equivalent true break signal due to the trap signal type weighting
Enable Show SL + TP1 + TP2 to see the ATR guide levels projecting forward from the signal bar
Step 4 — Manage the Trade
Watch the CLASS row during the trade. A new PENDING state in the opposing direction during an open position is an early warning that a counter-breakout is developing
Monitor RSI F/C — if Fast RSI begins rolling toward 50 against the trade direction, intermediate momentum is weakening. Consider taking TP1
The candle tint changing from yellow-green to red (or vice versa) during a trade means the bias has reversed — this is a structural exit cue
━━━━━━━━━━━━━━━━━━━━━━━━━━━━━━━━━━━━━━━━
⚠ Identifying Low-Quality Conditions — When Not to Trade
Stand aside when:
CHOP is orange on the dashboard — the hard chop gate is active. All signals are blocked. Pattern breakouts in extreme chop environments are dominated by noise — the range is too oscillatory for genuine structural breaks
CLASS shows PENDING for multiple consecutive bars with no resolution — when the system remains in PENDING state approaching the fakeWindow expiry without classifying as either TRUE BREAK or FAKEOUT, the break is ambiguous. The system will expire it silently. This ambiguity itself is a warning — directional commitment is absent
Pattern height is too small (sizeOk = false, quality score below 7) — the pattern exists but is too narrow to produce meaningful measured moves. Low-quality entries at micro-patterns carry reduced reward with the same stop risk
HTF Bias opposes the breakout direction — a bull breakout signal against a bearish HTF produces 0 HTF confluence points. The signal may still fire if other components score sufficiently, but counter-HTF breakouts resolve in the HTF direction far more often than not
FAKEOUT class appears but RSI is not approaching the midline — a fakeout has been detected but the RSI trigger for the reversal has not yet materialized. ARM SHORT / ARM LONG conditions are developing but no signal has fired. Do not anticipate the reversal signal without the RSI confirmation — the reversal could still fail
Multiple rapid PENDING → expiry cycles without TRUE BREAK or FAKEOUT — when the classifier repeatedly enters and exits PENDING state without resolving, the pattern boundary is being tested multiple times without follow-through. This is range-bound behavior masquerading as a breakout environment. Increase the break threshold or wait for a cleaner structural setup
The ideal BREAKRUNE setup:
Well-sized pattern (sizeOk true, pattern height 2× ATR or more)
Clean single raw break bar followed by TRUE BREAK classification within 2–3 bars
Fast RSI clearly above 55 (long) or below 45 (short) with positive/negative slopes on both RSI layers
HTF aligned with the breakout direction
Volume confirmed on the breakout bar
Chop Index well below threshold
Quality score at 8–10 (Grade A triangle, full brightness)
━━━━━━━━━━━━━━━━━━━━━━━━━━━━━━━━━━━━━━━━
⚡ Key Features
🔮 Three-phase breakout architecture — Pattern Recognition → Breakout Classification (PENDING → TRUE BREAK or FAKEOUT) → RSI Trigger Confirmation. No signal fires without all three phases completing sequentially
📐 Five-pattern detection engine — Range, Double Top/Bottom, Triangle, Rising/Falling Wedge, and Trend Channel identified from confirmed pivot structure with freshness and size filters
⚡ Real vs fake breakout classifier — candle body and wick geometry over a configurable decision window distinguishes genuine structural breaks from stop-hunt reversals before the signal fires
🔀 Fakeout reversal signal mode — when a break is classified as FAKEOUT, BREAKRUNE reverses bias and watches for an RSI midline crossover trap signal in the opposing direction, profiting from the crowd that got trapped
📊 Dual RSI trigger layer — Fast RSI (7) for timing precision and Core RSI (14) for momentum confirmation, with slope measurement on both. Required alignment conditions differ between true break and trap reversal entries
✕ Live fakeout markers — orange × marks above (failed long break) or below (failed short break) on bars where fakeout classification occurs, providing real-time awareness of failed breakouts independently of signal generation
🏅 10-point quality scoring — Pattern Size (2pts), RSI Alignment (2pts), Signal Type (1–2pts), Volume (1pt), Non-Chop (1pt), HTF Bias (2pts). Grade-coded triangle colors reflect score quality at a glance
🎨 Candle tinting — bars tinted yellow-green during bull pending/bias periods and red during bear periods, providing continuous directional context between signals
📊 10-row live dashboard — Pattern, Class, Bias, Levels, Quality, RSI F/C, HTF, Chop, and Volume updated in real time every bar
🔔 3 alert conditions — BREAKRUNE Long, BREAKRUNE Short, BREAKRUNE Fakeout (independent alert for fakeout detection regardless of reversal signal)
⚙ Fully configurable — pivot length, flat and trend tolerances, minimum pattern height, freshness window, break threshold, confirmation bars, fakeout decision window, wick rejection minimum, volume filter, dual RSI periods and trigger levels, RSI slope lookback, fakeout reversal enable, cooldown, quality minimum, HTF parameters, chop gate, SL/TP ATR multiples, guide extension, all visual toggles, and all colors are independently adjustable
━━━━━━━━━━━━━━━━━━━━━━━━━━━━━━━━━━━━━━━━
⚙ Settings Reference
Pattern Intelligence
Pivot Length — fractal sensitivity for pivot detection (default: 5). Lower = more frequent smaller patterns; higher = fewer, larger structural patterns
Flat Level Tol (xATR) — ATR tolerance for determining whether consecutive pivots are at the same level (default: 0.35). Controls Double Top/Bottom and Range classification sensitivity
Trend Shift Tol (xATR) — ATR tolerance for determining whether consecutive pivots show a directional shift (default: 0.20). Controls Triangle, Wedge, and Channel classification
Min Pattern Height (xATR) — minimum pattern height for the sizeOk condition and quality score (default: 1.1). Raise to filter micro-patterns
Pattern Freshness (bars) — maximum age of the oldest contributing pivot for pattern classification (default: 80). Older pivots are excluded
Breakout Classifier
Break Threshold (xATR) — minimum close extension beyond the pattern boundary to register a raw break (default: 0.12). Lower = more sensitive; higher = requires stronger breaks
True Break Confirmation Bars — consecutive candles that must all close beyond the level for TRUE BREAK classification (default: 2)
Fakeout Decision Window — maximum bars after the raw break within which FAKEOUT or TRUE BREAK must be classified (default: 5). After this window, the pending state expires
Fakeout Wick Rejection Min — minimum wick-to-body ratio required for FAKEOUT classification (default: 0.45). Higher = requires more obvious rejection wicks
Volume Confirm — require volume above average on the signal bar (default: on)
Volume Avg Length / Volume vs Avg — volume baseline parameters (defaults: 20 bars / 1.1×)
RSI Trigger Layer
RSI Fast — the timing RSI period (default: 7)
RSI Core — the confirmation RSI period (default: 14)
Long Trigger — minimum Fast RSI level for a true break long (default: 55). Above 50 is the baseline; raising this requires stronger bull momentum
Short Trigger — maximum Fast RSI level for a true break short (default: 45)
RSI Slope Bars — lookback period for RSI slope calculation (default: 3)
Enable Fakeout Reversal Signals — toggle the trap reversal signal mode (default: on)
Confluence Gate
Signal Cooldown (bars) — minimum bars between consecutive signals (default: 6)
Min Quality Score (of 10) — minimum score to fire a signal (default: 5)
HTF Bias Layer — when on, HTF alignment contributes up to 2 points to the quality score (default: on)
Hard HTF Alignment — when on, counter-HTF signals are fully blocked regardless of score (default: off)
HTF Timeframe / HTF Fast / Slow EMA — higher timeframe parameters (defaults: 60-minute / 21 / 55)
Block Extreme Chop / Choppiness Length / Chop Block Above — chop gate parameters (defaults: on / 14 / 62.0)
Entry / Exit Guides
Show SL + TP1 + TP2 — toggle guide line display (default: off)
ATR Length — ATR calculation lookback (default: 14)
SL (xATR) — stop loss distance in ATR multiples (default: 1.2)
TP1 (xATR) — first take profit distance (default: 1.8)
TP2 (xATR) — second take profit distance (default: 3.0)
Guide Extend (bars) — bars forward the guide lines project (default: 30)
Display
Show Pattern Boundary Lines — toggle the resistance and support boundary lines (default: on)
Show Signals — toggle signal triangle rendering (default: on)
Show Fakeout Marks — toggle the orange × fakeout markers (default: on)
Tint Candles by Active Bias — toggle directional candle tinting (default: on)
Show Dashboard — toggle the full dashboard (default: on)
Dashboard Position — Top Left / Top Right / Bottom Left / Bottom Right
Colors
Bull / Bull Bright — yellow-green family for bullish signals and tinting
Bear / Bear Bright — red family for bearish signals
Pattern Accent — purple for pattern labels, boundary lines, and structural elements
Pending / Fakeout — orange for fakeout marks, CHOP warnings, and VOL LIGHT indicators
Neutral — gray for IDLE class and neutral dashboard states
Stop / TP1 / TP2 — individual guide line colors
Dash BG / Dash Header / Dash Section / Dash Frame / Dash Text — full dashboard color control
━━━━━━━━━━━━━━━━━━━━━━━━━━━━━━━━━━━━━━━━
🔔 Alert Conditions (3 total)
BREAKRUNE Long — all three phases confirmed for a long entry: pattern identified, TRUE BREAK or FAKEOUT reversal classified, RSI trigger aligned, quality score met
BREAKRUNE Short — all conditions confirmed for a short entry
BREAKRUNE Fakeout — a fakeout has been classified on the current bar (fakeLongNow or fakeShortNow). This fires independently of whether a reversal signal follows — useful for awareness of failed breaks even when the reversal RSI conditions are not yet met
━━━━━━━━━━━━━━━━━━━━━━━━━━━━━━━━━━━━━━━━
🎯 Recommended Settings by Instrument & Timeframe
The default configuration is optimized for XAUUSD, major forex pairs, and crypto on M5–H1 :
Pivot Length at 5 — captures intraday structural swings without excessive micro-sensitivity
Fakeout Window at 5 — on M5 this is 25 minutes, sufficient to observe whether a break holds or fails without waiting too long. On M15, consider reducing to 3
Confirmation Bars at 2 — requires two consecutive closes beyond the level before TRUE BREAK classification. On M1, consider reducing to 1
RSI Long/Short Triggers at 55/45 — the asymmetric thresholds (not 60/40) accept momentum confirmation that is directional but not yet overbought/oversold
For other instruments or timeframes, adjust:
M1–M3 scalping — reduce Pivot Length to 3, reduce Fakeout Window to 3, reduce Confirmation Bars to 1, reduce Cooldown to 3, tighten Break Threshold to 0.08
H4–Daily swing trading — increase Pivot Length to 8–10, increase Pattern Freshness to 150, increase Fakeout Window to 8–10, increase Confirmation Bars to 3, increase TP2 to 5.0× ATR
Crypto (BTC, ETH) — increase Fakeout Wick Rejection to 0.50 for crypto's wider rejection wicks, increase Break Threshold to 0.18, increase Min Quality to 6 for tighter filtering on volatile instruments
Indices (NAS100, US30) — use Hard HTF Alignment (on), set RSI Long Trigger to 57, increase Confirmation Bars to 3 for cleaner index breakouts
Pure true-break mode — disable Enable Fakeout Reversal Signals, raise Min Quality to 6, raise RSI Long Trigger to 58 for higher-conviction momentum-only entries
Fakeout-specialist mode — enable Fakeout Reversal Signals, reduce Fakeout Wick Rejection to 0.38 for more sensitive fakeout detection, lower RSI Slope Bars to 2 for faster RSI crossover detection
━━━━━━━━━━━━━━━━━━━━━━━━━━━━━━━━━━━━━━━━
👥 Who This Is For
🔮 Breakout traders who are tired of being faked out — BREAKRUNE is built specifically around the fakeout problem. The three-phase architecture exists for one reason: to separate genuine structural breaks from the stop-hunt reversals that cost breakout traders money consistently
🔀 Traders who want to profit from both real breaks AND fakeouts — the fakeout reversal signal mode transforms the system's most common failure scenario into its own entry opportunity. The crowd that bought the false breakout becomes the fuel for the reversal trade
📊 Pattern-aware traders who want quantified structure — the five-pattern detection engine provides automatic structural context without manual drawing. Every signal tells you which pattern type it came from
📐 Momentum traders who need RSI precision — the dual RSI trigger layer (Fast 7 + Core 14) with slope measurement provides the most precise momentum timing gate in the AlphaX breakout signal suite
🧠 Systematic traders who want state transparency — the PENDING → TRUE BREAK / FAKEOUT classification state machine is fully visible on the dashboard in real time. You always know exactly what phase the system is in and why
🥇 Gold and forex intraday traders — breakout and fakeout patterns are particularly consistent on XAUUSD and major forex pairs during London and New York session transitions. Default settings are calibrated for these instruments
⚠ Traders who struggle with breakout timing — the RSI trigger layer forces every entry to have genuine momentum behind it at the moment of entry, eliminating the common experience of entering a breakout just as momentum exhausts
━━━━━━━━━━━━━━━━━━━━━━━━━━━━━━━━━━━━━━━━
📝 Notes
All signals are confirmed on bar close — the indicator is non-repainting by design. Pattern detection, breakout classification, and RSI conditions all finalize on confirmed bars
The pending state machine uses persistent variables (var) — the PENDING, TRUE BREAK, and FAKEOUT states persist across bars until resolved or expired. This is essential for multi-bar classification but means the state machine holds values from previous breakout events. A signal firing clears all pending state variables
Pattern detection is a best-fit classification — the system selects the most matching pattern from the available pivot structure on every bar. When the pivot structure changes (new pivots form), the pattern classification may update. This means the PATTERN row on the dashboard may change between signal events as new structure forms
The Pattern Freshness filter (default: 80 bars) ensures the oldest contributing pivot is recent. On slower timeframes with infrequent pivots, this may cause pattern detection to intermittently show — before new pivots form. Increase the freshness window on higher timeframes
Maximum 80 labels, 120 lines, and 600 bars back are configured. On very active low-timeframe charts, the oldest guide lines may be removed by TradingView's rendering limits
The fakeout mark (orange ×) fires independently of the reversal signal. A fakeout mark can appear without a subsequent reversal signal if the RSI trap conditions (midline cross with slope) are not met — the fakeout is real but the reversal momentum confirmation is absent
The indicator does not track open positions or P&L and does not connect to any broker or account
━━━━━━━━━━━━━━━━━━━━━━━━━━━━━━━━━━━━━━━━
⚠ Disclaimer
This indicator is a technical analysis and visualization tool intended for educational and informational purposes only. It does not constitute financial advice or a recommendation to buy or sell any financial instrument. All signals are generated from historical and real-time price data using mathematical calculations — their accuracy or profitability is not guaranteed. Past performance of any signal type does not guarantee future results. Always conduct your own analysis, use proper risk management, and consult a licensed financial advisor before making any trading decisions. The author accepts no responsibility for any losses incurred from the use of this indicator.
━━━━━━━━━━━━━━━━━━━━━━━━━━━━━━━━━━━━━━━━
Built for traders who understand that a breakout is not a signal — it is the beginning of an evaluation. The signal comes after the market proves whether the break was real. אינדיקטור

Coil & Fire - Ashish*Updated version of Momentum Scanner*
Finds stocks that had a strong explosive move (EP candle), are now coiling quietly near their EMAs, and marks the exact entry and stop-loss levels based on the most recent low-volume healthy-dip candle.
How it works:
Screens for stocks with a recent 8%+ single-day move that are outperforming their benchmark since that move, holding above the EMA9/21 cloud with the trend structure intact, and showing genuinely quiet volume on the pullback. When all conditions align, it marks a teal bar — a low-volume healthy-dip candle sitting within 5% above EMA9. The high of that bar is your entry. The low is your stop-loss. Purple dots show the entry level. Red dots show the stop.
Orange background = price has crossed the entry level. Yellow background = setup is valid, waiting for the trigger.
What's different from Momentum Scanner:
Entry and stop-loss are now anchored to the most recent teal bar rather than a historical coil-high level, so levels are always close to current price. Volume comparison for the teal bar now uses a 10-day average instead of 50-day, making it more responsive to recent trading activity rather than a long historical baseline.
Note: Indicators are tools, not oracles — every signal still requires human judgment, risk management, and context before any trade is taken. אינדיקטור

אינדיקטור

אינדיקטור

Bollinger Squeeze Breakout + VolumeA volatility contraction often precedes a volatility expansion. When Bollinger Bands narrow significantly, it signals that the market has entered a period of low energy, and low energy rarely lasts. This strategy is built around that principle: it waits for a genuine squeeze, then enters only when price breaks out of the bands with volume confirming that the move has real participation behind it, not just noise.
The logic
A squeeze is identified when the Bollinger Band width (the distance between the upper and lower bands relative to price) falls below its own recent average,meaning volatility is unusually compressed compared to the recent past. Once that condition is met, the strategy watches for price to close outside either band. A long entry triggers when price closes above the upper band during a squeeze, confirmed by volume exceeding its 20-period average. A short entry triggers under the mirrored condition on the lower band. Stops and targets are based on ATR, since the appropriate distance for both should scale with the market's actual movement at the time of entry, not a fixed number.
This approach tends to filter out the false breakouts that occur during already-volatile, choppy conditions, since the entry only fires after a genuine period of compression, which is when breakouts have historically had more follow-through.
Notes on use
The squeeze threshold and lookback length are the two inputs worth tuning per instrument, a 50-period lookback works reasonably well on daily and 4-hour charts, but lower timeframes may benefit from a shorter lookback to react faster to genuine volatility shifts. As with any breakout strategy, backtest across both trending and range-bound periods before drawing conclusions, since this approach is built specifically to perform during regime transitions and may underperform in markets that stay range-bound for extended periods without ever truly compressing.
This is shared for educational and discussion purposes. As always, backtest thoroughly on your own instruments and timeframes, and treat this as a starting framework rather than a finished system. Feedback and variations are welcome in the comments. אסטרטגייה

Touch Turn Reversal ZonesDescription:
The Touch Turn Reversal Zones indicator is a comprehensive tool designed to help traders read market structure, establish directional bias, and identify high-probability reversal zones. By combining Market Structure shifts (BOS/CHoCH) with automated Fibonacci-based logic, this script highlights precise points of interest where the price is most likely to react.
Key Features & How It Helps:
Upper & Lower Touch-Turn (TT) Boxes: These target boxes represent near-ideal areas for direct price reversals. When price enters or wicks into these zones and subsequently closes in the opposite direction, the box is "activated" and visually highlighted (becoming brighter). The indicator will keep the most recently activated box prominent until a new setup triggers, allowing you to easily track the current active reversal point.
The 0.5 Level Magnet: A core component of this strategy revolves around the 0.5 Fibonacci levels generated from CHoCH legs. When multiple 0.5 levels cluster together (grouped 0.5 lines), they create a high-confluence zone. In market dynamics, price naturally gravitates towards these grouped levels.
Targeting & Bias Reading: The script not only pinpoints where a reversal might start but also helps predict where the move could end. For example, if the price bounces perfectly from a Lower TT Box, the immediate and most logical target for that bullish reversal is often the nearest cluster of grouped 0.5 levels above. This allows traders to effectively gauge their bias and establish clear take-profit zones.
Internal & External Range Liquidity (IRL / ERL): The code maps out swing pivots (ERL) and Fair Value Gaps (IRL). This provides additional context on liquidity sweeps and market imbalances that often precede or confirm reversals.
Comprehensive Alert System:
The indicator includes a built-in, ready-to-use alert system to keep you notified of structural changes in real-time:
Box Activation Alerts: Get notified instantly when the Lower Box is Active or the Upper Box is Active (triggering a Touch & Turn).
Combined Confluence Alerts: Optional alerts allow you to be notified when an active box perfectly aligns with the creation of structural liquidity, such as “Lower Box Active with Bullish IRL Created” or “Upper Box Active with Bearish IRL Created”. This helps you catch reversals backed by strong momentum and imbalance confirmation.
Whether you are trying to catch a precise reversal or aiming to ride the wave toward clustered equilibrium (0.5) levels, the Touch Turn Reversal Zones indicator provides a clear, structured roadmap of price action.
Disclaimer: This indicator is designed for educational and informational purposes only. Trading in financial markets involves a high degree of risk and may not be suitable for all investors. Past performance is not indicative of future results. Always perform your own backtesting, use proper risk management, and never make financial decisions based solely on the signals of a single indicator. אינדיקטור

Buy-Sell with Liquidity Breakout PRO using Volume Confluence# Liquidity Breakout PRO with Volume Confirmation — Swing Edition
A professional major swing breakout indicator designed to identify important liquidity breakout and breakdown zones using confirmed swing highs, confirmed swing lows, volume confluence, smart stop-loss modes, Fibonacci-based targets, and historical risk-reward boxes.
This indicator is built for traders who want cleaner breakout signals, structured trade planning, and visual performance review directly on the chart.
--------------------------------------------------
## What This Indicator Does
Liquidity Breakout PRO helps identify major breakout and breakdown opportunities after price crosses an important confirmed swing level.
Instead of reacting to every small move, this indicator focuses on major swing highs and swing lows. These levels often act as liquidity zones where stop orders, breakout traders, and institutional activity may become visible.
When price closes above a confirmed major swing high, the indicator marks a bullish breakout setup.
When price closes below a confirmed major swing low, the indicator marks a bearish breakdown setup.
Each confirmed signal comes with:
✅Entry level
✅Stop-loss level
✅Fibonacci-based target levels
✅Risk zone
✅Reward zone
✅Historical risk-reward box
✅Volume confirmation
✅Dashboard panel
--------------------------------------------------
## Core Concept
Markets often move from one liquidity zone to another.
A major swing high usually represents an area where sellers previously defended price. When price closes above that area with volume confirmation, it may suggest breakout strength.
A major swing low usually represents an area where buyers previously defended price. When price closes below that area with volume confirmation, it may suggest breakdown weakness.
This indicator is designed around that simple idea:
✅Identify major liquidity level
✅Wait for confirmed close beyond that level
✅Check volume confluence
✅Plot entry, stop loss, and Fibonacci targets
✅Keep the setup on chart for future performance review
--------------------------------------------------
## Key Features
📊 1. Major Swing Detection
The indicator uses confirmed pivot highs and pivot lows to identify important swing levels.
These are not random support and resistance lines. They are confirmed swing points based on user-defined left and right pivot strength.
This helps reduce noise and focuses only on important market structure level s.
--------------------------------------------------
📊 2. Non-Repainting Logic
Signals are generated only after candle close.
The indicator uses confirmed pivot levels and candle-close breakout confirmation. This means signals are not designed to appear and disappear during live candle movement.
Important note: pivot-based swing levels naturally confirm after the selected right-side candles are completed. This delay helps improve swing reliability and reduces false signals.
--------------------------------------------------
📊 3. Volume Confluence
Breakout signals become stronger when supported by volume.
The indicator includes a volume filter that checks whether current volume is greater than the average volume multiplied by the selected volume multiplier.
This helps avoid weak breakout attempts where price crosses a level without strong participation.
--------------------------------------------------
📊 4. ATR Breakout Buffer
Many breakouts fail because price barely crosses a level and then quickly reverses.
To reduce such weak signals, the indicator includes an optional ATR-based breakout buffer.
This means price must close beyond the swing level with a minimum volatility-adjusted distance before a signal is generated.
--------------------------------------------------
📊 5. Multiple Stop-Loss Modes
Different traders use different stop-loss styles, so this indicator provides multiple SL calculation modes.
Available stop-loss modes:
✅Previous Candle
✅ATR
✅Major Swing Level
✅Breakout Candle
✅Previous Candle + ATR Buffer
This gives flexibility for intraday traders, swing traders, and positional traders.
--------------------------------------------------
## Stop-Loss Modes Explained
📊 Previous Candle
For a buy breakout, stop loss is placed below the previous candle low.
For a sell breakdown, stop loss is placed above the previous candle high.
This is useful for traders who prefer tighter and structure-based stop losses.
--------------------------------------------------
📊 ATR
For a buy breakout, stop loss is calculated below entry using ATR.
For a sell breakdown, stop loss is calculated above entry using ATR.
This is useful for traders who want volatility-adjusted stop losses.
--------------------------------------------------
📊Major Swing Level
For a buy breakout, stop loss is placed near the last confirmed major swing low.
For a sell breakdown, stop loss is placed near the last confirmed major swing high.
This is useful for traders who prefer wider structure-based stops.
--------------------------------------------------
📊 Breakout Candle
For a buy breakout, stop loss is placed below the breakout candle low.
For a sell breakdown, stop loss is placed above the breakout candle high.
This is useful when traders want the breakout candle itself to define risk.
--------------------------------------------------
📊 Previous Candle + ATR Buffer
This mode uses the previous candle high or low with an added ATR cushion.
For a buy breakout, stop loss is placed below the previous candle low with ATR buffer.
For a sell breakdown, stop loss is placed above the previous candle high with ATR buffer.
This is a balanced stop-loss method because it gives slightly more breathing room than a pure previous candle stop.
--------------------------------------------------
##Separate Fibonacci Target Calculation
One important feature of this indicator is that Fibonacci targets are calculated separately from stop loss.
This means if stop loss becomes wider, targets do not automatically become wider.
Targets are based on a separate target range calculation, not on risk distance.
This avoids unrealistic target expansion when using wide stop-loss methods.
--------------------------------------------------
## Fibonacci Target Base Options
The indicator provides different target base modes:
✅Major Swing Range
✅Breakout Candle Range
✅ATR Range
📊Major Swing Range
Targets are calculated using the range between the latest major swing high and major swing low.
This is suitable for swing trading and higher timeframes.
📊Breakout Candle Range
Targets are calculated using the breakout candle range.
This is useful for intraday traders who want more practical and closer targets.
📊 ATR Range
Targets are calculated using ATR.
This gives volatility-adjusted target levels.
--------------------------------------------------
## Risk-Reward Boxes
Every confirmed signal plots a visual risk-reward structure on the chart.
✅The red box shows the risk zone.
✅The green box shows the reward zone.
✅Fibonacci target zones are displayed visually so traders can instantly understand where TP1, TP2, and TP3 are placed.
Historical boxes can remain on the chart, allowing traders to review past signal performance visually. Those who dont want any noise on the chart can opt out from historical boxes in the Settings menu.
This helps users observe:
✅Which signals reached target
✅Which signals hit stop loss
✅How price reacted after breakout
✅How often TP1, TP2, or TP3 was reached
✅Whether breakout continuation was strong or weak
--------------------------------------------------
## Visual Features
This indicator includes multiple visual enhancements:
✅Premium color themes
✅Risk-reward box styles
✅Layered Fibonacci target zones
✅Signal candle highlight
✅Breakout background flash
✅Signal glow effect
✅Custom line styles
✅Dashboard panel
✅Historical setup plotting
These features are designed to make the chart more readable, more professional, and easier to analyze.
--------------------------------------------------
## Best Default Settings
For a balanced setup:
Pivot Left Strength: 20
Pivot Right Strength: 20
ATR Breakout Buffer: ON
ATR Buffer Multiplier: 0.15
Volume Confluence: ON
Volume Multiplier: 1.3
Stop Loss Mode: Previous Candle + ATR Buffer
SL Buffer ATR Multiplier: 0.20
Fibonacci Target Base: Major Swing Range
Targets: 1.0 / 1.618 / 2.618
Keep Previous Target/SL Boxes: ON
--------------------------------------------------
## Suggested Intraday Settings
For 15-minute or lower timeframes:
Pivot Left Strength: 10
Pivot Right Strength: 10
ATR Breakout Buffer: 0.10
Volume Multiplier: 1.2
Stop Loss Mode: Previous Candle or Previous Candle + ATR Buffer
Fibonacci Target Base: Breakout Candle Range
Risk-Reward Box Extension: 20–25 bars
--------------------------------------------------
## Suggested Swing Trading Settings
For 1H, 4H, or daily charts:
Pivot Left Strength: 20–30
Pivot Right Strength: 20–30
ATR Breakout Buffer: 0.15–0.30
Volume Multiplier: 1.3–1.5
Stop Loss Mode: Previous Candle + ATR Buffer or Major Swing Level
Fibonacci Target Base: Major Swing Range
Risk-Reward Box Extension: 25–40 bars
--------------------------------------------------
## How To Use
1. Wait for a major swing high or swing low to form.
2. Let price break and close beyond the swing level.
3. Check whether the signal is volume confirmed.
4. Observe the plotted entry, stop loss, and Fibonacci targets.
5. Use the risk-reward box to understand the trade structure.
6. Avoid taking signals directly into strong nearby support or resistance.
7. Use higher timeframe trend direction for stronger confirmation.
--------------------------------------------------
## Bullish Signal
A bullish breakout signal appears when price closes above a confirmed major swing high with required confluence.
This suggests that buyers may be taking control above a previous liquidity zone.
--------------------------------------------------
## Bearish Signal
A bearish breakdown signal appears when price closes below a confirmed major swing low with required confluence.
This suggests that sellers may be taking control below a previous liquidity zone.
--------------------------------------------------
## Best Use Cases
📊Breakout trading
📊Liquidity breakout analysis
📊Market structure trading
📊Swing high and swing low breakout setups
📊Intraday breakout confirmation
📊Multi-timeframe analysis
📊Risk-reward planning
--------------------------------------------------
⚠️ Important Notes
⚠️ No indicator can predict the market with certainty.
⚠️ This tool is designed to help with structure, confirmation, and visual trade planning.
⚠️ Always combine signals with market context, higher timeframe direction, support and resistance, risk management, and your own trading plan.
⚠️ Avoid using any breakout signal blindly. This indicator itself suggests that using Stoploss is more important than Targets. Always use stoploss to protect the capital.
--------------------------------------------------
Trading Rules & Best Practices
✅ When to Use This Indicator
Trend-Following Setups: Use on trending charts where swing levels have clear structure
Breakout Trading: Ideal for breakout traders targeting support/resistance breaks
Range Identification: Works well when price oscillates between major highs/lows
Multi-Timeframe Analysis: Use higher timeframes (4H, 1D) to identify major swings for entry on lower timeframes
⚠️ When NOT to Use
Choppy/Ranging Markets: In sideways markets, many false breakouts may occur
Low Liquidity Assets: Volume filter may never trigger; consider disabling it
Highly Volatile Instruments: Increase ATR buffer multiplier to reduce noise
--------------------------------------------------
## Risk Disclaimer
This indicator is for educational and analytical purposes only. It does not provide financial advice, investment advice, or guaranteed trading signals.
Trading and investing involve risk. Always use proper risk management and do your own analysis before taking any trade.
--------------------------------------------------
Test it on different timeframes and comment which SL mode works best for your trading style.
Feedback and improvement suggestions are welcome. אינדיקטור

High Volume Pivot Support & Resistance Zones [BigBeluga]High Volume Pivot Support & Resistance Zones is a market-structure indicator built for TradingView. It helps traders find key support and resistance levels by looking for major pivot points backed by institutional volume.
Instead of drawing simple unweighted lines, this tool tracks the volume of swing highs and lows. When a high-volume pivot is found, the script creates a dynamic zone box on your chart and fits a live Cumulative Volume Delta (CVD) trendline inside it. This lets you monitor real-time buying and selling pressure exactly where the market is most likely to reverse.
🔵 MAIN ENGINE & VOLUME ZONE LOGIC
1. Volume-Validated Pivots
Swing Isolation Fields: The tool uses customizable lookback settings ( Resistance/Support Pivot Length ) to find prominent structural swing highs and lows.
Institutional Volume Filters: Every new swing point is checked against a volume baseline ( Volume MA Length ). A zone is only plotted if the pivot bar's volume beats the baseline multiplier ( Volume Threshold Multiplier ), filtering out weak retail moves.
2. Embedded Zone CVD Lines
Intra-Box Order Flow Tracking: The script counts the volume delta (buying volume minus selling volume based on candle closes) from the exact bar the pivot formed.
Normalized Inside the Box: Using custom polylines, the script scales and plots the rolling CVD trend directly inside the height of the zone box. This lets you see order-flow accumulation without cluttering your screen with bottom dashboard panels.
Live Labels: A small text readout updates on the leading edge of the box, showing the current net CVD volume.
// Normalize and scale running CVD values perfectly inside the zone box coordinates
normalizeDeltaToBox(float currentDelta, float minDelta, float maxDelta, float boxBottom, float boxTop) =>
float rangeDelta = maxDelta - minDelta
float rangeBox = boxTop - boxBottom
rangeDelta == 0 ? boxBottom + rangeBox / 2 : boxBottom + (currentDelta - minDelta) / rangeDelta * rangeBox
🔵 DYNAMIC ZONE FLIPS & SIGNALS
1. Support and Resistance Flips
Automatic Re-Coloring: When a strong candle close breaks entirely through a zone, the script changes its role. Broken resistance boxes switch to your Support Zone Color (yellow), and broken support boxes turn into your Resistance Zone Color (blue).
Border Style Changes: The box outline instantly switches from a solid line to a dashed line the moment a zone is breached, flagging a clear shift in institutional liquidity.
2. Retest and Breakout Plots
Breakout Arrows: The system prints clean triangle up or down arrows ( ▲ or ▼ ) on your chart labeled "Res Breakout" or "Sup Breakdown" the exact bar a zone boundary fails.
Proximity Retest Shapes: It plots tiny circle markers when price pulls back to successfully test a normal support/resistance hold. If price tests a broken zone that has reversed roles, it prints a diamond marker to flag an advanced flipped S/R retest.
// Zone Breakout and Role Inversion Logic snippet
if close > rTop
box.set_bgcolor(lastResBox, color.new(supColor, 90))
box.set_border_color(lastResBox, supLine)
box.set_text_color(lastResBox, supLine)
box.set_border_style(lastResBox, line.style_dotted)
if not resBroken
triggerResBreak := true
resBroken := true
🔵 TRADING STRATEGIES & RISK
CVD Absorption Entries: When price rallies up into a blue resistance box, check the internal dotted CVD line.
If price pushes high into the box but the internal CVD trend slopes down, sellers are absorbing the buy orders. This sets up a high-probability short entry.
Flipped Support Re-Entries: When a bullish breakout triggers a "Res Breakout" arrow, wait for price to pull back to the top border of the broken box. A clean bounce marked by a diamond shape confirms the old resistance has flipped to support, offering a safe continuation trade.
Clear Risk Invalidation floors: You can use the exact borders of the generated boxes to place your stop loss. If you buy a support hold retest, your clear risk invalidation point sits right below the bottom line of that specific support box.
🔵 SETTINGS & CONFIGURATION
Pivot Geometry Controls: Easily fine-tune lookback lengths and volume multipliers to adapt the indicator for volatile crypto assets, indexes, or liquid forex pairs.
Visual Zone Overrides: Adjust background colors, transparency levels, and text label sizing to match your dark or light charting interface seamlessly.
Clean up your layout and trade with volume-weighted precision using the High Volume Pivot Support & Resistance Zones terminal. אינדיקטור

Squeeze Momentum Pro - TTM Squeeze, Volatility Breakout & MomentSqueeze Momentum Pro - TTM Squeeze, Volatility Breakout & Moment is a modern volatility squeeze and momentum indicator for TradingView that shows you exactly when the market is coiling (building energy) and the precise moment that energy fires into a trend. It combines the classic TTM Squeeze concept — Bollinger Bands contracting inside the Keltner Channel — with a multi-tier compression engine (Squeeze Pro) and a glowing momentum histogram, so you can trade breakouts, momentum, trend continuation and volatility expansion on any market and any timeframe: forex, crypto, stocks, indices, futures, gold (XAUUSD), Bitcoin (BTCUSD), NASDAQ, S&P 500, oil and more. Built in Pine Script v6, it adds neon momentum candles, rare high-conviction squeeze fire signals and a live dashboard — a clean, professional upgrade over a plain squeeze momentum oscillator. Keywords: squeeze momentum, squeeze pro, TTM squeeze, volatility squeeze, momentum indicator, Bollinger Bands, Keltner Channel, breakout indicator, volatility breakout, momentum oscillator, trend, buy sell signals, scalping, day trading, swing trading, no repaint.
◆ WHY THE SQUEEZE WORKS
When Bollinger Bands contract inside the Keltner Channel, volatility is compressing — the market is coiling like a spring. Low volatility is always followed by high volatility. The squeeze tells you a big move is building; the momentum histogram tells you which direction it is most likely to release. Trading the release of a squeeze is one of the highest-reward, lowest-risk setups in technical analysis.
◆ WHAT IT DOES
3 compression tiers (Squeeze Pro): HIGH (BB inside KC x1.0, tightest coil), MID (x1.5), LOW (x2.0), and EXPANSION (bands released). Tier is shown by colour-coded dots on the zero line.
Neon momentum histogram: linear-regression momentum that glows brighter as it extends and dims as it fades — instant read of strength and direction.
Squeeze Fire signals: rare, high-conviction arrows that fire only when a real coil (HIGH/MID) releases — filtered to remove noisy weak releases.
Neon momentum candles: your chart candles are tinted by momentum (turquoise up / magenta down).
Live dashboard: State, a unique Coil Energy gauge (stored energy of the coil), Momentum strength, Signal and Bias.
◆ HOW IT WORKS (under the hood)
Bollinger Bands (length/multiplier) measure compression; Keltner Channel (ATR-based) is the volatility reference. A squeeze is active when both BB edges sit inside the KC edges.
Three KC multipliers create three compression tiers so you can tell a mild coil from a maximum-tension coil.
Momentum is a linear regression of price versus the average of the Donchian midline and the moving average (LazyBear method).
The script tracks the tightest tier reached during each coil; a fire is only flagged when the coil reaches your chosen tier and then releases — so arrows mean something.
Coil Energy accumulates from how long and how tightly price has been compressed, and discharges on release — a unique read of stored breakout potential.
◆ HOW TO USE IT
Wait for a squeeze (especially a HIGH tier — tightest spring). The dashboard shows State and rising Coil Energy.
On the Squeeze Fire arrow, enter in the direction of the histogram colour (teal = long, magenta = short).
Stay in while momentum keeps extending (bars growing, bright colour); exit as momentum fades (bars shrinking, dim colour) or flips across the zero line.
Use Fire on release from to control signal frequency: HIGH only (rare, strongest) → MID+ → Any (more signals).
Works on all symbols and timeframes; combine with your own support/resistance, structure or trend tools for confluence.
◆ SETTINGS
Squeeze Engine: BB length & multiplier, KC length, KC multipliers for HIGH/MID/LOW tiers.
Momentum: linear-regression length.
Fire Signals: release tier threshold (HIGH only / MID+ / Any).
Histogram / Candles: glow, tint chart candles by momentum, optional squeeze-zone shading, fire markers.
Panel: show/hide, position, background, accent colour.
◆ ALERTS
Squeeze Fire Long / Short
High Squeeze started (maximum compression)
Momentum crossed zero
◆ LIMITATIONS
This is a momentum/volatility tool, not a complete system — always confirm with price action and risk management.
On forex and crypto, volatility (ATR) and momentum reflect the data feed of your broker/exchange; results can vary slightly between feeds.
A squeeze signals that a move is building, not its direction with certainty — the momentum colour gives the probable bias, not a guarantee.
With "HIGH only" some calm instruments may rarely reach the tightest tier; loosen the KC HIGH multiplier or switch to "MID+" if you want more signals.
◆ NON-REPAINTING
Every value comes from confirmed bar data with no lookahead and no security() smoothing tricks. A signal printed on a closed bar stays. As with any live tool, the current forming bar updates in real time and settles on close.
Squeeze Momentum Pro - TTM Squeeze, Volatility Breakout & Moment is an educational analysis tool, not financial advice. Always do your own research and manage risk. © LunqFX. אינדיקטור

HTF ORDER FLOW [erdensedat]The HTF ORDER FLOW is an advanced, all-in-one institutional trading indicator designed to bring High Timeframe (HTF) market structure, volume profile dynamics, and order flow context directly to your current chart. By combining deep volume analysis with the BLVL (BOS/CHoCH) break detection algorithm, this script offers a comprehensive view of institutional activity without cluttering your screen.
Key Features:
HTF Candle Projection: Projects the live Higher Timeframe candle (e.g., Daily, Weekly) seamlessly onto your current trading timeframe with customizable width and opacity.
Dynamic Volume Profile: Displays a customized Volume Profile mapped specifically to the HTF period. It highlights the Point of Control (POC), Value Area High (VAH), and Value Area Low (VAL) to instantly visualize where the majority of trading volume took place.
High Volume Nodes (HVN): Automatically highlights specific bins inside the profile that experience significantly higher volume, signaling potential hidden support or resistance areas.
Initial Balance (IB) & VWAP Tracking: Tracks and extends the Initial Balance High/Low and the Volume Weighted Average Price (VWAP) for the HTF session.
Previous Day/Week (PD/PW) Levels: Toggle critical historical liquidity levels such as Previous Day Open/High/Low and Previous Week Open/High/Low, drawing them exactly from their historical birth-points.
Premium & Discount Zones: Automatically calculates and displays Premium and Discount range boxes relative to the HTF candle, helping you visualize equilibrium and optimal entry zones.
Integrated BLVL System (BOS/CHoCH): A built-in Fractal break-of-structure engine that detects and labels potential and confirmed structural shifts (BOS / CHoCH). It displays live candidate lines and solidifies them once a structural break is confirmed by price action.
Custom Styling Engine: Choose from beautiful pre-built visual themes (Classic TV, Cyberpunk, Midnight, Forest, Luxury Gold) or enable total custom control over specific lines like VWAP, VAH/VAL, and IB levels.
The Quantum Signal HUD Panel:
Located at the top right of your chart, the built-in Heads Up Display (HUD) acts as your real-time order flow navigator. It tracks:
Price & VWAP: Current price relation to the HTF VWAP.
Market Bias: Displays a simple BULLISH/BEARISH bias based on the VWAP baseline.
Quantum Signal: Analyzes cumulative volume delta (CVD) relative to VWAP positioning to interpret market state as "INST. BUYING", "INST. SELLING", or "NEUTRAL/TRAP".
Session Progress: Shows the percentage of time elapsed in the current HTF candle.
HTF CVD: The live Cumulative Volume Delta of the ongoing HTF session.
How to Use:
Use the HTF Volume Profile and Premium/Discount boxes to identify where institutions are doing business. Wait for the integrated BLVL system to confirm a structural shift (CHoCH or BOS) inside these key liquidity zones. Check the Quantum Signal HUD to ensure institutional order flow (CVD) aligns with your bias before entering a trade.
Optimize your edge by trading with the HTF trend, volume, and structure. אינדיקטור

FVG Bias Finder [erdensedat]The "FVG Bias Finder " is an advanced, all-in-one price action toolkit designed to help traders identify structural shifts, market bias, and high-probability zones of interest. By combining core Smart Money Concepts (SMC) such as Break of Structure (BOS), Change of Character (CHoCH), and Fair Value Gaps (FVG), this script provides a clear and objective view of the market trend and institutional footprints.
Key Features & Functionality
Dynamic Market Structure (BOS & CHoCH):
The indicator automatically maps out pivot highs and lows (fractals) to detect structural breaks. Pre-break "candidate" lines help you anticipate incoming structure shifts. Once broken, the lines dynamically change to indicate a confirmed BOS or CHoCH.
High-Volume BOS Detection:
Not all breakouts are equal. The script filters and highlights structural breaks that occur with significant volume (volume exceeding a configurable SMA multiplier). It plots a highlighted zone and prints the exact volume at the breakdown/breakout point, confirming true displacement.
Advanced FVG Engine (erdensedat):
The core of the indicator heavily relies on detecting Fair Value Gaps (FVGs).
Draws bullish and bearish FVGs with customizable lengths and threshold filters based on ATR.
Tracks mitigation logic in real-time (Close, Wick, or Average).
Overlap hiding capabilities to keep your charts clean.
Plots a dynamic SMA trajectory inside the unmitigated gaps to gauge short-term trend strength within the zone.
Bias Directional Signals:
The indicator removes the guesswork by printing explicit Bullish (Green) and Bearish (Red) arrows. A signal is triggered when:
A BOS occurs while a corresponding directional FVG is currently active.
A BOS and a fresh FVG are confirmed on the exact same candle.
This creates high-probability setups, confirming that structural breaks are supported by strong momentum (displacement).
Additional Confluence Tools:
Built-in toggles allow you to overlay VWAP and up to two Moving Averages (SMA, EMA, RMA, WMA, HMA) directly from the indicator settings, eliminating the need to clutter your chart with multiple separate indicators.
How to Use It
Trend Following: Use the BOS/CHoCH mapping in combination with the directional arrows to ride the prevailing trend. When an arrow prints, it signifies that structure has shifted with institutional displacement (FVG).
Entries & Pullbacks: Wait for the price to retrace into the active unmitigated FVG boxes (Bullish Green / Bearish Red zones) following a structural break to find optimal trade entries.
Filtering Noise: Pay close attention to the "High Volume" highlights on the BOS lines. A break of structure backed by high volume implies a stronger likelihood of continuation.
Disclaimer: This script is an analytical tool and does not guarantee future performance. Always use proper risk management. אינדיקטור

Mr. Market MakerMr. Market Maker (MR.MM)
Mr. Market Maker is an advanced technical analysis tool designed for traders following Smart Money Concepts (SMC) and institutional trading frameworks. It automates the complex process of identifying structural shifts in the market, specifically focusing on trend reversals and continuations using precision-calculated Gann levels.
Key Features:
Dynamic Market Structure Detection:
The script uses a sophisticated fractal-based algorithm to identify Pivot Highs and Lows. These levels serve as the foundation for institutional supply and demand zones.
Dual-Engine Setup Logic:
CHoCH Engine (Change of Character): Automatically detects when the market sentiment shifts from bullish to bearish (or vice versa), identifying high-probability reversal setups.
BOS Engine (Break of Structure): Tracks trend continuation signals, allowing traders to scale into positions during strong trending phases.
Both engines operate independently and can be toggled on/off based on your trading strategy.
Automated Gann Box Execution:
Upon a structural break, the script instantly draws a customized Gann Box. It highlights the 0.382 - 0.618 "Entry Zone", which is widely regarded as the optimal institutional discount/premium area for entries.
Real-Time Liquidity Mapping:
The indicator identifies and visualizes "Candidate" levels. These horizontal levels represent Sell-Side and Buy-Side Liquidity, providing you with dynamic targets and logical stop-loss placements.
Integrated Trend Filtering:
Includes a multi-type Moving Average filter (SMA, EMA, WMA, HMA, RMA) to ensure that your setups are always aligned with the macro trend, significantly reducing "fake-out" signals.
Smart Alert System:
A consolidated alert engine monitors both CHoCH and BOS setups. It triggers a notification the moment price enters the defined Entry Zone, ensuring you never miss a high-conviction trade.
Optimized Visual Management:
The "Show Last N" feature keeps your chart clean by managing object counts, while the "Sliding Update" logic ensures that active setups dynamically extend to the current price action.
Disclaimer
Trading involves significant risk of loss and is not suitable for every investor. The "Mr. Market Maker" indicator is provided for educational and informational purposes only. It does not constitute financial, investment, or trading advice. Past performance is not indicative of future results. The developer and associated parties are not responsible for any financial losses incurred through the use of this script. Always perform your own due diligence, backtest thoroughly, and use appropriate risk management before trading with real capital. אינדיקטור

Crucible Range Compression [JOAT]Crucible Range Compression
Crucible Range Compression detects volatility-compression episodes by blending three independent contraction proxies — Bollinger Band Width percentile, ATR percentile, and body-range Z-score — into a single intensity score. While compressed, the script tracks Cumulative Volume Delta inside the compression window to predict breakout direction. On confirmed compression exit it projects a chamber-width target line. A history strip records each completed compression with its outcome.
What makes it different
Single-metric volatility-contraction indicators (BBW or ATR alone) can be misled by price-level changes. The composite intensity uses three normalized metrics, each over a percentile lookback, so contraction across multiple lenses is required for a true compression read.
The compression chamber is drawn as a dynamic box (top and bottom bounds expanding while the compression remains active) with three nested concentric rings that visually tighten as intensity increases. A clear visual countdown to breakout.
Inside the chamber, CVD slope predicts breakout direction before the breakout occurs. A direction-bias gauge surfaces this prediction in a 21-segment vertical scale.
Two forward projection lines appear AFTER compression exits but BEFORE the breakout candle confirms — bull target at chamber-high plus width, bear target at chamber-low minus width. Once the direction confirms, only the active target survives.
A false-breakout signal fires when price breaks in the opposite direction of CVD's bias. A high-value warning that a fast reversal is likely.
How it works
Bollinger Band Width equals (upper minus lower) divided by basis. Convert to percentile rank over a 100-bar lookback.
ATR(14) percentile rank over the same lookback.
Body range equals the absolute distance between close and open. Body Z equals (body minus sma(body, 20)) divided by stdev(body, 20). Map to a 0-1 score where small bodies equal 1.
Intensity equals 0.40 times (1 minus BBW%) plus 0.40 times (1 minus ATR%) plus 0.20 times body score. Range 0 to 1 where 1 equals maximum compression.
Compression active when intensity exceeds the user threshold (default 0.7). Chamber bounds are the running max / min of high / low while active.
CVD inside the chamber: delta equals plus volume on up bars, minus volume on down bars, zero otherwise, summed since chamber start. Slope equals total delta divided by bars in chamber.
On exit (intensity drops below threshold), if close above chamber high and CVD bias above 0, bull breakout. If close below chamber low and CVD bias below 0, bear breakout. If price breaks one way but CVD predicted the other, false-breakout signal.
Target on confirmed direction equals breakout close plus or minus chamber width.
Reading the chart
Outer compression chamber box, transparency-modulated by intensity, anchored at compression start.
Three nested concentric rings inside the chamber, smaller and smaller, tinted by direction bias.
Iridescent candle recolor scales transparency with intensity (faded while compressed, vivid on expansion).
Forward projection lines (bull target and bear target) appear at compression exit and disappear when one direction confirms.
A confirmed target line plus price label persists until hit or expired.
bgcolor pulses: 3-bar fade on compression entry, 2-bar fade on confirmed breakout (bull / bear).
Chamber exit pulse: border alpha cycles for 3 bars when compression exits.
A right-edge intensity gauge label with intensity %, state, bias, bars in.
A right-side 21-segment direction-bias gauge mirroring CVD slope.
Pre-compression bgcolor highlight when intensity is approaching the threshold.
An intensity history mini-strip on the right edge showing the last 10 intensity values as colored line segments.
A compression history strip (last 10 completed compressions with outcomes).
A daily compression counter.
Signals
Compression entry (intensity crosses above threshold)
Compression exit (intensity drops below threshold, breakout pending)
Bull breakout confirmed
Bear breakout confirmed
False breakout (direction mismatch with CVD bias)
All gated on barstate.isconfirmed or barstate.ishistory. No future references.
Inputs
Compression : BB length, BB stdev multiplier, percentile lookback, activation threshold, chamber initial length, target line extension bars.
Visual : bullish, bearish, neutral colors. Chamber, nested rings, candles, target line, pulses, gauge toggles.
On-chart : compression history, intensity strip, pre-compression highlight, bias gauge, projection lines, target hit/miss labels, false-breakout revert line, state block, cycle counter, exit pulse.
Dashboard : position, size.
How traders use this
Breakout entries : wait for the confirmed bull / bear breakout signal AND the CVD-bias gauge to be aligned. False-breakout signals when these disagree are reasons to pass or fade.
Range trading : while compression is active (chamber visible), reactions to chamber high / low are intra-range scalp setups.
Target management : once the breakout fires and the target line appears, common practice is to scale out at chamber-mid first, then chamber-target. The chamber width is the implied move.
Compression history : see how previous compressions resolved on the current instrument. A series of Win entries means the setup has been productive recently.
Limitations
Compression detection requires warm-up history (100 bars for the percentile calculations). On very young charts the script is inert.
CVD bias inside a chamber is a probability, not a guarantee. False breakouts happen when liquidity sweeps stops on the predicted side first.
For instruments with very thin volume data, the CVD direction signal is less reliable.
The chamber width is a measured-move proxy. Actual move size can exceed or fall short.
Compatibility
Pine Script v6 open-source indicator (overlay). Any symbol, any timeframe (more bars equals more reliable percentile context). No request.security calls.
Defaults
20-bar BB, 2.0 BB stdev, 100-bar percentile lookback, 0.7 activation threshold, 20-bar initial chamber length, 40-bar target extension, mint / red / gray palette, top-right medium dashboard.
אינדיקטור

Squeeze Momentum Setup Assistant
BB/KC squeeze detection with MA trend signals, RSI filtering, and ATR-based stop/target levels.
Squeeze Momentum Setup Assistant is a hybrid volatility and trend-confirmation tool designed to help traders identify potential breakout setups, trend shifts, and ATR-based risk levels directly on the chart.
The indicator combines Bollinger Bands and Keltner Channels to detect squeeze conditions. A squeeze occurs when the Bollinger Bands contract inside the Keltner Channels, suggesting a period of reduced volatility and possible energy buildup.
When the squeeze releases, the script uses a simple momentum calculation to classify the potential breakout direction:
- SqueezeUp appears when volatility releases with positive momentum.
- SqueezeDown appears when volatility releases with negative momentum.
In addition to squeeze detection, the indicator includes a moving average crossover system with RSI filtering:
- A Call signal appears when the short moving average crosses above the long moving average while RSI remains below the overbought zone.
- A Put signal appears when the short moving average crosses below the long moving average while RSI remains above the oversold zone.
For each Call or Put setup, the indicator automatically calculates ATR-based stop and target levels. This helps traders visualize potential risk and reward zones without manually measuring volatility.
Key features:
- Bollinger Band and Keltner Channel squeeze detection
- Squeeze release direction labels
- Moving average crossover signals
- RSI-based signal filtering
- ATR-based stop loss and target projections
- Visual trend and volatility structure on the chart
This tool is designed for traders who want to combine volatility compression, momentum release, trend confirmation, and risk planning in one visual framework.
Best used with market structure, VWAP, support and resistance, volume confirmation, and higher timeframe trend context.
Important:
This indicator does not predict future price movement and should not be used as a standalone trading system. Squeeze releases can fail, moving average crossovers can lag, and ATR levels are only volatility-based reference zones. Always use proper risk management and additional confirmation.
A hybrid squeeze and trend setup assistant that combines BB/KC volatility compression, momentum release direction, MA crossover signals, RSI filtering, and ATR-based stop/target levels.
How it works:
The indicator first compares Bollinger Bands against Keltner Channels to detect volatility compression. When the Bollinger Bands move inside the Keltner Channels, the market is considered to be in a squeeze.
When the squeeze releases, momentum is used to estimate the possible breakout direction.
Separately, the script evaluates short and long moving average crossovers with RSI filtering to identify possible Call and Put setups.
When a Call or Put condition appears, the indicator calculates projected stop and target levels using ATR, allowing traders to quickly visualize volatility-adjusted risk zones.
Inputs:
BB Length:
Controls the Bollinger Band lookback period.
BB Multiplier:
Controls the width of the Bollinger Bands.
KC ATR Length:
Controls the ATR length used for the Keltner Channel calculation.
KC Multiplier:
Controls the width of the Keltner Channels.
Momentum Length:
Controls the lookback period used to estimate squeeze release direction.
Short MA Length:
Controls the fast moving average used for crossover signals.
Long MA Length:
Controls the slow moving average used for crossover signals.
RSI Length:
Controls the RSI filter used to avoid extreme overbought or oversold entries.
ATR Length for SL/Target:
Controls the ATR calculation used for stop and target projections.
Target Multiplier:
Defines how far the projected target is placed from the signal price using ATR.
Stop Loss Multiplier:
Defines how far the projected stop is placed from the signal price using ATR.
אינדיקטור

Crown Structure Ledger [JOAT]Crown Structure Ledger
Introduction
Crown Structure Ledger is an open-source market structure ledger built to classify price through three structural horizons at the same time: short-term, intermediate-term, and primary-term.
Instead of reducing structure to a single swing model, this script maintains separate rails for each horizon so users can see where local repricing, intermediate repricing, and larger campaign structure are currently positioned.
The indicator is designed to solve a common chart-reading problem:
Traders often know price is moving, but they do not know whether the move is merely a short-term impulse inside a larger range, an intermediate continuation, or a genuine primary expansion.
Crown Structure Ledger addresses that by combining:
confirmed pivot structure
active break state tracking
adaptive ATR corridors
EMA trend context
volume-pressure bias scoring
state-based candle coloring
forward structure projection
a top-right institutional dashboard
The output is intentionally visual but restrained.
Instead of cluttering the chart with excessive markers, the script emphasizes live structural rails, shaded corridors, confirmed state transitions, and a dashboard that summarizes the current condition of each structural layer.
Core Concepts
1. Three-Horizon Structure Mapping
The script confirms three separate pivot systems using different left/right lengths.
This creates a short-term layer for local impulse, an intermediate layer for swing control, and a primary layer for broader directional structure.
Each confirmed pivot updates its own active rail instead of overwriting the other layers.
2. Confirmed Break Logic
Break states are only recognized on confirmed bars.
This means the script does not react to intrabar spikes through a level.
A structural state changes only when price closes through a live rail beyond a small corridor allowance.
3. Adaptive Structure Corridors
Every rail is wrapped in an ATR-based corridor.
When adaptive depth is enabled, the corridor expands or contracts according to volatility conditions so the structure model stays usable across slow and fast environments.
4. Pressure-Weighted Bias
The indicator includes a directional pressure score based on up-volume versus down-volume across a configurable window.
That pressure score is combined with EMA orientation and structure state to create a bias color system rather than a binary trend flag.
5. Forward Projection
Current structural rails can be extended forward so the user can see where the next important structural interaction is likely to occur without manually drawing continuation levels.
Features
Three structure horizons: short, intermediate, and primary rails tracked independently
Adaptive structure corridors: live ATR-based zones around active rails
Confirmed structural transitions: break states only update on confirmed bars
Break labels: optional state labels appear when a new structural expansion or compression is confirmed
EMA trend filter: fast and slow EMA alignment supports the structure interpretation
Volume-pressure bias model: directional pressure is estimated from relative up-volume and down-volume
Bias cloud: optional background cloud reflects broader directional control
Candle coloring: bars can be colored from bearish to bullish using a gradient-like bias response
Forward corridor projection: active rails can extend to the right edge of the chart
Institutional dashboard: top-right summary of structure state, bias, pressure, and live rail context
Input Parameters
Structure Engine
Short Pivot Length
Intermediate Pivot Length
Primary Pivot Length
Structure Corridor ATR
Adaptive Corridor Depth
ATR Length
Bias Filter
Fast EMA
Slow EMA
Pressure Window
Color Candles
Show Structure Cloud
Show Structure Rails
Show Break Labels
Visual System
Show Short Term
Show Intermediate Term
Show Primary Term
Show Forward Corridor
Forward Corridor Bars
Dashboard Position
Dashboard Size
How to Use This Indicator
Step 1: Read the Three States Separately
Start by checking whether short-term, intermediate-term, and primary-term structure agree.
When all three align, the chart is in a cleaner directional condition.
When they diverge, the market is often transitioning or rotating.
Step 2: Watch the Active Rails
The live rails mark the current structural boundaries that still matter.
These are the levels price must reclaim or lose to produce a confirmed structural update.
Step 3: Use the Corridors, Not Just the Line
The corridor around a rail is intentional.
It helps avoid overreacting to shallow level breaches in noisy conditions.
Step 4: Read the Bias Cloud and Candle Tone Together
If candle color, pressure bias, and the structure cloud all point in the same direction, the chart context is stronger than a single rail break by itself.
Step 5: Use the Dashboard as a Summary, Not a Shortcut
The dashboard is there to reduce scanning time.
It is best used as a summary of what the rails are already showing visually.
Indicator Limitations
Pivot-based structure confirms after the configured right-side bars complete, so signals are intentionally delayed for non-repainting behavior
Very aggressive settings can make the short-term layer overly sensitive on low-quality markets
In prolonged compression, structure may appear stable while directional follow-through remains weak
The indicator explains current structure; it does not guarantee continuation after a break
Originality Statement
Crown Structure Ledger is built around a layered structure ledger rather than a single swing map.
Its distinguishing value comes from maintaining three live structure horizons with adaptive corridors, pressure-aware bias scoring, forward projection, and a dashboard that keeps the chart readable while still exposing the full state of the engine.
Disclaimer
This indicator is provided for educational and informational purposes only.
It is not financial advice and should not be treated as a recommendation to buy or sell any financial instrument.
All structural readings are derived from historical price and volume data and can fail in abnormal market conditions.
Always use independent judgment and risk management.
אינדיקטור

אינדיקטור

Liquidity Intelligence Entry SystemLiquidity Intelligence System
Liquidity Intelligence System is a liquidity-based market analysis framework designed around one central idea:
market movement is often shaped by liquidity pools, stop sweeps, directional bias, displacement, volatility conditions, and the quality of confluence around a signal.
This script is not designed to mark every candle, every swing, or every possible reversal. It is not intended to behave like a simple buy/sell indicator that reacts to one isolated condition. Its purpose is to detect structured liquidity events, compare multiple confluence models in the background, classify the current market regime, display signal quality, and project a visual risk/reward framework directly on the chart.
The script combines liquidity sweep detection, trend confirmation, FVG presence, volume expansion, RSI extremes, displacement behavior, market regime logic, adaptive preset modes, TP1/TP2/TP3 projection, visual liquidity mapping, and a model-performance dashboard into one organized workflow.
The goal is to help users review liquidity-based signals in a more structured way, not to promise future performance or replace independent analysis.
🔓 PUBLICATION NOTE
This script is published to provide a structured liquidity-analysis workflow.
The description is intentionally detailed because many users do not inspect every part of the Pine Script logic line by line. The purpose of this page is to explain what the script does, how its components connect, why the system is organized this way, and what limitations should be understood before using it.
The script should be treated as a decision-support and research tool. It is not financial advice, it is not an automated trading system, and it does not guarantee profitable results.
📌 OVERVIEW
At a high level, Liquidity Intelligence System does several things:
1. It detects liquidity sweep conditions around recent swing highs and swing lows.
2. It identifies buy-side liquidity and sell-side liquidity areas.
3. It can mark Equal High and Equal Low liquidity pools.
4. It changes swept liquidity levels visually once price takes them.
5. It evaluates 16 different liquidity/confluence signal models in the background.
6. It allows the user to manually choose which model should be active on the chart.
7. It prevents repeated same-direction signals from stacking unnecessarily.
8. It calculates virtual trade outcomes for each model.
9. It displays model statistics such as Trades, Win Rate, Profit Factor, Average R, and Net R.
10. It identifies the current best-performing model according to a selected metric.
11. It detects the current market regime using trend, ADX-style directional movement, ATR behavior, and candle body conditions.
12. It gives the most recent signal a Signal Quality score.
13. It displays a Signal Quality panel with a visual score bar.
14. It projects Entry, TP1, TP2, TP3, and SL levels on the chart.
15. It draws soft reward and risk zones around the active signal.
16. It provides theme modes for different chart styles.
17. It includes dynamic alert messages with signal, model, quality, regime, entry, TP, SL, and performance details.
The script is therefore not a single-purpose liquidity sweep marker. It is a multi-model liquidity intelligence and signal-review framework.
🧠 CORE IDEA
The core idea of the script is that a liquidity sweep by itself is only one part of the story.
A market may sweep a previous high or low, but that does not automatically mean the move is actionable. A sweep can lead to reversal, continuation, expansion, or false movement depending on the broader context.
For that reason, Liquidity Intelligence System does not rely on one condition alone.
Instead, it builds a layered model around the following question:
When liquidity is taken, what other evidence exists around that event?
The system can evaluate liquidity events together with:
- trend direction,
- recent FVG behavior,
- volume expansion,
- RSI extreme positioning,
- displacement strength,
- current market regime,
- and model-specific confluence.
This allows the script to compare different interpretations of the same market environment.
For example, one user may prefer simple liquidity sweeps, while another may prefer liquidity sweeps only when FVG and trend alignment are also present. The script does not force one fixed interpretation. It allows multiple models to run in the background while the user selects the model they want to display.
🧩 WHY THIS SCRIPT IS NOT A SIMPLE MASHUP
This script combines several concepts that are familiar in technical analysis and liquidity-based trading:
- swing highs and swing lows,
- liquidity sweeps,
- equal highs and equal lows,
- FVG-style imbalance logic,
- trend filters,
- volume filters,
- RSI conditions,
- displacement candles,
- ATR-based risk projection,
- dashboard statistics,
- alert messages.
These individual concepts are not unique by themselves.
The main purpose of this script is the way these elements are organized into one structured liquidity workflow:
Liquidity map
→ sweep detection
→ confluence model selection
→ market regime classification
→ signal quality scoring
→ TP1/TP2/TP3 projection
→ model-performance dashboard
→ dynamic alert system
Each part has a specific role.
- The liquidity map shows where price may be interacting with stop pools.
- The sweep engine defines the base signal event.
- The confluence models decide which extra filters should be required.
- The regime engine gives context about the current environment.
- The quality panel summarizes the last signal.
- The dashboard compares the performance of different models.
- The TP/SL projection gives a visual review structure.
- The alert system allows monitoring without constantly watching the chart.
For that reason, the script is intended as one complete liquidity-intelligence framework, not as a random collection of unrelated tools.
💧 WHAT THE SCRIPT DOES
The script begins by detecting swing-based liquidity references.
It uses recent pivot highs and pivot lows to define potential buy-side and sell-side liquidity levels.
Then it can classify and draw:
- BSL: Buy-Side Liquidity
- SSL: Sell-Side Liquidity
- EQH: Equal High liquidity
- EQL: Equal Low liquidity
When price later trades through one of these mapped levels, the script can visually mark that level as swept. This makes the liquidity map more informative because old untouched levels and swept levels are no longer displayed the same way.
After the liquidity engine identifies sweep conditions, the script evaluates whether the sweep qualifies under one of the available model combinations.
Those models are tested in the background, while the user chooses which one should be active on the chart.
The active model controls the visible LONG / SHORT labels and the projected Entry / TP / SL structure.
⚙️ HOW THE SCRIPT WORKS
1) LIQUIDITY SWEEP ENGINE
The script uses swing pivots to identify important recent highs and lows.
A buy-side sweep occurs when price moves above a previous swing high and then closes back below that swing high.
A sell-side sweep occurs when price moves below a previous swing low and then closes back above that swing low.
The script also checks sweep depth and wick rejection. This helps avoid treating every small break of a level as an equally meaningful sweep.
The sweep engine uses:
- swing pivot length,
- maximum sweep depth measured with ATR,
- rejection wick ratio,
- current candle structure,
- and the most recent mapped swing levels.
This base liquidity engine creates the foundation for all model combinations.
2) BSL / SSL LIQUIDITY MAP
The script can draw liquidity levels directly on the price chart.
The map may include:
- BSL above swing highs,
- SSL below swing lows,
- EQH when similar highs form near each other,
- EQL when similar lows form near each other.
The liquidity map is designed to be selective rather than excessive.
A quality mode controls how many levels are displayed:
- Balanced: more levels,
- Conservative: cleaner default view,
- Strict: fewer but more selective levels.
The script also limits the maximum number of active liquidity lines so the chart does not become overloaded.
3) SWEPT LIQUIDITY VISUAL STATE
When price reaches a mapped liquidity level, the script can mark that line as swept.
A swept liquidity line changes visually:
- the line becomes grey,
- the style changes,
- the label changes to SWEPT.
This makes it easier to distinguish active liquidity pools from liquidity that has already been taken.
This visual behavior is important because liquidity levels are not static forever. Once price has interacted with a level, its meaning may change.
4) EQUAL HIGH / EQUAL LOW LOGIC
The script can detect similar high or low points using an ATR-based tolerance.
Equal highs can represent a potential buy-side liquidity pool.
Equal lows can represent a potential sell-side liquidity pool.
Because instruments have different volatility, the tolerance is not fixed in raw price terms. It is scaled with ATR.
This makes the EQH / EQL logic more adaptive across different markets and timeframes.
🧠 16 MODEL SYSTEM
The script includes 16 model combinations.
These models are evaluated in the background:
1. LQ
2. LQ + Trend
3. LQ + FVG
4. LQ + Volume
5. LQ + RSI
6. LQ + Displacement
7. LQ + Trend + FVG
8. LQ + Trend + Volume
9. LQ + Trend + RSI
10. LQ + Trend + Displacement
11. LQ + FVG + Volume
12. LQ + FVG + RSI
13. LQ + FVG + Displacement
14. LQ + Volume + RSI
15. LQ + Trend + FVG + Volume
16. LQ + Trend + FVG + Volume + RSI + Displacement
The user can choose one active model from the settings.
The active model is the one that controls the visible chart signals.
The other models still run in the background for dashboard comparison.
This is one of the main ideas of the script: the user does not have to guess which confluence combination is currently performing better. The dashboard can compare the models over the visible historical calculation period.
📈 TREND COMPONENT
The trend component compares a fast EMA and a slow EMA.
If the fast EMA is above the slow EMA, the script treats the trend condition as bullish.
If the fast EMA is below the slow EMA, the script treats the trend condition as bearish.
This does not mean the EMA lines have to be plotted on the chart. They can work silently as internal filters.
When a model uses Trend, the liquidity signal must align with the EMA-based directional condition.
🟩 FVG COMPONENT
The FVG component checks for recent imbalance-style behavior.
The script identifies bullish and bearish FVG-style conditions and then checks whether such a condition has occurred within a recent lookback window.
This allows models such as:
- LQ + FVG,
- LQ + Trend + FVG,
- LQ + FVG + Volume,
- LQ + FVG + Displacement,
to require liquidity behavior together with recent imbalance context.
The FVG logic in this version is used as a filter and confluence component. It is not presented as a full FVG box-management system.
🔊 VOLUME COMPONENT
The volume component compares current volume against a volume moving average.
When current volume exceeds the selected volume average by the chosen multiplier, the script treats it as a volume expansion condition.
This can help models focus on sweeps that occur with stronger activity.
Volume is not used as proof of future direction. It is used as one additional context layer.
📉 RSI COMPONENT
The RSI component allows the script to include oscillator conditions in selected models.
For long models, RSI can be required to be near or below a selected lower threshold.
For short models, RSI can be required to be near or above a selected upper threshold.
This allows RSI to function as a contextual filter around liquidity events rather than as a standalone signal generator.
⚡ DISPLACEMENT COMPONENT
The displacement component checks whether the signal candle has enough body strength relative to ATR and total candle range.
A bullish displacement condition requires:
- bullish candle body,
- minimum body size relative to ATR,
- minimum body ratio inside the candle range.
A bearish displacement condition uses the opposite candle direction.
This helps identify signals where the sweep is followed by stronger directional candle behavior.
🧠 MARKET REGIME DETECTION
The script includes a market regime engine.
It classifies the current environment into states such as:
- Trend Up
- Trend Down
- Range
- Choppy
- High Vol
- Low Vol
- Neutral
The regime engine uses:
- directional movement logic,
- ADX-style trend strength,
- EMA trend direction,
- ATR compared to its average,
- candle body ratio behavior.
The purpose of this engine is to provide context.
A liquidity sweep in a trending market is not the same as a liquidity sweep in a range.
A signal during choppy conditions may require more caution than a signal during clean directional expansion.
The regime output is also used in the Signal Quality framework.
⭐ SIGNAL QUALITY SCORE
The Signal Quality score is a 0–100 style scoring framework.
The score is designed to summarize the most recent signal’s contextual quality.
It can consider:
- whether the signal is a valid liquidity event,
- whether the selected model’s trend condition is satisfied,
- whether the selected model’s FVG condition is satisfied,
- whether the selected model’s volume condition is satisfied,
- whether the selected model’s RSI condition is satisfied,
- whether the selected model’s displacement condition is satisfied,
- whether the market regime supports or conflicts with the signal direction.
The important detail is that the score is connected to the active model.
For example:
If the active model is LQ + FVG, FVG matters more directly.
If the active model is LQ + Volume, volume matters more directly.
If the active model is LQ + Trend + FVG + Volume, all of those conditions become part of the model-specific score.
This helps avoid a generic score that ignores the selected model’s logic.
📊 SIGNAL QUALITY PANEL
The Signal Quality panel displays a compact summary of the last signal.
It can show:
- current regime,
- market bias,
- last signal side,
- active model,
- signal score,
- mini score bar,
- alignment state.
The score bar is included to make the quality reading easier to review visually.
Example format:
Score: 78/100
Bar: ████████░░
This panel is not intended to guarantee that a signal will work. It simply summarizes how much contextual evidence was present when the signal appeared.
📊 MODEL DASHBOARD
The main dashboard compares the 16 models.
It includes:
- Trades
- WR
- PF
- Avg R
- Net R
- Active model row
- Best system row
The dashboard is meant for internal review.
It does not represent broker-executed trades. It is a virtual model-testing layer based on the script’s signal and TP/SL rules.
The dashboard helps the user compare whether one model is currently producing cleaner historical behavior than another, but it should not be interpreted as a guarantee that the same behavior will continue.
🏆 BEST SYSTEM ROW
The script can identify a Best System based on the selected metric.
The user can choose the best-system metric from:
- Net R
- Profit Factor
- Average R
- Win Rate
The system also uses a minimum trade count before a model can qualify for the Best row.
This is important because a model with only one or two trades can look misleading. The minimum trade threshold helps reduce the chance of highlighting a model with too little sample size.
🎛️ PRESET MODES
The script includes preset modes.
Available presets:
- Manual
- Scalping
- Intraday
- Swing
- Conservative
- Aggressive
- Funded Account Safe
The default preset is Intraday.
Preset modes do not simply change the name of the setting. They adjust internal effective values such as:
- TP / SL behavior,
- maximum bars in trade,
- sweep depth sensitivity,
- rejection requirement,
- FVG recency,
- volume multiplier,
- displacement requirements.
Manual mode allows the user to control the underlying settings directly.
Presets are included to make the script easier to adapt to different trading styles without requiring every setting to be adjusted one by one.
🎨 THEME SYSTEM
The script includes three visual themes:
Emerald Dark
A dark premium style using green and teal accents.
Crimson Pro
A more aggressive dark theme using red and high-contrast signal colors.
Ice Minimal
A cleaner light-style theme with black text and softer blue/grey visual structure.
The theme affects visual elements such as:
- dashboard colors,
- selected model row,
- best-system row,
- TP/SL/Entry line colors,
- TP/SL/Entry labels,
- reward and risk boxes.
The purpose is to make the same system usable across different chart backgrounds and visual preferences.
🎯 ACTIVE TRADE PROJECTION
When the active model produces a new signal, the script can project a visual trade framework.
The chart may display:
- Entry line
- TP1 line
- TP2 line
- TP3 line
- SL line
- reward zone
- risk zone
- price labels next to each level
The projected levels are based on risk multiples.
Default structure:
- TP1 = 1R
- TP2 = 2R
- TP3 = 3R
- SL = 1R risk
The user can adjust TP1, TP2, and TP3 R multiples from settings.
The projected structure is designed for review and visualization. It should not be treated as an instruction to enter a live trade without additional analysis and risk management.
🟢 TP / SL BACKTEST LOGIC
The script’s virtual testing engine is aligned with the TP1 / TP2 / TP3 structure.
If TP3 is reached, the virtual result is recorded using the selected TP3 R multiple.
If SL is reached, the result is recorded as -1R.
If the trade expires before TP3 or SL, the script can use the highest reached TP level or the open R result depending on what happened.
This creates a more consistent link between what appears visually on the chart and what the dashboard is evaluating.
Same-bar TP/SL behavior is handled by a conservative option. If both TP and SL appear to be hit during the same candle, the user can choose to count that situation conservatively.
🔁 NO CONSECUTIVE SAME-DIRECTION SIGNALS
The script includes a same-direction signal filter.
If a model produces a long signal, it will not keep printing long signals repeatedly until an opposite short signal occurs.
Likewise, if a model produces a short signal, it will not keep printing short signals repeatedly until an opposite long signal occurs.
This helps reduce repeated label clutter and makes the signal stream easier to review.
🚨 PRO ALERT SYSTEM
The script includes dynamic alert messages.
The alert message can include:
- signal side,
- active model,
- preset mode,
- quality score,
- market regime,
- alignment,
- entry price,
- TP1,
- TP2,
- TP3,
- SL,
- active model WR,
- active model PF,
- active model Avg R,
- active model Net R.
The script supports Text and JSON-style alert formats.
Important usage note:
To use the full dynamic Pro Alert message, create the TradingView alert with:
Condition: Liquidity Intelligence System
Option: Any alert() function call
The regular alertcondition messages are fallback static alerts.
🧭 WHAT APPEARS ON THE CHART
Depending on settings, the script may display:
- LONG / SHORT labels,
- BSL liquidity lines,
- SSL liquidity lines,
- EQH liquidity lines,
- EQL liquidity lines,
- SWEPT liquidity labels,
- Entry line,
- TP1 line,
- TP2 line,
- TP3 line,
- SL line,
- reward area box,
- risk area box,
- price labels beside Entry / TP / SL,
- main model dashboard,
- Signal Quality dashboard.
This design is intentional.
The chart shows liquidity structure, active model signals, projected risk/reward, and review statistics in one organized view.
🧪 HOW TO USE THE SCRIPT
A practical workflow:
1. Add the script to your chart.
2. Start with the default Intraday preset.
3. Choose a theme that fits your chart background.
4. Select the active model you want to display.
5. Review the liquidity map: BSL, SSL, EQH, and EQL.
6. Wait for a liquidity sweep signal from the active model.
7. Check the Signal Quality panel.
8. Check the market regime and alignment state.
9. Review the Entry / TP1 / TP2 / TP3 / SL projection.
10. Compare the active model to the other models in the dashboard.
11. Use alerts if you want to monitor signals automatically.
12. Validate settings across the specific instruments and timeframes you actually trade.
The script is best used as a structured review framework, not as a blind execution system.
⚙️ SETTINGS REFERENCE
Manual Model Selection
- Active Signal Model: selects which of the 16 models appears on the chart.
- Preset Mode: selects the effective behavior profile.
- Show Active Model Labels: enables/disables signal labels.
- Signal Label Style: controls how much information appears in signal labels.
- LONG / SHORT Label Size: controls signal label size.
Virtual Trade Test
- ATR Length: ATR basis for risk calculations.
- Virtual TP ATR Multiplier: used in manual/preset logic where applicable.
- Virtual SL ATR Multiplier: used to define risk distance.
- TP1 R Multiple: first target multiple.
- TP2 R Multiple: second target multiple.
- TP3 R Multiple: third target multiple.
- Max Bars In Virtual Trade: maximum duration of virtual trade.
- If TP and SL Hit Same Candle, Count As Loss: conservative same-bar handling.
Liquidity Sweep
- Swing Pivot Length: pivot sensitivity.
- Max Sweep Depth ATR: maximum allowed sweep depth.
- Minimum Rejection Wick Ratio: wick rejection requirement.
- Show BSL / SSL Liquidity Lines: enables liquidity map.
- Show Equal High / Equal Low Lines: enables EQH/EQL.
- Liquidity Line Limit: maximum active liquidity lines.
- Liquidity Map Quality: controls how selective the liquidity map is.
- Equal High / Low Tolerance ATR: ATR-scaled equality tolerance.
Confirmation Filters
- Fast EMA Length: trend filter fast EMA.
- Slow EMA Length: trend filter slow EMA.
- EMA Source: source used for EMA calculations.
- Minimum FVG Size ATR: minimum FVG size filter.
- FVG Recent Bars: how recently FVG must have appeared.
- Volume SMA Length: volume baseline.
- Volume Spike Multiplier: volume expansion threshold.
- RSI Length: RSI calculation length.
- RSI Long Threshold: RSI condition for long models.
- RSI Short Threshold: RSI condition for short models.
- Minimum Displacement Body ATR: minimum displacement body size.
- Minimum Displacement Body Ratio: minimum body-to-range ratio.
Market Regime & Quality
- Show Signal Quality Table: enables/disables quality panel.
- Regime ADX Length: directional movement calculation length.
- Trend ADX Threshold: trend-strength threshold.
- Range ADX Threshold: range-condition threshold.
- Regime ATR Average Length: ATR baseline for volatility regime.
- High Volatility ATR Multiplier: high-volatility threshold.
- Low Volatility ATR Multiplier: low-volatility threshold.
- Choppy Body Ratio Threshold: body-ratio condition for choppy regimes.
Dashboard & Visuals
- Show Model Dashboard: enables/disables model comparison dashboard.
- Theme: selects Emerald Dark, Crimson Pro, or Ice Minimal.
- Dashboard Size: controls dashboard text size.
- BEST System Metric: selects best-system ranking logic.
- Minimum Trades For BEST Row: minimum sample size for best-system qualification.
Pro Alerts
- Enable Pro Alert Message: enables dynamic alert messages.
- Alert Message Format: selects Text or JSON-style format.
🧠 WHAT MAKES THIS SCRIPT ORIGINAL
This script uses familiar components such as swing highs/lows, EMA trend filters, volume comparison, RSI thresholds, ATR, and dashboard statistics.
Those components are not original by themselves.
The originality of this script lies in how those components are organized into a single liquidity-intelligence workflow:
Liquidity map
→ sweep detection
→ 16 model comparison
→ market regime classification
→ model-specific quality scoring
→ TP1/TP2/TP3 projection
→ dashboard review
→ dynamic alert output
This structure allows the script to function as a complete liquidity review environment rather than a simple signal marker.
⚠️ IMPORTANT PRACTICAL NOTES
The script’s behavior depends heavily on settings.
Signal frequency and signal quality may change based on:
- selected active model,
- preset mode,
- pivot length,
- sweep depth,
- rejection requirement,
- FVG recency,
- volume threshold,
- RSI thresholds,
- displacement settings,
- volatility conditions,
- symbol,
- timeframe.
A model that looks cleaner on one instrument may not behave the same way on another.
The dashboard is a virtual review layer. It is useful for comparing model behavior, but it should not be treated as proof of future results.
⚠️ LIMITATIONS AND SHORTCOMINGS
This script has important limitations:
- It does not guarantee profitable signals.
- It does not know future price movement.
- It does not replace risk management.
- It does not execute trades.
- It does not include broker slippage, commissions, spreads, or order-fill uncertainty.
- It uses chart data and bar-based logic.
- Same-bar TP/SL ambiguity is handled by a rule, not by true intrabar reconstruction.
- Liquidity sweeps can fail.
- FVG, trend, volume, RSI, and displacement filters can still produce false signals.
- The dashboard is historical and virtual, not a live brokerage performance report.
- Market regime classification is an analytical approximation, not an absolute truth.
- No confluence model removes all risk or uncertainty.
For these reasons, the script should be used as a structured analysis and review tool, not as a standalone trading system.
👤 WHO THIS SCRIPT MAY BE USEFUL FOR
This script may be useful for traders who:
- study liquidity sweeps,
- use smart-money-style market structure concepts,
- want BSL / SSL / EQH / EQL mapping,
- want multiple confluence models in one tool,
- want a visual TP1 / TP2 / TP3 framework,
- want a signal quality panel,
- want market regime context,
- want model comparison statistics,
- prefer organized chart-based review.
It may be less suitable for users who:
- want a fully automated trading system,
- want guaranteed buy/sell signals,
- do not use liquidity concepts,
- do not want dashboard-based review,
- prefer very minimal charts with no overlays,
- expect one model to work the same way on every market and timeframe.
🛡️ DISCLAIMER
This script is provided for educational and informational purposes only.
It does not constitute financial, investment, or trading advice.
No indicator can guarantee future results. Market conditions change, historical behavior does not ensure future behavior, and every user is responsible for their own analysis, validation, position sizing, and risk management.
Use this script as a structured decision-support and review framework, not as a promise of profitability.
אינדיקטור

Nexus Global Initial Balance (IB)📝 Publication Description
Title: Nexus Global Initial Balance (IB) : Institutional Flow & Macro Confluence System
Overview
The Nexus Global Initial Balance (IB) is a sophisticated volatility-mapping engine designed for elite index and forex traders. It utilizes the Initial Balance (IB)—the critical first 60 minutes of the Tokyo, London, and New York sessions—to establish the "Structural DNA" of the trading day.
While most traders focus on simple breakouts, this indicator uncovers the hidden institutional "pivot zones" by overlapping session volatility with macro-structural Fibonacci context. It identifies where the "Big Money" is likely to defend positions and where trend expansions are mathematically projected to exhaust.
Key Institutional Features:
Triple-Session IB Architecture: Dynamic, color-coded 1-hour ranges for Tokyo (JST), London (GMT/BST), and New York (EST/EDT).
The Session Golden Zone: Automated shading of the 50% – 61.8% retracement area within each IB box, identifying the high-probability "Institutional Re-entry" zone.
Macro-to-Micro Confluence Engine: A master HTF source toggle that scans higher timeframes (15m to Daily) for structural Fibonacci levels and highlights them as "Institutional Pivots" when they intersect with your session range.
Trend-Based Expansion Projections: Algorithmic price targets based on Fibonacci extensions (0.618, 1.272, 1.618) to define precise take-profit areas.
Pro-Tier Visual Customization: Full control over line weights, styles (Dashed/Dotted/Solid), and session colors to maintain a clean, high-performance trading environment.
📈 The "Nexus Method": Professional Trading Rules
To trade this indicator successfully, follow these institutional protocols:
Rule 1: Establish the "Macro Bias"
The Check: Before the session opens, check the HTF 50% Level (the Daily or 4-hour midpoint).
The Rule: If the price is trading above the HTF 50%, look for Bullish IB breakouts. If below, look for Bearish IB breakdowns.
Rule 2: The "Golden Zone" Retest (Highest Probability)
Setup: Wait for the 1-hour IB range to form.
Action: If the price breaks out of the IBH (High), do not chase it. Wait for a pullback into the shaded Golden Zone (50-61.8%) within the box.
Confirmation: Look for an Institutional Pivot (Red line) sitting inside that Golden Zone.
Entry: Buy when price touches the confluence of the Golden Zone and the Institutional Pivot.
Stop Loss: 5 ticks below the IBL (Low).
Rule 3: The "Expansion Target" Protocol
Take Profit 1 (0.618 Ext): Move stop-loss to Breakeven. This is the "Safety Target."
Take Profit 2 (1.272 Ext): The institutional target for "Trend Days." Close 75% of the position here.
Take Profit 3 (1.618 Ext): The "Exhaustion Point." Close the remainder of the position.
Rule 4: The "Failed IB" (Mean Reversion)
The Setup: Price breaks the IBH but cannot reach the 0.618 extension and falls back into the box.
The Rule: This is a "Range Day." Target the opposite side of the box (IBL). This usually occurs when there is no confluence between the session range and the HTF levels.
Rule 5: Session Synergy
Always watch the Tokyo IB levels during the London open. If London opens inside the Tokyo Golden Zone, it often indicates a massive expansion move is coming as the two sessions' liquidity pools overlap. אינדיקטור

Big Order Candle DetectorBig Order Candle Detector (BOCD) – Explanation & Usage
The Big Order Candle Detector (BOCD) is an indicator designed to identify potential large institutional order activity in the market. It focuses on detecting strong price displacement, which may signal the early stage of a trend.
This structure allows the indicator to capture moments where price moves aggressively, often without overlap with previous price ranges. Such behavior can indicate the presence of strong buying or selling pressure.
How Big Order is Detected
A Bullish Big Order is identified when the current candle’s low is higher than the high of Candle A. This indicates a clear gap or displacement upward, suggesting strong buying interest.
A Bearish Big Order, on the other hand, occurs when the current candle’s high is lower than the low of Candle A, reflecting strong downward pressure.
To reduce noise, the script only marks the first Big Order signal when multiple signals appear consecutively. This ensures cleaner and more meaningful signals.
Visual Representation on Chart
The indicator provides several visual elements to assist analysis:
Triangle Signals
Green triangle → Bullish Big Order
Red triangle → Bearish Big Order
→ Represents early momentum or possible trend initiation
Highlighted Candle (Orange)
→ Considered the origin of the move or liquidity zone
Support & Resistance Box
Drawn based on the high and low of Candle A
→ Acts as a reaction zone for future price movement
Strategy & How to Use
This indicator is best used as a supporting tool for price action analysis, not as a standalone trading signal.
BUY Scenario (Bullish Setup)
When a bullish Big Order appears, it suggests that strong buying momentum has entered the market. Instead of entering immediately, traders typically wait for price to retrace.
Approach:
Wait for price to pull back into the support box, Look for confirmation signals before entering
Confirmation Examples:
Bullish candlestick pattern (e.g., engulfing, pin bar)
Minor break of structure
Increase in volume
Trade Plan:
Entry: Inside the support box (after confirmation)
Take Profit: Nearest resistance zone or previous high
Stop Loss: Below the support box
SELL Scenario (Bearish Setup)
In a bearish setup, the indicator signals strong selling pressure. Similar to the bullish case, traders wait for a retracement rather than chasing the move.
Approach:
Wait for price to move back into the resistance box, Look for signs of rejection
Confirmation Examples:
Bearish rejection candle
Formation of lower high
Weak bullish momentum
Trade Plan:
Entry: Inside the resistance box (after confirmation)
Take Profit: Nearest support zone
Stop Loss: Above the resistance box
Key Concept Summary
Big Order = Strong displacement (possible institutional activity)
Triangle = Signal of momentum
Orange Candle = Origin zone
Box = Key support/resistance area
Retracement = Entry opportunity
Confirmation = Risk control
Important Considerations
This indicator:
Does not guarantee winning trades
Should not be used alone
Always combine with:
Risk management
Market structure analysis
Additional confirmation tools
In practice, BOCD works best as:
A decision-support tool to identify high-probability zones, rather than a direct buy/sell system. אינדיקטור

Volume Displacement Engine [JOAT]Volume Displacement Engine
Introduction
Volume Displacement Engine (VDE) is an open-source volume regime oscillator that measures the ratio of short-term volume activity to long-term volume baseline, smooths it into a clean oscillator, and classifies current market activity into four distinct regimes: Low, Normal, High, and Extreme. The histogram and background tint update in real time with regime-specific coloring, reference lines mark each threshold boundary, and breakout signals fire when price closes beyond a rolling high or low during elevated volume regimes. A consolidation detection layer identifies consecutive low-volume bars as ranging periods. Trade outcomes from breakout signals are tracked for statistical win rate context, displayed in a structured dashboard.
The core problem VDE solves is the absence of context in standard volume indicators. Raw volume bars communicate size but not relevance — a large bar on a trending instrument in a high-liquidity session is very different from the same bar during off-hours. By expressing volume as a ratio to a rolling baseline and classifying it into regimes, VDE communicates whether current activity is institutionally significant (High or Extreme) or routine (Normal/Low). Price breakouts during High or Extreme volume are fundamentally different propositions than the same price moves on thin volume — VDE makes that distinction explicit and actionable.
Core Concepts
1. Volume Ratio Oscillator
The core calculation divides a short-term volume simple moving average by a long-term volume simple moving average, then applies an EMA smoothing pass to reduce bar-to-bar noise:
float rawRatio = volShort / math.max(volLong, 1.0)
float volRatio = ta.ema(rawRatio, i_smoothLen)
A ratio above 1.0 means recent volume is above the long-term average — activity is elevated. A ratio below 1.0 means recent volume is below the baseline — activity is depressed. The smoothing EMA gives the oscillator a cleaner shape while maintaining responsiveness to regime changes.
2. Four-Tier Regime Classification
Four threshold boundaries define the regime tiers. All thresholds are fully configurable:
Low: Ratio below the low threshold (default: 0.70) — below-average activity, reduced institutional participation
Normal: Ratio between low and normal ceiling (default: 0.70–1.20) — baseline activity
High: Ratio between normal ceiling and high threshold (default: 1.20–1.80) — elevated activity, potential institutional flow
Extreme: Ratio above the high threshold (default: 1.80+) — exceptional volume surge, likely significant price event
3. Breakout Signal Detection
Breakout signals are generated when price closes beyond the rolling highest high or lowest low of the configurable lookback window during a High or Extreme volume regime. This combines price displacement with volume confirmation, filtering out low-conviction breakouts that occur on thin volume:
bool bullBreak = barstate.isconfirmed and close > hh and (isHigh or isExtreme)
bool bearBreak = barstate.isconfirmed and close < ll and (isHigh or isExtreme)
4. Consolidation Detection
When multiple consecutive bars fall below the consolidation volume threshold, VDE identifies the period as a consolidation zone. The minimum bar count ensures short dips below the threshold are not misclassified as ranges. A dotted reference line marks consolidation periods in the oscillator pane, providing context for identifying compression before expansion moves.
5. Gradient Fill and Regime Tint
The oscillator histogram is colored to match the current regime. A fill between the histogram and the 1.0 baseline uses the regime color with transparency, providing a visual area representation of volume expansion or contraction. During High and Extreme regimes, a background tint activates in the oscillator pane to immediately draw attention to elevated activity periods without requiring inspection of the histogram height.
Features
Volume Ratio Oscillator: Short/long MA ratio smoothed by EMA — measures relative volume displacement from baseline
Four-Tier Regime Classification: Low, Normal, High, and Extreme regimes with independent color coding and configurable thresholds
Histogram Coloring: Bar color matches current regime — immediate visual reading of activity level
Regime Background Tint: High and Extreme volume periods highlighted with a pane background color for immediate attention
Threshold Reference Lines: Horizontal dashed lines at each regime boundary and at the 1.0 baseline for quick ratio reading
Gradient Regime Fill: Fill between oscillator and baseline communicates expansion/contraction area visually
Price Breakout Signals: Bull and bear breakout signals fire when price closes beyond rolling extremes during elevated volume regimes only
Consolidation Detection: Consecutive below-threshold volume bars identified as consolidation periods
Breakout Win Rate Tracking: Outcomes from breakout signals tracked against ATR-based TP/SL levels for statistical context
Non-Repainting: All signals gated on barstate.isconfirmed
Dashboard (Top Right): Current regime label, vol ratio value, consolidation status, and win rate breakdown for High and Extreme regime breakouts
Vol Momentum Columns: 3-bar rate-of-change of the vol ratio displayed as green/red column bars in the oscillator pane — shows whether volume activity is accelerating or decelerating relative to 3 bars prior
Rolling 20-Bar Vol Ratio Peak Reference Line: A purple reference line tracks the rolling 20-bar peak vol ratio — provides a visual ceiling for recent activity levels and highlights when the current ratio is approaching or exceeding recent extremes
Vol Ratio Delta in Dashboard: Vol ratio delta shown in real time in the dashboard with a directional arrow (▲/▼) — communicates whether volume pressure is building or fading on the current bar
CONS Label on Consolidation Start: A "CONS" label fires at the bar when a consolidation zone begins — marks the exact start of identified compression periods directly on the oscillator
Breakout Strength Labels: "BRK +X.XX" and "BRK -X.XX" labels appear at each breakout signal showing the vol ratio value at the moment of the break — communicates the institutional conviction level behind each breakout directly on the chart
Input Parameters
Volume Engine:
Short Vol Window: Short-term volume MA period (default: 10)
Long Vol Window: Long-term volume MA period (default: 40)
Ratio Smooth: EMA smoothing length for ratio (default: 3)
Low Vol Threshold: Ratio below which regime is Low (default: 0.70)
Normal Vol Ceiling: Ratio above which regime is High (default: 1.20)
High Vol Threshold: Ratio above which regime is Extreme (default: 1.80)
Consolidation:
Consolidation Window: Lookback window for consolidation range (default: 8)
Consolidation Vol Max: Maximum ratio to qualify as a consolidation bar (default: 0.80)
Min Consolidation Bars: Minimum consecutive qualifying bars to declare consolidation (default: 4)
Breakout Signal:
Breakout Lookback: Rolling high/low lookback window (default: 20)
ATR Length: Period for ATR calculation (default: 14)
ATR SL Multiplier: Stop loss distance (default: 1.5)
Reward:Risk Ratio: TP multiple (default: 3.0)
Show TP/SL Labels: Toggle label display in the oscillator pane (default: enabled)
How to Use This Indicator
Step 1: Read the Regime
Glance at the dashboard regime label and histogram color. A grey histogram (Low) indicates the market is in a quiet, low-participation period — avoid breakout strategies during these windows. A teal histogram (Normal) is baseline. An amber histogram (High) or red (Extreme) signals institutional-grade activity.
Step 2: Identify Consolidation Periods
When the dotted consolidation line is active in the oscillator pane, the market is in a low-volume compression phase. These periods typically precede expansion moves — the direction of the subsequent breakout, confirmed on volume, is a key signal.
Step 3: React to Breakout Signals
Breakout signals (triangles at the top/bottom of the oscillator pane) only fire during High or Extreme regimes. When a bull breakout label appears, price has closed above the rolling high on elevated volume — a confirmed displacement. The ATR TP/SL levels from that bar define the immediate risk/reward.
Step 4: Monitor the Ratio Trend
The oscillator line trending upward while above 1.0 indicates sustained institutional accumulation of activity — these sustained elevated periods often coincide with trending phases. A declining ratio from Extreme back toward Normal often signals activity exhaustion.
Indicator Limitations
Volume data quality varies significantly by instrument and data provider. On synthetic instruments, indices, or assets where volume reflects contract count rather than notional size, the ratio will not accurately represent true monetary volume displacement
TP/SL outcome tracking in the oscillator pane uses price data for TP/SL hit detection but displays in the volume pane — the label positions are approximate visual markers, not precise price levels on the main chart
The consolidation detector uses a fixed volume threshold. In trending markets where baseline volume rises over time, the historical consolidation threshold may not match current market conditions without recalibrating the threshold input
Breakout signals require both a price breakout and an elevated volume regime simultaneously. In markets with persistently high volume baselines (e.g., during major economic event periods), the Extreme threshold may trigger more frequently than on typical days — the thresholds may need upward adjustment on those instruments
The short/long MA window ratio is a relative measure. It compares recent volume to a historical baseline — it does not measure absolute volume in shares, contracts, or dollars
Originality Statement
VDE combines a smoothed relative volume ratio oscillator with a four-tier classification framework, consolidation detection, and volume-gated breakout signals in a unified indicator. This is original for the following reasons:
Expressing volume as a ratio of short-term to long-term moving average — rather than showing raw volume bars — normalizes the oscillator across instruments and timeframes, making the same threshold values meaningful on a liquid equity, a commodity, and a cryptocurrency without manual recalibration
The four-tier classification system with independently configurable thresholds and a gradient color scheme provides a richer regime reading than simple volume-above-average/below-average binary indicators
Volume-gated breakout detection explicitly requires the price breakout and the volume regime elevation to occur simultaneously on the same confirmed bar — preventing breakout signals from firing on thin-volume price moves that carry low institutional conviction
The consolidation detection layer adds a compression-identification capability within the volume pane, providing context for identifying low-activity ranging periods before the volume regime shifts to support a directional move
Disclaimer
This indicator is provided for educational and informational purposes only. It is not financial advice or a recommendation to buy or sell any financial instrument. Trading involves substantial risk of loss. Volume regime classification and breakout signals are statistical constructs — elevated volume at a price breakout does not guarantee continuation in the breakout direction. Win rate statistics are derived from historical bar data and do not predict future performance. Always apply proper risk management. The author is not responsible for any trading losses resulting from the use of this indicator.
-Made with passion by jackofalltrades
אינדיקטור

Compression Vector [JOAT]Compression Vector
Overview
Compression Vector is a dual-engine volatility compression detector built in Pine Script v6. It identifies moments when both Bollinger Band width and Average True Range simultaneously contract relative to their historical baselines — a confluence that institutional traders recognise as the calm before an explosive directional move. When the squeeze releases, the indicator fires scored breakout signals with adaptive ATR-based take-profit levels and stop-loss placement directly on the chart.
Why This Approach?
Most squeeze indicators rely on a single compression measure, such as BB width relative to Keltner Channel, which can produce false signals in low-volume sideways drift. Compression Vector cross-validates two independent compression engines:
- Engine 1 — ATR Historical Ratio: Compares the 14-bar ATR against a slow ATR of configurable length (default 50). If the ratio falls below the compression threshold, the first engine fires.
- Engine 2 — BB + ATR SMA Squeeze: Compares current BB width against its own SMA (so the band must narrow relative to its own recent average), AND compares the current ATR against its short-term SMA. Only when at least one of these secondary tests also confirms does a dual-engine squeeze register.
Both engines must agree before a zone is created. This eliminates the noise inherent in single-measure detectors.
Compression Zones — 3-Layer Institutional Box System
Each confirmed squeeze prints a three-layer box structure that visually encodes squeeze intensity through colour:
- Halo layer (outer): Wide, nearly transparent — marks the full expansion of the compressed range plus padding
- Body layer (mid): The actual high-to-low range of all bars inside the squeeze
- Core layer (inner): A tighter 40% interior slice highlighting the median energy pocket
The box colour progresses through a time-weighted palette: grey (< 5 bars), purple (5–9), teal (10–19), gold (20+). Longer squeezes accumulate more potential energy and are weighted accordingly in the signal score.
Breakout Signal Scoring (0–100)
When close breaks convincingly above or below a zone, the indicator computes a composite score before stamping the signal:
- Proximity score (up to 35) — volume vs. its 20-bar SMA
- Squeeze score (up to 35) — duration of the squeeze in bars × 2.5
- RSI score (up to 15) — directional RSI headroom (long: RSI below 62, short: RSI above 38)
- Impulse score (up to 15) — breakout candle body relative to ATR
Grade letter (A+, A, B, C, D) is stamped on the signal label. Only breakouts where the candle body exceeds a configurable ATR multiple ("Min Impulse Body") qualify.
Adaptive TP / SL Lines
Risk is calculated as the distance from entry to the opposite zone boundary plus an ATR buffer. Three take-profit levels at configurable R:R multiples (default 1.5R, 2.5R, 4.0R) are drawn as dotted lines extending forward 45 bars. The stop-loss line is drawn in the opposing colour at the calculated risk distance below/above entry.
Dashboard (Bottom Centre)
A compact 8-column table displays in real time:
- Squeeze state (COMPRESSING / RELAXED) with bar count
- ASCII compression gauge (6 segments)
- ATR ratio and BB width percentage
- RSI, volume multiplier, last zone score with grade
- Active zone count and warm-up status
Inputs Reference
Squeeze Engine
- ATR Historical Length (50) — lookback for the slow ATR baseline
- ATR Compression Threshold (0.72) — ratio below which ATR engine triggers
- Bollinger Band Length (20) — period for BB and BB-width SMA
- BB Std Dev Multiplier (2.0) — standard deviation width of the Bollinger Bands
- BB Width Squeeze Ratio (0.82) — fraction of BB-width SMA below which BB engine triggers
- ATR SMA Squeeze Ratio (0.90) — fraction of ATR SMA below which ATR secondary engine triggers
- Min Bars Required in Squeeze (3) — minimum consecutive bars before a zone is registered
Signal Filters
- Require Volume Above SMA — gates breakouts to above-average volume bars
- Volume SMA Length (20) — reference volume baseline
- Block Overbought/Oversold — RSI filter at 72 long / 28 short
- RSI Length (14)
- Min Impulse Body (1.3 ATR) — minimum breakout candle body in ATR units
- Max Zones Tracked (6)
Risk & Targets
- SL Buffer (0.3 ATR) — added to raw risk for stop placement
- TP1 / TP2 / TP3 R:R — take-profit multiples (1.5 / 2.5 / 4.0)
Visual Settings
- Show Compression Zones / Show TP-SL Lines / Show Dashboard
- Theme: Dark, Light, or Auto (detects chart background)
How to Use
1. Add the indicator on any liquid market and timeframe. A warmup of roughly 100 bars is required before signals appear.
2. Watch for the dashboard state to read COMPRESSING and the gauge to fill. The longer the squeeze, the higher the potential score on breakout.
3. Wait for a labelled signal (BREAK+ for long, BREAK- for short). Prefer grade A or A+.
4. Use the drawn TP lines for partial exits and the SL line for stop placement.
5. Higher timeframes (15m, 1H, 4H) tend to produce cleaner zones with fewer false breaks.
Non-Repainting Design
All signals are gated by barstate.isconfirmed, meaning they only fire on the final tick of a closed bar. Zones are computed from confirmed historical bars only. The indicator will never repaint a past signal.
Limitations
- In extremely choppy, low-volume markets, short squeezes (2–3 bars) may resolve without meaningful breakout momentum. Raise Min Bars to filter these.
- The composite score is calibrated for liquid instruments. Illiquid or exotic pairs may require adjustment of the volume multiplier filter.
- ATR-based TP/SL levels are approximate and should not replace proper position sizing.
- No future-bar lookahead is used in any request.security() call.
Disclaimer
This indicator is provided for educational and informational purposes only. Past performance of any signal pattern is not indicative of future results. Always use proper risk management and conduct your own analysis before making any trading decisions.
Made with passion by officialjackofalltrades
אינדיקטור