ADX for BTC [PineIndicators]The ADX Strategy for BTC is a trend-following system that uses the Average Directional Index (ADX) to determine market strength and momentum shifts. Designed for Bitcoin trading, this strategy applies a customizable ADX threshold to confirm trend signals and optionally filters entries using a Simple Moving Average (SMA). The system features automated entry and exit conditions, dynamic trade visualization, and built-in trade tracking for historical performance analysis.
⚙️ Core Strategy Components
1️⃣ Average Directional Index (ADX) Calculation
The ADX indicator measures trend strength without indicating direction. It is derived from the Positive Directional Movement (+DI) and Negative Directional Movement (-DI):
+DI (Positive Directional Index): Measures upward price movement.
-DI (Negative Directional Index): Measures downward price movement.
ADX Value: Higher values indicate stronger trends, regardless of direction.
This strategy uses a default ADX length of 14 to smooth out short-term fluctuations while detecting sustainable trends.
2️⃣ SMA Filter (Optional Trend Confirmation)
The strategy includes a 200-period SMA filter to validate trend direction before entering trades. If enabled:
✅ Long Entry is only allowed when price is above a long-term SMA multiplier (5x the standard SMA length).
✅ If disabled, the strategy only considers the ADX crossover threshold for trade entries.
This filter helps reduce entries in sideways or weak-trend conditions, improving signal reliability.
📌 Trade Logic & Conditions
🔹 Long Entry Conditions
A buy signal is triggered when:
✅ ADX crosses above the threshold (default = 14), indicating a strengthening trend.
✅ (If SMA filter is enabled) Price is above the long-term SMA multiplier.
🔻 Exit Conditions
A position is closed when:
✅ ADX crosses below the stop threshold (default = 45), signaling trend weakening.
By adjusting the entry and exit ADX levels, traders can fine-tune sensitivity to trend changes.
📏 Trade Visualization & Tracking
Trade Markers
"Buy" label (▲) appears when a long position is opened.
"Close" label (▼) appears when a position is exited.
Trade History Boxes
Green if a trade is profitable.
Red if a trade closes at a loss.
Trend Tracking Lines
Horizontal lines mark entry and exit prices.
A filled trade box visually represents trade duration and profitability.
These elements provide clear visual insights into trade execution and performance.
⚡ How to Use This Strategy
1️⃣ Apply the script to a BTC chart in TradingView.
2️⃣ Adjust ADX entry/exit levels based on trend sensitivity.
3️⃣ Enable or disable the SMA filter for trend confirmation.
4️⃣ Backtest performance to analyze historical trade execution.
5️⃣ Monitor trade markers and history boxes for real-time trend insights.
This strategy is designed for trend traders looking to capture high-momentum market conditions while filtering out weak trends.
BTCUSD

Swing High/Low Pivots Strategy [LV]The Swing High/Low Pivots Strategy was developed as a counter-momentum trading tool.
The strategy is suitable for any market and the default values used in the input settings menu are set for Bitcoin (best on 15min). These values, expressed in minimum ticks (or pips if symbol is Forex) make this tool perfectly adaptable to every symbol and/or timeframe.
Check tooltips in the settings menu for more details about every user input.
STRTEGY ENTRY & EXIT MECHANISMS:
Trades Entry based on the detection of swing highs and lows for short and long entries respectively, validated by:
- Limit orders placed after each new pivot level confirmation
- Moving averages trend filter (if enabled)
- No active trade currently open
Trades Exit when the price reaches take-profit or stop-loss level as defined in the settings menu. A double entry/second take-profit level can be enabled for partial exits, with dynamic stop-loss adjustment for the remaining position.
Enhanced Trade Precision:
By limiting entries to confirmed swing high (HH, LH) or swing low (HL, LL) pivot points, the strategy ensures that trades occur at levels of significant price reversals. This precision reduces the likelihood of entering trades in the midst of a trend or during uncertain price action.
Risk Management Optimization:
The strategy incorporates clearly defined stop-loss (SL) and take-profit (TP) levels derived from the pivot points. This structured approach minimizes potential losses while locking in profits, which is critical for consistent performance in volatile markets.
Trend Filtering for Better Entry:
The use of a configurable moving average filter adds a layer of trend validation. This prevents entering trades against the dominant market trend, increasing the probability of success for each trade.
Avoidance of Noise:
The lookback period (length parameter) confirms pivots only after a set number of bars, effectively filtering out market noise and ensuring that entries are based on reliable, well-defined price movements.
Adaptability Across Markets:
The strategy is versatile and can be applied across different markets (Forex, stocks, crypto) due to its dynamic use of ticks and pips converters. It adapts seamlessly to varying price scales and asset types.
Dual Quantity Entries:
The original and optionnal double-entry mechanism allows traders to capture both short-term and extended profits by scaling out of positions. This adaptive approach caters to varying risk appetites and market conditions.
Clear Visualization:
The plotted pivot points, entry limits, SL, and TP levels provide visual clarity, making it easy for traders to track the strategy's behavior and make informed decisions.
Automated Execution with Alerts:
Integrated alerts for both entries and exits ensure timely actions without the need for constant market monitoring, enhancing efficiency. Configurable alert messages are suitable for API use.
Any feedback, comments, or suggestions for improvement are always welcome.
Hope you enjoy!

Cabal Dev IndicatorThis is a TradingView Pine Script (version 6) that creates a technical analysis indicator called the "Cabal Dev Indicator." Here's what it does:
1. Core Functionality:
- It calculates a modified version of the Stochastic Momentum Index (SMI), which is a momentum indicator that shows where the current close is relative to the high/low range over a period
- The indicator combines elements of stochastic oscillator calculations with exponential moving averages (EMA)
2. Key Components:
- Uses configurable input parameters for:
- Percent K Length (default 15)
- Percent D Length (default 3)
- EMA Signal Length (default 15)
- Smoothing Period (default 5)
- Overbought level (default 40)
- Oversold level (default -40)
3. Calculation Method:
- Calculates the highest high and lowest low over the specified period
- Finds the difference between current close and the midpoint of the high-low range
- Applies EMA smoothing to both the range and relative differences
- Generates an SMI value and further smooths it using a simple moving average (SMA)
- Creates an EMA signal line based on the smoothed SMI
4. Visual Output:
- Plots the smoothed SMI line in green
- Plots an EMA signal line in red
- Shows overbought and oversold levels as gray horizontal lines
- Fills the areas above the overbought level with light red
- Fills the areas below the oversold level with light green
This indicator appears designed to help traders identify potential overbought and oversold conditions in the market, as well as momentum shifts, which could be used for trading decisions.
Would you like me to explain any specific part of the indicator in more detail?

Adapted RSI w/ Multi-Asset Regime Detection v1.1The relative strength index (RSI) is a momentum indicator used in technical analysis. RSI measures the speed and magnitude of an asset's recent price changes to detect overbought or oversold conditions in the price of said asset.
In addition to identifying overbought and oversold assets, the RSI can also indicate whether your desired asset may be primed for a trend reversal or a corrective pullback in price. It can signal when to buy and sell.
The RSI will oscillate between 0 and 100. Traditionally, an RSI reading of 70 or above indicates an overbought condition. A reading of 30 or below indicates an oversold condition.
The RSI is one of the most popular technical indicators. I intend to offer a fresh spin.
Adapted RSI w/ Multi-Asset Regime Detection
Our Adapted RSI makes necessary improvements to the original Relative Strength Index (RSI) by combining multi-timeframe analysis with multi-asset monitoring and providing traders with an efficient way to analyse market-wide conditions across different timeframes and assets simultaneously. The indicator automatically detects market regimes and generates clear signals based on RSI levels, presenting this data in an organised, easy-to-read format through two dynamic tables. Simplicity is key, and having access to more RSI data at any given time, allows traders to prepare more effectively, especially when trading markets that "move" together.
How we calculate the RSI
First, the RSI identifies price changes between periods, calculating gains and losses from one look-back period to the next. This look-back period averages gains and losses over 14 periods, which in this case would be 14 days, and those gains/losses are calculated based on the daily closing price. For example:
Average Gain = Sum of Gains over the past 14 days / 14
Average Loss = Sum of Losses over the past 14 days / 14
Then we calculate the Relative Strength (RS):
RS = Average Gain / Average Loss
Finally, this is converted to the RSI value:
RSI = 100 - (100 / (1 + RS))
Key Features
Our multi-timeframe RSI indicator enhances traditional technical analysis by offering synchronised Daily, Weekly, and Monthly RSI readings with automatic regime detection. The multi-asset monitoring system allows tracking of up to 10 different assets simultaneously, with pre-configured major pairs that can be customised to any asset selection. The signal generation system provides clear market guidance through automatic regime detection and a five-level signal system, all presented through a sophisticated visual interface with dynamic RSI line colouring and customisable display options.
Quick Guide to Use it
Begin by adding the indicator to your chart and configuring your preferred assets in the "Asset Comparison" settings.
Position the two information tables according to your preference.
The main table displays RSI analysis across three timeframes for your current asset, while the asset table shows a comparative analysis of all monitored assets.
Signals are colour-coded for instant recognition, with green indicating bullish conditions and red for bearish conditions. Pay special attention to regime changes and signal transitions, using multi-timeframe confluence to identify stronger signals.
How it Works (Regime Detection & Signals)
When we say 'Regime', a regime is determined by a persistent trend or in this case momentum and by leveraging this for RSI, which is a momentum oscillator, our indicator employs a relatively simple regime detection system that classifies market conditions as either Bullish (RSI > 50) or Bearish (RSI < 50). Our benchmark between a trending bullish or bearish market is equal to 50. By leveraging a simple classification system helps determine the probability of trend continuation and the weight given to various signals. Whilst we could determine a Neutral regime for consolidating markets, we have employed a 'neutral' signal generation which will be further discussed below...
Signal generation occurs across five distinct levels:
Strong Buy (RSI < 15)
Buy (RSI < 30)
Neutral (RSI 30-70)
Sell (RSI > 70)
Strong Sell (RSI > 85)
Each level represents different market conditions and probability scenarios. For instance, extreme readings (Strong Buy/Sell) indicate the highest probability of mean reversion, while neutral readings suggest equilibrium conditions where traders should focus on the overall regime bias (Bullish/Bearish momentum).
This approach offers traders a new and fresh spin on a popular and well-known tool in technical analysis, allowing traders to make better and more informed decisions from the well presented information across multiple assets and timeframes. Experienced and beginner traders alike, I hope you enjoy this adaptation.

Simple Moving Average with Regime Detection by iGrey.TradingThis indicator helps traders identify market regimes using the powerful combination of 50 and 200 SMAs. It provides clear visual signals and detailed metrics for trend-following strategies.
Key Features:
- Dual SMA System (50/200) for regime identification
- Colour-coded candles for easy trend visualisation
- Metrics dashboard
Core Signals:
- Bullish Regime: Price < 200 SMA
- Bearish Regime: Price > 200 SMA
- Additional confirmation: 50 SMA Cross-over or Cross-under (golden cross or death cross)
Metrics Dashboard:
- Current Regime Status (Bull/Bear)
- SMA Distance (% from price to 50 SMA)
- Regime Distance (% from price to 200 SMA)
- Regime Duration (bars in current regime)
Usage Instructions:
1. Apply the indicator to your chart
2. Configure the SMA lengths if desired (default: 50/200)
3. Monitor the color-coded candles:
- Green: Bullish regime
- Red: Bearish regime
4. Use the metrics dashboard for detailed analysis
Settings Guide:
- Length: Short-term SMA period (default: 50)
- Source: Price calculation source (default: close)
- Regime Filter Length: Long-term SMA period (default: 200)
- Regime Filter Source: Price source for regime calculation (default: close)
Trading Tips:
- Use bullish regimes for long positions
- Use bearish regimes for capital preservation or short positions
- Consider regime duration for trend strength
- Monitor distance metrics for potential reversals
- Combine with other systems for confluence
#trend-following #moving average #regime #sma #momentum
Risk Management:
- Not a standalone trading system
- Should be used with proper position sizing
- Consider market conditions and volatility
- Always use stop losses
Best Practices:
- Monitor multiple timeframes
- Use with other confirmation tools
- Consider fundamental factors
Version: 1.0
Created by: iGREY.Trading
Release Notes
// v1.1 Allows table overlay customisation
// v1.2 Update to v6 pinescript

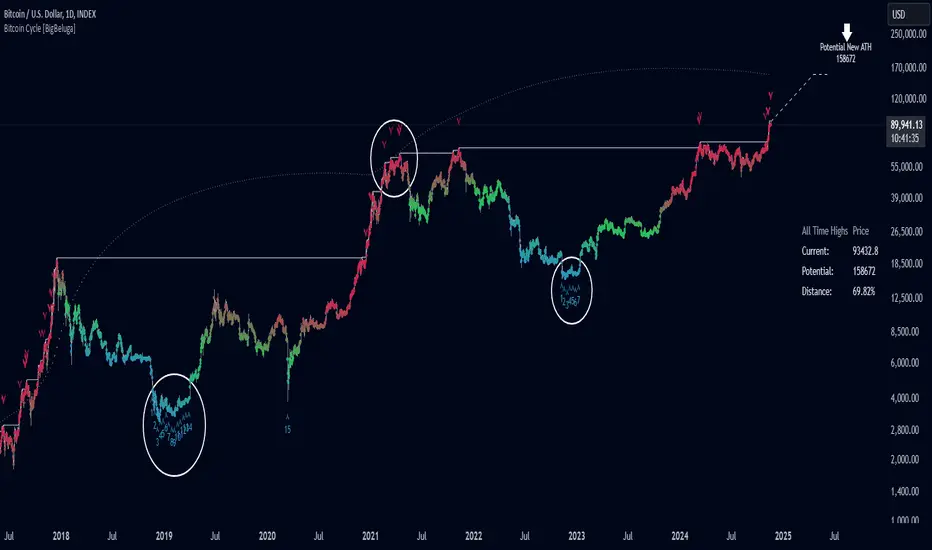
Bitcoin Cycle [BigBeluga]Bitcoin Cycle Indicator is designed exclusively for analyzing Bitcoin’s long-term market cycles, working only on the 1D BTC chart . This indicator provides an in-depth view of potential cycle tops and bottoms, assisting traders in identifying key phases in Bitcoin’s market evolution.
🔵 Key Features:
Heatmap Cycle Phases: The indicator colors each cycle from blue to red , reflecting Bitcoin’s market cycle progression. Cooler colors (blue/green) signal potential accumulation or early growth phases, while warmer colors (yellow/red) indicate maturation and potential top regions.
All-Time High (ATH) and Future ATH Projection: Tracks the current ATH in real-time, while applying a linear regression model to project a possible new ATH in the future. This projection aims to provide insights into the next major cycle peak for long-term strategy.
Dashboard Overview: Displays the current ATH, potential new ATH, and the percentage distance between them. This helps users assess how far the current price is from the projected target.
Top & Bottom Cycle Signals: Red down arrows mark significant price peaks, potentially indicating cycle tops. Up arrows, numbered sequentially (inside each cycle), denote possible bottom signals for strategic DCA (Dollar Cost Averaging) entries.
1D BTC Chart Only: Built solely for the 1D BTC timeframe. Switching to any other timeframe or asset will trigger a warning message: " BTC 1D Only ." This ensures accuracy in analyzing Bitcoin’s unique cyclical behavior.
🔵 When to Use:
Ideal for long-term Bitcoin investors and cycle analysts, the Bitcoin Cycle Indicator empowers users to:
Identify key accumulation and distribution phases.
Track Bitcoin’s cyclical highs and lows with visual heatmap cues.
Estimate future potential highs based on historical patterns.
Strategize long-term positions by monitoring cycle tops and possible accumulation zones.
By visualizing Bitcoin’s cycles with color-coded clarity and top/bottom markers, this indicator is an essential tool for any BTC analyst aiming to navigate market cycles effectively.
Sharpe Ratio Z-ScoreThe "Sharpe Ratio Z-Score" indicator is a powerful tool designed to measure risk-adjusted returns in financial assets. This script helps investors evaluate the performance of a security relative to its risk, using a Z-score based modification of the Sharpe Ratio. The indicator is suitable for assessing market environments and understanding periods of underperformance or overperformance relative to historical standards.
Features:
Risk Assessment and Scaling: The indicator calculates a modified version of the Sharpe Ratio
over a user-defined period. By using scaling and mean offset adjustments, it allows for better
fitting to different market conditions.
Customizable Settings:
Period Length: The number of bars used to calculate the Sharpe Ratio.
Mean Adjustment: Offset value to adjust the average return of the calculated Sharpe ratio.
Scale Factor: A multiplier for emphasizing or reducing the calculated score's impact.
Line Color: Easily customize the plot's appearance.
Visual Cues:
Plots horizontal lines and fills specific regions to visually represent significant Z-score levels.
Highlighted zones include risk thresholds, such as overbought (positive Z-scores) and oversold
(negative Z-scores) areas, using intuitive color fills:
Green for areas below -0.5 (potential buy opportunities).
Red for areas above 0.5 (potential sell opportunities).
Yellow for neutral zones between -0.5 and 0.5.
Use Cases:
Risk-Adjusted Decision Making: Understand when returns are favorable compared to risk, especially during volatile market conditions.
Timing Reversion to Mean: Use highlighted zones to identify potential reversion-to-mean scenarios.
Trend Analysis: Identify times when an asset's performance is significantly deviating from its
average risk-adjusted return.
How It Works:
The script computes the daily returns over a set period, calculates the standard deviation of
those returns, and then applies a modified Sharpe Ratio approach. The Z-score transformation
helps to visualize how far an asset's risk-adjusted return deviates from its historical average.
This "Sharpe Ratio Z-Score" indicator is well-suited for investors seeking to combine quantitative metrics with visual cues, enhancing decision-making for long and short positions while maintaining a risk-adjusted perspective.
Multi-Timeframe RangeThe Multi-Timeframe Range Indicator is designed for traders looking to monitor key price levels across various timeframes (Daily, Weekly, Monthly, Quarterly, and Yearly) directly on their charts. This indicator draws boxes and mid-lines for each timeframe’s high, low, and midpoint, enabling users to visualize price ranges and assess potential areas of support and resistance more effectively.
Features:
Dynamic Range Boxes: Displays the high, low, and midpoint levels for each specified timeframe, with customizable colors for easy differentiation.
Visual Cues for Monday’s Levels: Highlights Monday’s high, low, and midpoint levels each week to support intraday trading setups and weekly trend analysis.
Multi-Timeframe Flexibility: Easily toggle between timeframes to view ranges from daily to yearly, making this indicator suitable for both short-term and long-term traders.
Ideal Use Cases:
Identify key support and resistance zones based on multiple timeframes.
Assess weekly and monthly trends using the Monday range levels.
Gain insights into market structure across various timeframes.

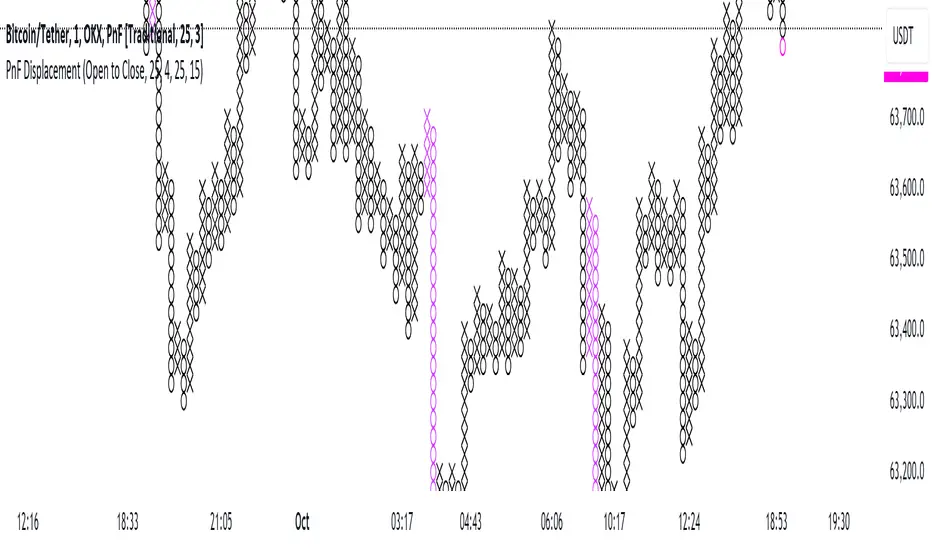
Point and Figure Displacement IndicatorThe PnF Displacement indicator is my custom script for TradingView, designed to analyze Point and Figure (PnF) charts with displacement features.
Key components of the script include:
User Inputs:
Require FVG: A boolean input to determine if a Fair Value Gap (FVG) is required for displacement calculations.
Displacement Type: Allows users to choose between "Open to Close" and "High to Low" for column range calculations.
Displacement Length: Defines how far back to look for calculating the standard deviation of the column range.
Displacement Strength: Multiplier for the standard deviation to adjust sensitivity.
Box Size: Sets the size of each box in the PnF chart.
Number of Boxes for Minimum Displacement: Specifies how many boxes to consider for calculating the minimum displacement.
Displacement Logic:
The script calculates the column range based on the selected displacement type.
It computes a standard deviation of the candle range and determines a minimum displacement based on user-defined box size and count.
The displacement condition combines the FVG check and the column range against the calculated minimum.
Visual Representation:
The bars are colored based on displacement conditions, enhancing visual analysis on the chart.
This indicator aids traders in identifying significant price movements in PnF charts while incorporating user customization options for better analysis.
Leonid's Bitcoin Sharpe RatioThe Sharpe ratio is an old formula used to value the risk-adjusted return of an asset. It was developed by Nobel Laureate William F. Sharpe. In this case, I have applied it to Bitcoin with an adjustable look-back date.
The Sharpe Ratio shows you the average return earned after subtracting out the risk-free rate per unit of volatility (I've defaulted this to 0.02 ).
Volatility is a measure of the price fluctuations of an asset or portfolio. Subtracting the risk-free rate from the mean return allows you to understand what the extra returns are for taking the risk.
If the indicator is flashing red, Bitcoin is temporarily overbought (expensive).
If the indicator is flashing green, Bitcoin is temporarily oversold (cheap).
The goal of this indicator is to signal out local tops & bottoms. It can be adjusted as far as the lookback time but I have found 25-26 days to be ideal.

Sniper Entry Indicator, Crypto, Forex, Indices, I ndicator Description:
Momentum & Sideways Market Detector is a powerful TradingView indicator that combines the strengths of RSI (Relative Strength Index) and Moving Averages to identify market momentum and detect sideways movements. This versatile tool is designed to work effectively across various asset classes, including Cryptocurrencies, Forex pairs, Gold, and major stock indices like Nifty, BankNifty, Finifty, and Midcap.
Key Features:
Momentum Detection: The indicator uses RSI to gauge market momentum, highlighting overbought and oversold conditions to signal potential reversals by Displaying strength on the chart, above 90 it will be overbought and check for reversal trade, below 10 it will be oversold and check for the long opportunity.
Sideways Market Identification: It utilizes a combination of Moving Averages to detect low-volatility periods and sideways market conditions, helping traders avoid choppy markets. Area or label highlighted by blue means it is sideways, you can ignore entries in this zone.
Multi-Asset Compatibility: The indicator is optimized to perform well on diverse asset classes, including Crypto, Forex, Commodities, and Equity Indices, making it a versatile tool for traders of all types. It is compatible with Indian indices as well giving trader opportunity to see live trade with strike price entry and sl. It also trails the SL when reached the first target.
Customizable Parameters: Users can adjust RSI and Moving Average settings to suit their trading style and timeframe preferences.
Settings:
Stock/Option (Whether you want to trade Sport or it's option, if unchecked it will look for expiry of the stock option, month, and year, user also needs to provide the call and put option)
Spot Symbol (I have provided some of the spot symbols for the selection which will help him to configure it's F&O )
Backtest Day (User can backtest the data by changing the day to previous lookback, it is a very good feature to test the results.)
Remove lines from the table (If table is too long, i have provided the option to remove some of the lines from the table, provide number to remove the lines)
This indicator is a must-have for traders looking to enhance their strategy by accurately identifying market conditions and adapting their trades accordingly.

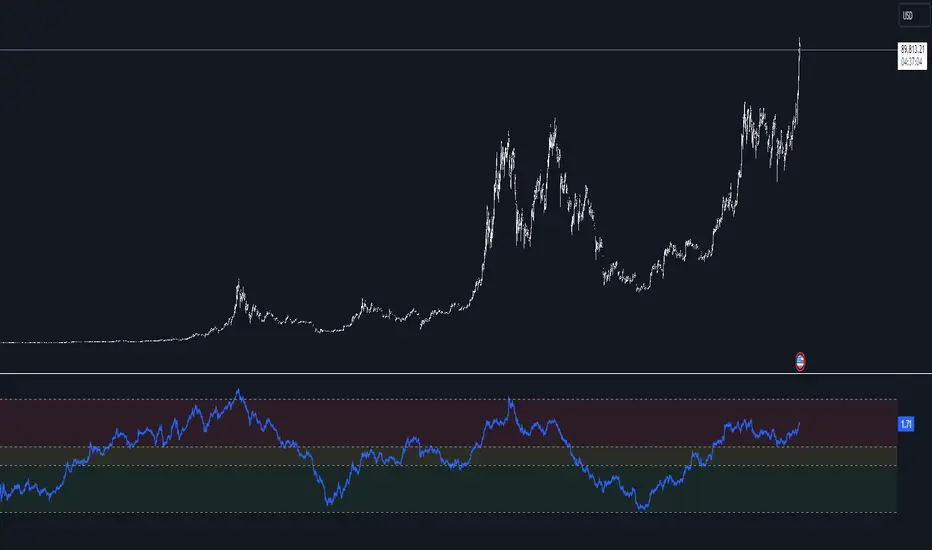
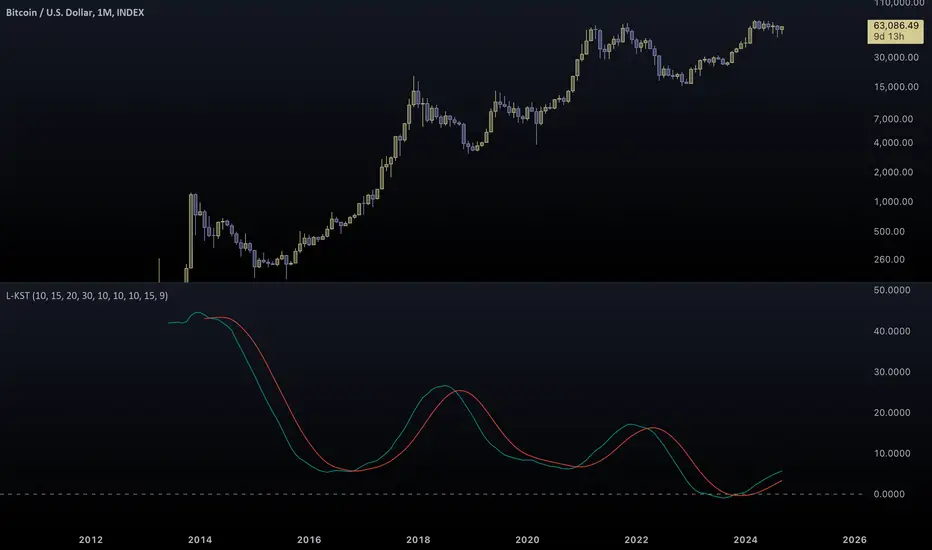
Log Know Sure ThingThe Know Sure Thing indicator (KST) is a momentum based oscillator. KST is based on Rate of Change (ROC). Know Sure Thing takes four different timeframes of ROC and smooth's them out using Simple Moving Averages. KST then calculates a final value that fluctuates between positive and negative values above and below a Zero Line. There is also a signal line which is an SMA of the KST line itself. Essentially, the Know Sure Thing Indicator measures the momentum of four separate price cycles. Technical Analysts use this information to spot divergences, overbought and oversold conditions and crossovers.
KST takes the Rate of Change for four different time periods, smooth's them out with moving averages, weights them and then sums the results. The intention is to get a better understanding of the momentum for a particular security of financial instrument. The general rule is that when KST is positive, then momentum is up and when KST is negative, then momentum is down. This would translate to Bullish and Bearish markets respectively.
The original Know Sure Thing indicator (KST) was developed by Martin Pring and introduced in 1992 in Stocks & Commodities Magazine. He originally referred to the indicator as the Summed Rate of Change.
This version of the indicator "Log Know Sure Thing" (L-KST) was developed by me as a refined solution to the original. Exponential charts like Bitcoin need exponential calculations. Simplistic approaches don't work in today's world. This indicator manages to adapt in all kinds of scenarios...
From negative charts:
(notice that the original KST breaks)
To extreme charts:
(again, the original doesn't manage to capture the Bitcoin oscillation)
If you are not familiar with KST, read the following analysis:
www.tradingview.com
For a following version of this indicator I plan to incorporate actual overbought-oversold levels (if this doesn't mark the 20th).
Contrary to the original, this version of KST is bound to specific levels.
Stay tuned for that, it won't take long...
Tread lightly, for this is no-mans-land.
Use caution when using contraband indicators.
-Father Akikostas
HFT V.2 EnhancedTitle: HFT V.2 Enhanced - ATR Dynamic Stop-Loss & Take-Profit
Description:
The HFT V.2 Enhanced strategy is designed for high-frequency trading with dynamic trade management and robust entry/exit logic. This strategy uses simple moving averages (SMA) for trend identification and the relative strength index (RSI) for momentum confirmation. In this enhanced version, the strategy also incorporates dynamic stop-loss and take-profit levels based on the Average True Range (ATR), offering better adaptability to market volatility.
Features:
Moving Average Crossover: Uses a fast and slow SMA to capture trend reversals and generate trade entries.
RSI Confirmation: Ensures momentum is in the direction of the trade by incorporating the RSI threshold for both long and short entries.
Dynamic Stop-Loss and Take-Profit: Stop-loss and take-profit levels are calculated based on the ATR, allowing the strategy to adjust its exit points according to market volatility. This helps manage risk more effectively and capture larger trends.
Auto-Close Opposing Positions: Automatically closes any open long positions when a short entry is triggered, and vice versa.
Once-Per-Bar Execution: Ensures that a position is entered only once per bar, avoiding multiple trades within the same bar.
Parameters:
Fast MA Length: Defines the length of the fast-moving average.
Slow MA Length: Defines the length of the slow-moving average.
RSI Length: Sets the period for the RSI indicator.
RSI Threshold: Controls the RSI level for confirming momentum (50 by default).
ATR Length: Determines the period for the ATR calculation.
ATR Multiplier for Stop-Loss/Take-Profit: Adjusts the sensitivity of the stop-loss and take-profit levels based on ATR.
How it Works:
Long Entry: The strategy opens a long trade when the fast SMA crosses above the slow SMA, and the RSI is above the user-defined threshold. A dynamic stop-loss is placed below the entry price, and a take-profit target is set based on ATR.
Short Entry: The strategy opens a short trade when the fast SMA crosses below the slow SMA, and the RSI is below the inverse threshold. A stop-loss is placed above the entry price, and a take-profit target is set using ATR.
Risk Management: The strategy adapts to changing market conditions by dynamically adjusting its stop-loss and take-profit levels, ensuring it remains responsive to market volatility.
This script is ideal for traders looking for a high-frequency strategy with advanced trade management, including dynamic exits and volatility-based risk management.
Disclaimer: Always backtest and optimize the parameters to fit your trading style and risk tolerance before using the strategy in live trading.

Relative volume zone + Smart Order Flow Dynamic S/ROverview:
The Relative Volume Zone + Smart Order Flow with Dynamic S/R indicator is designed to help traders identify key trading opportunities by combining multiple technical components. This script integrates relative volume analysis, order flow detection, VWAP, RSI filtering, and dynamic support and resistance levels to offer a comprehensive view of the market conditions. It is particularly effective on shorter timeframes (M5, M15), making it suitable for scalping and day trading strategies.
Key Components:
1. Relative Volume Zones:
• The script calculates the relative volume by comparing the current volume with the average volume over a defined lookback period (volLookback). When the relative volume exceeds a specified multiplier (volMultiplier), it indicates a high volume zone, signaling potential accumulation or distribution areas.
• Purpose: Identifies high-volume trading zones that may act as significant support or resistance, indicating possible entry or exit points.
2. Smart Order Flow Analysis:
• The indicator uses Volume Delta (the difference between buying and selling volume) and a Cumulative Delta to detect order imbalances in the market.
• Order Imbalance is identified using a moving average of the Volume Delta (orderImbalance), which helps highlight hidden buying or selling pressure.
• Purpose: Reveals market sentiment by showing whether buyers or sellers dominate the market, aiding in the identification of trend reversals or continuations.
3. VWAP (Volume Weighted Average Price):
• VWAP is calculated over a default daily length (vwapLength) to show the average price a security has traded at throughout the day, based on both volume and price.
• Purpose: Provides insight into the fair value of the asset, indicating whether the market is in an accumulation or distribution phase.
4. RSI (Relative Strength Index) Filter:
• RSI is used to filter buy and sell signals, preventing trades in overbought or oversold conditions. It is calculated using a specified period (rsiPeriod).
• Purpose: Reduces false signals and improves trade accuracy by only allowing trades when RSI conditions align with volume and order flow signals.
5. Dynamic Support and Resistance Levels:
• The script dynamically plots support and resistance levels based on recent swing highs and lows (swingLookback).
• Purpose: Identifies potential reversal zones where price action may change direction, allowing for more precise entry and exit points.
How It Works:
• Buy Signal:
A buy signal is generated when:
• The price enters a high-volume zone.
• The price crosses above a 5-period moving average.
• The cumulative delta shows more buying pressure (cumulativeDelta > SMA of cumulativeDelta).
• The RSI is below 70 (not in overbought conditions).
• Sell Signal:
A sell signal is generated when:
• The price enters a high-volume zone.
• The price crosses below a 5-period moving average.
• The cumulative delta shows more selling pressure (cumulativeDelta < SMA of cumulativeDelta).
• The RSI is above 30 (not in oversold conditions).
• Dynamic Support and Resistance Lines:
Drawn based on recent swing highs and lows, these lines provide context for potential price reversals or breakouts.
• VWAP and Order Imbalance Lines:
Plotted to show the average traded price and highlight order flow shifts, helping to validate buy/sell signals.
How to Use:
1. Apply the Indicator:
Add the script to your chart and adjust the settings to match your trading style and preferred timeframe (optimized for M5/M15).
2. Interpret the Signals:
Use the buy and sell signals in conjunction with dynamic support/resistance, VWAP, and order imbalance lines to identify high-probability trade setups.
3. Monitor Alerts:
Set alerts for significant order flow events to receive notifications when there is a positive or negative order imbalance, indicating potential market shifts.
What Makes It Unique:
This script is unique because it combines multiple market analysis tools — relative volume zones, smart order flow, VWAP, RSI filtering, and dynamic support/resistance — to provide a well-rounded, multi-dimensional view of the market. This integration allows traders to make more informed decisions by validating signals across various indicators, enhancing overall trading accuracy and effectiveness.

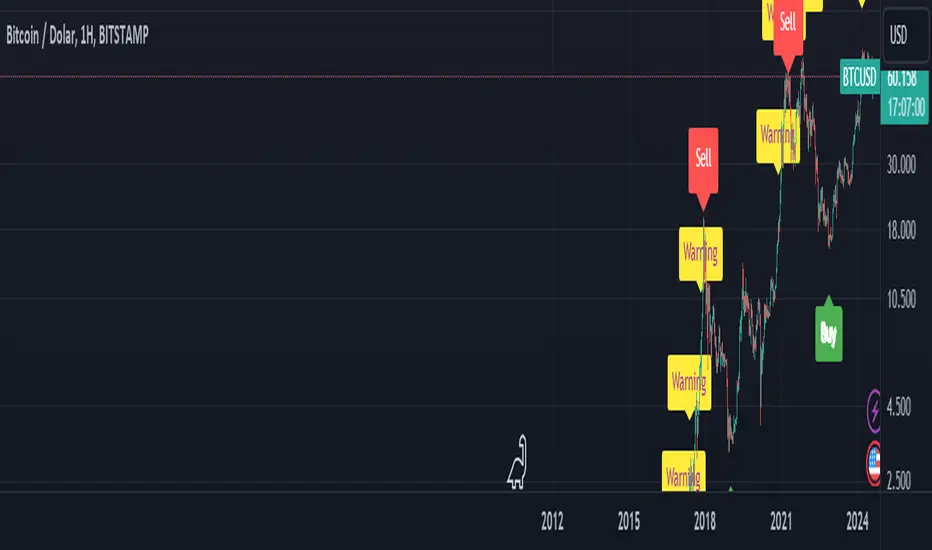
BTC Arcturus IndicatorBTC Arcturus Indicator: This indicator is designed to create buy and sell signals based on the market value of Bitcoin. It also predicts potential market tops with the Pi Cycle Top indicator.
How Does It Work?
1. MVRVZ (Market Value to Realized Value-Z Score) Calculation:
MC: Bitcoin's market cap (Market Cap) is pulled daily from Glassnode data.
MCR: Realized Market Cap of Bitcoin is taken daily from Coinmetrics data.
MVRVZ: It is calculated by dividing the difference between Bitcoin's market value and realized market value by one standard deviation. This value indicates whether the market is overvalued or undervalued.
2. Reception and Warning Signals:
Buy Signal: When MVRVZ falls below the -0.255 threshold value, the indicator gives a "Buy" signal. This indicates that Bitcoin is undervalued and may be a buying opportunity.
Warning Signal: A warning signal turns on when MVRVZ exceeds the threshold value of 2.765. This indicates that the market is approaching saturation and caution is warranted.
3. Tracking the Highest MVRVZ Value:
The indicator records the highest MVRVZ value in the last 10 candlesticks. This value is used to determine whether the market has reached its highest risk levels.
4. Warning Display:
If the MVRVZ value matches the highest value in the last 10 bars and this warning has not been displayed before, a "Warning" signal is displayed.
Once the warning signal is shown, no further warnings are shown for 10 candles.
5. Pi Cycle Top Indicator:
Pi Cycle Top: This indicator predicts Bitcoin tops by comparing two moving averages (350-day and 111-day). If the short-term moving average falls below the long-term moving average, this is considered a sell signal.
The indicator displays this signal with the label "Sell", indicating a potential market top.
User Guide:
Green Buy Signal: It means Bitcoin is cheap and offers a buying opportunity.
Yellow Warning Signal: Indicates that Bitcoin has reached possible profit taking points and caution should be exercised.
Red Sell Signal: Indicates that Bitcoin has reached market saturation and it may be appropriate to sell.
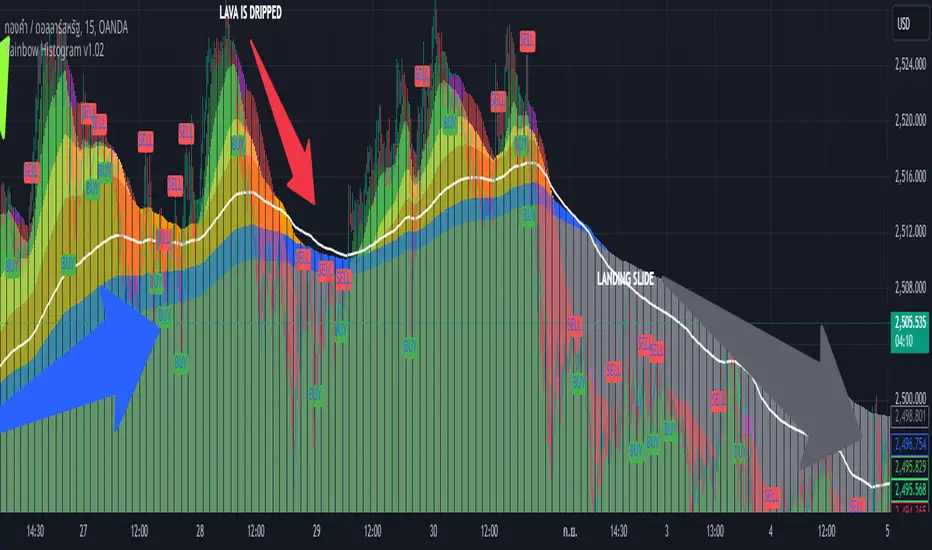
Rainbow Histogram v1.01Sure! Here’s a compelling English version of the article for your TradingView post:
---
### 🌈 **Introducing Rainbow Histogram: A Fusion of EMA and MA for Enhanced Trading Analysis**
**Hello Traders,**
I’m excited to introduce a fresh concept that combines technical analysis techniques into a new indicator called **Rainbow Histogram**. This innovative tool blends Exponential Moving Averages (EMA) and Moving Averages (MA) to provide you with a powerful and accurate tool for making trading decisions.
#### **🎨 What is Rainbow Histogram?**
The Rainbow Histogram is designed to help you identify market trends and signal precise entry and exit points by blending EMA and MA into a colorful "Rainbow" display. This visual approach enhances your ability to spot trend strength and direction with clarity.
#### **📈 How Does Rainbow Histogram Work?**
1. **Exponential Moving Average (EMA):** Captures short-term trends and reacts quickly to price changes.
2. **Moving Average (MA):** Tracks long-term trends and provides a broader view of the market direction.
**Rainbow Histogram** uses the combination of EMA and MA to create a histogram that shows the difference between these two averages in distinct colors. This makes it easy to visualize trend changes and market momentum.
#### **🔧 Setting It Up**
1. **EMA:** Adjust the EMA settings based on your trading timeframe and strategy (e.g., EMA 9, EMA 21).
2. **MA:** Set the MA parameters to capture long-term trends (e.g., MA 50, MA 200).
#### **🌟 Why Use Rainbow Histogram?**
- **Simplified Analysis:** Quickly identify trends and their strength with a clear visual representation.
- **Distinct Colors:** Differentiate between EMA and MA with vibrant colors for easy interpretation.
- **Precise Signals:** Get clear buy and sell signals based on histogram changes.
#### **📥 Get Started**
Add **Rainbow Histogram** to your TradingView charts by searching for the script in TradingView’s library or set it up manually using the recommended settings.
#### **📝 In Summary**
**Rainbow Histogram** is a unique tool that simplifies trend analysis and enhances accuracy by merging EMA and MA into a single, colorful indicator. Use this tool to refine your trading strategy and make more informed financial decisions.
If you have any questions or feedback about **Rainbow Histogram**, feel free to comment below or send me a message!
**Happy Trading!** 🌟
---
I hope this version effectively captures attention and engages your audience!
Rsi Long-Term Strategy [15min]Hello, I would like to present to you The "RSI Long-Term Strategy" for 15min tf
The "RSI Long-Term Strategy " is designed for traders who prefer a combination of momentum and trend-following techniques. The strategy focuses on entering long positions during significant market corrections within an overall uptrend, confirmed by both RSI and volume. The use of long-term SMAs ensures that trades are made in line with the broader market trend. The stop-loss feature provides risk management by limiting losses on trades that do not perform as expected. This strategy is particularly well-suited for longer-term traders who monitor 15-minute charts but look for substantial trend reversals or continuations.
Indicators and Parameters:
Relative Strength Index (RSI):
- The RSI is calculated using a 10-period length. It measures the magnitude of recent price changes to evaluate overbought or oversold conditions. The script defines oversold conditions when the RSI is at or below 30 and overbought conditions when the RSI is at or above 70.
Volume Condition:
-The strategy incorporates a volume condition where the current volume must be greater than 2.5 times the 20-period moving average of volume. This is used to confirm the strength of the price movement.
Simple Moving Averages (SMA):
- The strategy uses two SMAs: SMA1 with a length of 250 periods and SMA2 with a length of 500 periods. These SMAs help identify long-term trends and generate signals based on their crossover.
Strategy Logic:
Entry Logic:
A long position is initiated when all the following conditions are met:
The RSI indicates an oversold condition (RSI ≤ 30).
SMA1 is above SMA2, indicating an uptrend.
The volume condition is satisfied, confirming the strength of the signal.
Exit Logic:
The strategy closes the long position when SMA1 crosses under SMA2, signaling a potential end of the uptrend (a "Death Cross").
Stop-Loss:
A stop-loss is set at 5% below the entry price to manage risk and limit potential losses.
Buy and sell signals are highlighted with circles below or above bars:
Green Circle : Buy signal when RSI is oversold, SMA1 > SMA2, and the volume condition is met.
Red Circle : Sell signal when RSI is overbought, SMA1 < SMA2, and the volume condition is met.
Black Cross: "Death Cross" when SMA1 crosses under SMA2, indicating a potential bearish signal.
to determine the level of stop loss and target point I used a piece of code by RafaelZioni, here is the script from which a piece of code was taken
I hope the strategy will be helpful, as always, best regards and safe trades
;)

Combined Bitcoin CME Gaps and Weekend DaysScript Description: Combined Bitcoin CME Gaps and Weekend Days
Author: NeoButane (Bitcoin CME Gaps), JohnIsTrading (Day of Week),
Contributor : MikeTheRuleTA (Combined and optimizations)
This Pine Script indicator provides a combined view of Bitcoin CME gaps and customizable weekend day backgrounds on your chart. It’s designed to help traders visualize CME gaps along with customizable weekend day highlights.
Features:
CME Gaps Visualization:
Enable CME Gaps: Toggle the display of CME gaps on your chart.
Show Real vs. CME Price: Choose whether to display chart prices or CME prices for gap analysis.
Weekend Gaps Only: Filter to show only weekend gaps for a cleaner view (note: this may miss holidays).
CME Gaps Styling:
Weekend Background Highlighting:
Enable Weekend Background: Toggle the weekend day background highlight on or off.
Timezone Selection: Choose the relevant timezone for accurate weekend highlighting.
Customizable Weekend Colors: Define colors for Saturday and Sunday backgrounds.
How It Works:
CME Gaps: The script identifies gaps between CME and chart prices when the CME session is closed. It plots these gaps with customizable colors and line widths.
You can choose to see gaps based on CME prices or chart prices and decide whether to include only weekends.
Weekend Backgrounds: The script allows for background highlighting of weekends (Saturday and Sunday) on your chart. This can be enabled or disabled and customized with specific colors.
The timezone setting ensures that the background highlights match your local time settings.
Inputs:
CME Gaps Settings:
Enable CME Gaps
Show Real vs. CME Price
Only Show Weekend Gaps
CME Gaps Style:
Gap Fill Color Up
Gap Fill Color Down
Gap Fill Transparency
Weekend Settings:
Enable Weekend Background
Timezone
Enable Saturday
Saturday Color
Enable Sunday
Sunday Color
Usage:
Add this script to your TradingView chart to overlay CME gaps and weekend highlights.
Adjust the settings according to your preferences for a clearer view of gaps and customized weekend backgrounds.
This indicator provides a comprehensive tool for tracking CME gaps and understanding weekend market behaviors through visual enhancements on your trading charts.
BTC Coinbase PremiumThis script is designed to compare the price of Bitcoin on two major exchanges: Coinbase and Binance. It helps you see if there’s a difference in the price of Bitcoin between these two exchanges, which is known as a “premium” or “discount.”
Here’s how it works in simple terms:
Getting the Prices:
The script first fetches the current price of Bitcoin from Coinbase and Binance. It looks at the closing price, which is the price at the end of the selected time period on your chart.
Calculating the Difference:
It then calculates the difference between these two prices. If Bitcoin is more expensive on Coinbase than on Binance, this difference will be positive, indicating a “premium.” If it’s cheaper on Coinbase, the difference will be negative, indicating a “discount.”
Visualizing the Difference:
The script creates a visual chart that shows this price difference over time. It uses green bars to show when there’s a premium (Coinbase is more expensive) and red bars to show when there’s a discount (Coinbase is cheaper).
Optional Table Display:
If you choose to, the script can also show this price difference in a small table at the top right corner of your chart. The table displays the words “Coinbase Premium” and the exact dollar amount of the premium or discount.
Why does it matter?
Traders and investors have spotted a correlation between bullish strength on BTC and a strong Coinbase premium along with the inverse of a strong Coinbase discount and BTC price weakness.

Quatro SMA Strategy [4h]Hello, I would like to present to you The "Quatro SMA" strategy
Strategy is based on four simple moving averages of different lengths and monitoring trading volume. The key idea is to identify strong market trends by comparing short-term moving averages with the long-term SMA. The strategy generates buy signals when all short-term SMAs are above the SMA(200) and the volume confirms the strength of the move. Similarly, sell signals are generated when all short-term SMAs are below the SMA(200), and the volume is sufficiently high.
The strategy manages risk by applying a stop loss and three different Take Profit levels (TP1, TP2, TP3), with varying percentages of the position closed at each level.
Each Take Profit level is triggered at a specific percentage gain, with the position being closed gradually depending on the achieved targets. The percentage of the position closed at each TP level is also defined by the user.
Indicators and Parameters:
Simple Moving Averages (SMA):
The script utilizes four simple moving averages with different lengths (4, 16, 32, 200). The first three SMAs (SMA1, SMA2, SMA3) are used to determine the trend direction, while the fourth SMA (with a length of 200) serves as a support/resistance line.
Volume:
The script monitors trading volume and checks if the current volume exceeds 2.5 times the average volume of the last 40 candles. High volume is considered as confirmation of trend strength.
Entry Conditions:
- Long Position: Triggered when SMA1 > SMA2 > SMA3, the closing price is above SMA(200), and the volume condition is met.
- Short Position: Triggered when SMA1 < SMA2 < SMA3, the closing price is below SMA(200), and the volume condition is met.
Exit Conditions:
- Long Position: Closed when SMA1 < SMA2 < SMA3 and the closing price is above SMA(200).
- Short Position: Closed when SMA1 > SMA2 > SMA3 and the closing price is below SMA(200).
to determine the level of stop loss and target point I used a piece of code by RafaelZioni, here is the script from which a piece of code was taken
I hope the strategy will be helpful, as always, best regards and safe trades
;)

NOVO ALGO - Starry SkyGeneral Description:
This indicator provides the possible buy and sell entry with the estimated risk and its corresponding Stop Loss (SL) value.
It has originally developed for 1-min chart and works the best on this time-frame. It may work on the other time-frames, but its profitability has not been checked. So, I would rather recommend to use and apply it only on 1-min chart.
Novelty of the indicator:
Trading in 1-min chart consists of dealing with so many small swings and price variations which are very local and does not affect the general trend even in the 5-min time frame.
We call these small price variations and swings 'Noise'.
The novelty of the indicator is in a parameter which we call the Noise Level and filtering length.
It has been widely used in the Fluid Dynamics and in the Large Eddy Simulations where small noises of flow is removed by a dynamic filter.
In this indicator, we have tried to incorporate the same idea but in the price trend detection.
For the current version, we have used a less tolerance for noise level which results in much less signals compared to the full capacity of the indicator. It roughly sends out around 10-15% of the total confirmed positions.
How it detects the entry positions
To define the entry point, 5 main properties are considered and checked at 3 main time frames including 1-min, 5-min, and 15-min.
These time-frames are selected based on the fact that the target chart is in 1-min.
The 5 properties evaluated are:
1- Smooth Moving Average
2- Bollinger Band
3- Price Regression
4- Candle Pattern
5- Volume
Detailed Description:
Detect a possible entry by Smooth Moving Average:
- At each time frame, 3 lengths are considered to calculate the price moving average values; i.e. short, medium and long lengths.
- The interaction of these MAs, of course, defines the local trend of the price generally. It also provides an idea about the strength of the trend.
- The information calculated at 1-min time frame triggers the possible buy/sell. However, it waits until getting confirmation from the upper time frame (5-min).
- We use the MAs of 15-min time frame to define the general dominant price trend and stop reverse signals when the trend is fully dominant in one direction.
When a possible entry position is triggered by the MAs, at that very price bar we calculate the noise level.
If the noise level is higher than a certain predefined value, then the signal is rejected. Otherwise the signal gets out.
The threshold we use to define if a signal is noisy or not is normalized so it can be used without any concern at different markets.
We believe the calculations and ideas behind the Noise Level is what makes this indicator unique and practical.
We define the noise level parameter based on the following properties:
1- Smooth Moving Average at upper time frame (basically 15-min):
If a possible signal is against the trend of the upper time-frame, the noise level is increased.
If it is in the direction of the upper time-frame trend, then the noise level is untouched.
As already mentioned, different lengths are used. So, as the length of MA is larger its impact on the noise level is considered higher.
2- Bollinger Band of upper time frames (5-min and 15-min)
We employ bollinger bands to define 4 regions.
1. Above the upper band
2. Between middle and upper band
3. Between Lower and middle bands
4. Below the lower band
Then use these 4 regions along with the candle position and price regression.
For example, if the price regression line and candle position are on the same region of BB, then we assume less possibility for reverse or strong trend.
Consequently, we increase the noise level parameter. On the other hand, if they belong to two different region, we assume more possibility for big price change, and so we lower the noise level.
3- Price Regression
We use average price regression line to filter out very small swings in the price. We have also set a criterion of continuity for the regression line that ensures small price variation and swings are left out and filtered.
This will come with the sot of delay in the confirmation of signal, but we found it very important to remove very small swings of price that, for example, consists of only few bars in 1-min chart.
We have also used the position of the regression line along with the regions defied by BBs to evaluate the strength of a newly detected trend.
As candles will always reach to the regression at some point, if a possible entry is detected and the regression line and candles belong to two different region, we assume a strong price change. But if they belong to the same region, we increase the noise level and will assume that it might be a small swing.
4- Candle Pattern
We assumed several rules for candles shape and prices to define if a price movement is strong or it is just a small swing. For example we expect the price to be increase in the last 2-3 candles if we should call a entry for long position.
These set of self-made rules have been extracted by using the visual inspections of the price movement. This has been done much more advanced for long entry position which has resulted in more long signals by the indicator.
5- Volume
We use volume of trades in 1-min, 5-min, and 15-min to evaluate the strength of the trend. We use both absolute and what we call directional volume! The directional volume is the volume with the sign of the candle. This helps us to know if the reverse trend supported by enough volume or it is just a small swing.
For example, if the directional volume of 1-min can surpass the 5-min directional volume, this indicates to us that the importance of 5-min data and its validity is less. So, more focus will be put on the 1-min volume data and the direction it indicates.
Money Management:
Profit calculation: the profit is calculated based on the user defined leverage (default 100x). The user has the option to change the buy/sell leverages to the desired values.
Risk assessment: The user has the option to adjust the risk of the trades. Then the SL value will be calculated for each trade according to the defined risk value.
If a value of zero is set for the risk, then the indicator will define the local SL of each trade based on the pivot point.
As in 1-min trading, the prices are noise and include several small swings and consequently several minor pivot points, we filtered the pivot points that belong to the super small swings detected by our noise level indicator.
Suggestion
I found it more profitable to make the trades risk-free when their profits passes 10% (with leverage 100x). Then, readjust the TP of trades if the trend is in the direction of the position.
I would recommend to observe the performance of the indicator for a day or two, before actually trading with its signals. This will help to have a better understanding of the leverage and risk you may apply.

BTC outperform atrategy### Code Description
This Pine Script™ code implements a simple trading strategy based on the relative prices of Bitcoin (BTC) on a weekly and a three-month basis. The script plots the weekly and three-month closing prices of Bitcoin on the chart and generates trading signals based on the comparison of these prices. The code can also be applied to Ethereum (ETH) with similar effectiveness.
### Explanation
1. **Inputs and Variables**:
- The user selects the trading symbol (default is "BINANCE:BTCUSDT").
- `weeklyPrice` retrieves the closing price of the selected symbol on a weekly interval.
- `monthlyPrice` retrieves the closing price of the selected symbol on a three-month interval.
2. **Plotting Data**:
- The weekly price is plotted in blue.
- The three-month price is plotted in red.
3. **Trading Conditions**:
- A long position is suggested if the weekly price is greater than the three-month price.
- A short position is suggested if the three-month price is greater than the weekly price.
4. **Strategy Execution**:
- If the long condition is met, the strategy enters a long position.
- If the short condition is met, the strategy enters a short position.
This script works equally well for Ethereum (ETH) by changing the symbol input to "BINANCE:ETHUSDT" or any other desired Ethereum trading pair.
