Average Bullish & Bearish Percentage ChangeAverage Bullish & Bearish Percentage Change
Processes two key aspects of directional market movements relative to price levels. Unlike traditional momentum tools, it separately calculates the average of positive and negative percentage changes in price using user-defined independent counts of actual past bullish and bearish candles. This approach delivers comprehensive and precise view of average percentage changes.
FEATURES:
Count-Based Averages: Separate averaging of bullish and bearish %𝜟 based on their respective number of occurrences ensures reliable and precise momentum calculations.
Customizable Averaging: User-defined number of candle count sets number of past bullish and bearish candles used in independent averaging.
Two Methods of Candle Metrics:
1. Net Move: Focuses on the body range of the candle, emphasizing the net directional movement.
2. Full Capacity: Incorporates wicks and gaps to capture full potential of the bar.
The indicator classifies Doji candles contextually, ensuring they are appropriately factored into the bullish or bearish metrics to avoid mistakes in calculation:
1. Standard Doji - open equals close.
2. Flat Close Doji - Candles where the close matches the previous close.
Timeframe Flexibility:
The indicator can be applied across any desired timeframe, allowing for seamless multi-timeframe analysis.
HOW TO USE
Select Method of Bar Metrics:
Net Move: For analyzing markets where price changes are consistent and bars are close to each other.
Full Capacity: Incorporates wicks and gaps, providing relevant figures for markets like stocks
Set the number of past candles to average:
🟩 Average Past Bullish Candles (Default: 10)
🟥 Average Past Bullish Candles (Default: 10)
Why Percentage Change Is Important
Standardized Measurement Across Assets:
Percentage change normalizes price movements, making it easier to compare different assets with varying price levels. For example, a $1 move in a $10 stock is significant, but the same $1 move in a $1,000 stock is negligible.
Highlights Relative Impact:
By measuring the price change as a percentage of the close, traders can better understand the relative impact of a move on the asset’s overall value.
Volatility Insights:
A high percentage change indicates heightened volatility, which can be a signal of potential opportunities or risks, making it more actionable than raw price changes. Percents directly reflect the strength of buying or selling pressure, providing a clearer view of momentum compared to raw price moves, which may not account for the relative size of the move.
By focusing on percentage change, this indicator provides a normalized, actionable, and insightful measure of market momentum, which is critical for comparing, analyzing, and acting on price movements across various assets and conditions.
תבניות שווריות

US Sentiment Index [CryptoSea]The US Sentiment Index is an advanced analytical tool designed for traders seeking to uncover patterns, correlations, and potential leading signals across key market tickers. This indicator surpasses traditional sentiment measures, providing a data-driven approach that offers deeper insights compared to conventional indices like the Fear and Greed Index.
Key Features
Multi-Ticker Analysis: Integrates data from a diverse set of market indicators, including gold, S&P 500, U.S. Dollar Index, Volatility Index, and more, to create a comprehensive view of market sentiment.
Customisable Sensitivity Settings: Allows users to adjust the moving average period to fine-tune the sensitivity of sentiment calculations, adapting the tool to various market conditions and trading strategies.
Detailed Sentiment Scaling: Utilises a 0-100 scale to quantify sentiment strength, with colour gradients that visually represent bearish, neutral, and bullish conditions, aiding in quick decision-making.
Below is an example where the sentiment index can give leading signals. We see a first sign of wekaness in the index as it drops below its moving average. Shortly after we see it dip below our median 50 level, another sign of weakeness. We see the SPX price action to take a hit following the sentiment index decrease.
Tickers Used and Their Impact on Sentiment
The impact of each ticker on sentiment can be bullish or bearish, depending on their behaviour:
Gold (USGD): Typically seen as a safe-haven asset, rising gold prices often indicate increased market fear or bearish sentiment. Conversely, falling gold prices can signal reduced fear and a shift towards bullish sentiment in riskier assets.
S&P 500 (SPX): A rising S&P 500 is usually a sign of bullish sentiment, reflecting confidence in economic growth and market stability. A decline, however, suggests bearish sentiment and a potential move towards risk aversion.
U.S. Dollar Index (DXY): A strengthening U.S. Dollar can be a sign of fear as investors seek safety in the dollar, which is bearish for risk assets. A weakening dollar, on the other hand, can signal bullish sentiment as capital flows into riskier assets.
Volatility Index (VIX): Known as the "fear gauge," a rising VIX indicates increased market fear and bearish sentiment. A falling VIX suggests a calm, bullish market environment.
Junk Bonds (JNK): Rising junk bond prices often reflect bullish sentiment as investors take on more risk for higher returns. Conversely, falling junk bond prices signal increased fear and bearish sentiment.
Long-Term Treasury Bonds (TLT): Higher prices for long-term treasuries usually indicate a flight to safety, reflecting bearish sentiment. Lower prices suggest a shift towards riskier assets, indicating bullish sentiment.
Financial Sector ETF (XLF): Strength in the financial sector is typically bullish, indicating confidence in economic conditions. Weakness in this sector can reflect bearish sentiment and concerns about financial stability.
Unemployment Rate (USUR): A rising unemployment rate is a bearish signal, indicating economic weakness. A declining unemployment rate is bullish, reflecting economic strength and job growth.
U.S. Interest Rates (USINTR, USIRYY): Higher interest rates can be bearish, as they increase borrowing costs and reduce spending. Lower rates are generally bullish, promoting economic growth and risk-taking.
How it Works
Sentiment Calculation: The US Sentiment Index combines data from multiple tickers, calculating sentiment by scaling the distance from their respective moving averages. Each asset's behaviour is interpreted within the context of market fear or greed, providing a refined sentiment reading that adjusts dynamically.
Market Strength Analysis: When the index is above 50 and also above its moving average, it indicates particularly strong or bullish market conditions, driven by greed. Conversely, when the index is below 50 and under its moving average, it signals bearish or weak market conditions, associated with fear.
Correlation and Pattern Detection: The indicator analyses correlations among the included assets to detect patterns that might signal potential market movements, giving traders a leading edge over simpler sentiment measures.
Adaptive Background Colouring: Utilises a colour gradient that dynamically adjusts based on sentiment values, highlighting extreme fear, neutral, and extreme greed levels directly on the chart.
Flexible Display Options: Offers settings to toggle the moving average plot and adjust its period, giving users the ability to tailor the indicator's sensitivity and display to their specific needs.
In this example below, we can see the Sentiment rise above the Moving Average (MA). Price action goes on to follow this, although there is an instance where it dips below the MA, it quickly rises back above again as a sign of strength.
Another way you can use this index is by simply using the MA, if its trending up, we know the macro sentiment is bullish.
Application
Data-Driven Insights: Offers traders a detailed, data-driven approach to sentiment analysis, incorporating a broad spectrum of market indicators to deliver actionable insights.
Pattern Recognition: Helps identify patterns and correlations that may lead to market reversals or continuations, providing a nuanced view that goes beyond simple sentiment gauges.
Enhanced Decision-Making: Equips traders with a robust tool to validate trading strategies and make informed decisions based on comprehensive sentiment analysis.
The US Sentiment Index by is an essential addition to the toolkit of any trader looking to navigate market complexities with precision and confidence. Its advanced features and data-driven approach offer unparalleled insights into market sentiment, setting it apart from conventional sentiment indicators.

RCYC Bullish Bearish Indicator
Summary: The RCYC Bullish Bearish Indicator is a custom trading tool designed to help traders identify potential bullish and bearish conditions in the market using a combination of KDJ and RSI indicators. This indicator uses color-coded candles to visually represent bullish and bearish signals, making it easy to identify trend changes on the chart. The script is particularly useful for traders who prefer visual signals and want to incorporate both trend momentum (KDJ) and relative strength (RSI) in their analysis.
Description:
The RCYC Bullish Bearish Indicator is a unique mashup of the KDJ and RSI indicators, optimized to provide a clear visual representation of market conditions through color-coded candles. This indicator not only identifies the potential trend shifts but also provides alerts for significant crossover points, enhancing a trader's ability to make informed decisions.
How It Works:
KDJ Calculation:
The KDJ is a variation of the Stochastic Oscillator that includes the %J line, which can go beyond the typical 0-100 range of %K and %D.
The KDJ component of this indicator calculates the highest high and lowest low over a specified period (KDJ Length), using these values to derive the %K line.
The %D line is a smoothed version of %K, and the %J line is derived from %K and %D using the formula: J = 3 * %K - 2 * %D.
This indicator focuses on the behavior of the %J line in relation to a mid-point level (50), identifying crossovers and crossunders that signal potential shifts in market sentiment.
RSI Calculation:
The Relative Strength Index (RSI) is a momentum oscillator that measures the speed and change of price movements. It is widely used to identify overbought or oversold conditions.
In this indicator, RSI values are adjusted and plotted to align visually with the KDJ values, providing a complementary momentum analysis.
Crossover Logic and Candle Coloring:
The indicator tracks two main events:
CrossOver50: When the %J line crosses above the 50 level, indicating potential bullish momentum.
CrossUnder50: When the %J line crosses below the 50 level, indicating potential bearish momentum.
Depending on the crossover events, the script changes the color of the candles on the chart:
Red candles on the initial crossover above 50, followed by dark blue candles to maintain bullish sentiment.
Yellow candles on the initial crossover below 50, followed by light blue candles to maintain bearish sentiment.
Alerts:
The indicator includes alert conditions for both bullish and bearish signals:
Red Candle Alert: Notifies the trader when the %J line crosses above 50.
Yellow Candle Alert: Notifies the trader when the %J line crosses below 50.
These alerts allow traders to react promptly to key market signals without continuously monitoring the chart.
Usage and Benefits:
This indicator is designed for traders looking to combine momentum and trend analysis into a single visual tool. It is particularly useful for those trading in trending markets or looking for entry/exit signals based on momentum shifts.
The color-coded candles provide an intuitive way to assess market conditions at a glance, reducing the complexity associated with analyzing multiple indicators separately.
By integrating both KDJ and RSI, the RCYC Bullish Bearish Indicator offers a balanced approach to trend detection and momentum confirmation, making it versatile for various trading styles, including scalping, swing trading, and position trading.
Originality and Usefulness:
While the indicator builds upon the familiar concepts of KDJ and RSI, it uniquely merges them into a cohesive visual tool with distinct crossover-based alerts and candle coloring.
This approach makes the indicator original, as it simplifies the interpretation of complex signals into straightforward visual cues, enhancing the decision-making process for traders who prefer chart-based analysis.

Bullish Wave StructureThis indicator visualizes bullish waves and the uptrend structure. It highlights the wave patterns, breakout levels, and swing highs and lows, distinguishing major and minor swings. The script also incorporates labels to denote trend and wave numbers, enhancing clarity in trend and wave identification. The waves plotted on the chart aid in chart study, trend analysis, and decision-making. Drawing objects on the chart are customizable.
## Fundamental Trend Assumptions
A trend starts when there is a break above a major swing high. There is then a first wave.
Subsequent waves are validated when there is a break above the high of the preceding wave and another major swing high is detected.
The trend ends when the price trades below the swing low of the latest wave.
## Wave drawing mechanism
The drawing of a wave occurs when:
There is a break above a major swing high (or the high of a wave) and another major swing high is detected.
There is a break above a major swing high (or the high of a wave) and the price collapses below the lowest point between the highest high and the high of the previous wave. The script treats this false break high as a legitimate bullish wave, even if no major swing high has been detected. The trend ends because the low of the current wave has been breached. This is a false break high that falls back within the range of the preceding wave.
There is a break above a major swing high (or the high of a wave) and the price collapses below the low of the preceding wave. The script treats this false break high as a legitimate bullish wave, even if no major swing high has been detected. The trend ends because the low of the preceding wave has been breached. This is a false break high followed by a sharp sell-off.
In short, the script draws the wave if there is a break above a major swing high (or the high of a wave) and another swing high is detected (or there is a break below the low of a wave).
## Remarks
While lower timeframes could benefit from this indicator, it shows clearer wave and trend structures in higher timeframes, starting from the 1H chart.
This indicator does not provide price projections. The drawing occurs after the price patterns have been unveiled. In other words, it draws waves and performs labeling in hindsight. However, users can fully benefit from the indicator for trend study and various technical analyses to support trading decisions, as explained in the description above.
## Acknowledgement
The script uses user-defined functions to look back and find indexes of the highest and lowest values when no swings have been found (i.e., one-bar false break high and collapse). The detection of regular minor and major swings has been accomplished by the built-in functions:
ta.pivothigh() [Pine Script Language Reference Manual — TradingView (www.tradingview.com)
ta.pivotlow() [Pine Script Language Reference Manual — TradingView (www.tradingview.com)

Truly Bullish & Bearish CandleThis Pine Script indicator identifies and highlights truly bullish and bearish candles on your chart. Truly bullish candles are characterized by a strong bullish close significantly above the specific percentage, suggesting strong buying pressure. Conversely, truly bearish candles exhibit a strong bearish close significantly below the specific percentage, indicating strong selling pressure. By identifying these candles, traders can gain insights into potential shifts in market sentiment and make more informed trading decisions.
Key Features:
Identifies truly bullish and bearish candles based on strong open/close differentials.
Highlights these candles on the chart for easy visualization.
Helps traders identify potential reversals or continuations in market trends.
Customizable parameters for fine-tuning to suit individual trading strategies.
Compatible with various timeframes and trading instruments.
Usage Instructions:
Apply the indicator to your chart.
Configure the settings according to your preferences.
Look for highlighted truly bullish and bearish candles as potential entry or exit signals.
Consider additional analysis and risk management strategies to confirm trading decisions.
Disclaimer: This indicator is provided for informational and educational purposes only. It is not intended as financial advice or trading recommendations. Trading involves risks, and it's essential to conduct thorough research and practice proper risk management techniques.

TrendPivotsLibrary "TrendPivots"
This library provides functions to search for bullish and bearish divergences between pivots and indicators. Functions search for higher highs and lower lows, automating lines, labels and signals for technical analysis and strategies.
method maxBeforeLast(id)
Method function to get the maximum price before the last, stored in an array pivotPoint.
Namespace types: pivotPoint
Parameters:
id (pivotPoint ) : (array pivotPoint) The pivotPoint array to inspect.
Returns: pivotPoint
method minBeforeLast(id)
Method function to get the minimum price before the last, stored in an array pivotPoint.
Namespace types: pivotPoint
Parameters:
id (pivotPoint ) : (array pivotPoint) The pivotPoint array to inspect.
Returns: pivotPoint
method pivotLine(id, a, b, color)
Sets the coordinates of a given line using two pivotPoint variables.
Namespace types: series line
Parameters:
id (line) : (line) Existing line
a (pivotPoint) : (pivotPoint) First pivotPoint.
b (pivotPoint) : (pivotPoint) Second pivotPoint.
color (color) : (color) The desired color. Default is red.
Returns: void
bearishDivergence(pivotArray)
Look for bearish divergence in a pivotPoint array cointaining pivot highs.
Parameters:
pivotArray (pivotPoint ) : (array pivotPoint) The pivotPoint array to inspect.
Returns: bool True if bearish divergence was found.
bullishDivergence(pivotArray)
Look for bullish divergence in a pivotPoint array cointaining pivot lows.
Parameters:
pivotArray (pivotPoint ) : (array pivotPoint) The pivotPoint array to inspect.
Returns: bool True if bullish divergence was found.
uptrendPivot(leftBars, rightBars, indicator, reset, plotLabel, plotLine)
Detects higher highs, higher lows and bearish divergence in an uptrend. Creates a line when bearish divergence is found, and labels.
Parameters:
leftBars (int) : (int)
rightBars (int) : (int)
indicator (float) : (float) RSI, MACD or other value.
reset (bool) : (bool) A bool variable to reinitiates the pivot computation, such as time changes, crossovers, or another.
plotLabel (bool) : (bool) If true (default), plots labels to higher highs and for each pivot low. Default = true.
plotLine (bool) : (bool) If true (default), plots a line linking the lower lows with divergence. Default = true.
Returns:
downtrendPivot(leftBars, rightBars, indicator, reset, plotLabel, plotLine)
Detects lower lows, lower highs, and bullish divergence in a downtrend. Creates a line when bullish divergence is found, and labels.
Parameters:
leftBars (int) : (int)
rightBars (int) : (int)
indicator (float) : (float) RSI, MACD or other value.
reset (bool) : (bool) A bool variable to reinitiates the pivot computation, such as time changes, crossovers, or another.
plotLabel (bool) : (bool) If true (default), plots labels to lower lows, and for each pivot low.
plotLine (bool) : (bool) If true (default), plots a line linking the lower lows with divergence. Default = true.
Returns:
pivotPoint
The coordinates of a pivot point and corresponding indicator value.
Fields:
x (series int) : (int) Time.
y (series float) : (float) Price.
indicator (series float) : (float) Indicator value.

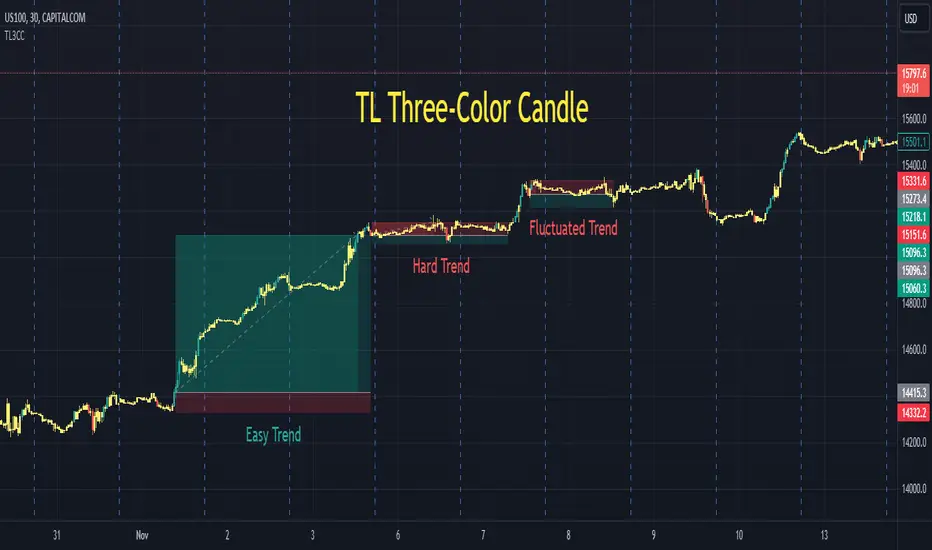
TL Three-Color CandleA traditional candle only has two colors, either green or red. A TL candle goes one step further, it has three colors: green for bullish (perfectly bullish), red for bearish (perfectly bearish), and yellow for ranging (wake-up, sleeping). A green TL candle means that its close is not only higher than its open but also higher than previous close, previous open and especially previous high, among other conditions. In the other extreme, a red TL candle indicates that its close is not only lower than its open but also lower than previous close, previous open and especially lower than previous low, among other conditions. TL candle does its best to tackle the trap of going against the trend: short when the price seems to be high in an uptrend or buy when the price seems to be low in a downtrend.
Parameters:
Volume Active Percentile % , Min Height Percentile of Bullish/Bearish Candle % . (Intraday)
Back Two Candles . (Intraday, day and above)
Usage:
After adding TL3CC to the chart, find Visual Order or Object Tree and bring TL3CC forward to be above the chart candle.
While a bullish trend includes green and yellow TL candles, a bearish trend includes red and yellow ones. It is the best to enter after the first bullish/bearish TL candle of each trend. It is extremely important, never ever try to go against TL candle.
There are many cases when red and green TL candles are twisted and we could have profit in both directions. It is the time that market is fluctuating strongly. We enter when TL candle has one color, but it changes to the opposite color after that as the price pulls back. In those cases, be calm and patient to wait for the first reversal to exit, it should come.
Markets: Developed and tested on: US100. Timeframes: Developed and tested on: 30m.
Bull Bear Power with Optional Normalization FunctionThis indicator is designed to provide traders with insights into market sentiment and potential trend reversals. This indicator enhances the traditional Bull Bear Power (BBP) by adding valuable visualizations and customization options to assist traders in making informed trading decisions.
Indicator Overview:
The NBBP indicator calculates Bull Bear Power, which measures the strength of bullish and bearish forces in the market. It does so by taking the difference between the high and the exponential moving average (EMA) of the closing price for a specified length. This raw BBP is represented on the chart as a line.
Key Features:
-- Zero Line : The NBBP indicator introduces a central reference line at zero. This line serves as a pivotal point for interpreting market sentiment. When the BBP line is above zero, it is colored green, indicating a predominance of bullish sentiment. Conversely, when the BBP line is below zero, it turns red, signaling a prevalence of bearish sentiment. This coloration helps traders quickly identify shifts in market sentiment.
-- OPTIONAL Normalization Function : One of the standout features of the NBBP indicator is its optional normalization function. When activated in the settings menu, this function scales the BBP values from -1 to +1. This means that BBP values are adjusted to fit within a standardized range, making it easier for traders to compare sentiment across different timeframes or assets. Normalization is particularly valuable for identifying extreme sentiment conditions and potential reversals.
-- Moving Average : To provide additional context and smooth out BBP fluctuations, the indicator includes an exponential moving average (EMA). The EMA of BBP is plotted on the chart as a white line. Traders can use this moving average to identify trends and potential trend reversals.
-- Fill Between Lines : The indicator visually enhances the BBP by filling the area between the BBP line and the zero line with a translucent color. This fill helps traders visualize the strength and duration of bullish or bearish sentiment.
Interpretation:
-- BBP Line : Traders can assess the raw BBP line for shifts in sentiment. When the line crosses above zero, it may suggest a shift from bearish to bullish sentiment, potentially indicating a buying opportunity. Conversely, when the line crosses below zero, it may signal a shift from bullish to bearish sentiment, suggesting a potential selling opportunity.
-- Normalization Function : The optional normalization function allows traders to gauge sentiment on a standardized scale. Values above 0 indicate bullish sentiment, while values below 0 suggest bearish sentiment. The closer the values are to their polar ends (-1 or +1), the stronger the sentiment.
-- Moving Average : The EMA of BBP helps identify trends. When BBP crosses above the EMA, it may indicate a strengthening bullish trend, while a crossover below the EMA may suggest a bearish trend.
Customization:
The NBBP indicator provides traders with flexibility through customizable settings. Users can adjust the BBP length, EMA length, and choose to activate or deactivate the normalization function based on their trading preferences and strategy.
Limitations:
The NBBP indicator is most effective when used in conjunction with other technical analysis tools and market context. Traders should consider multiple factors when making trading decisions.
Normalization function results may vary depending on the chosen length and market conditions. If the desired result is not achieved through default settings, try changing timeframes or toggling on/off the normalization function. Users should exercise caution and combine it with other indicators and analysis techniques.
In conclusion, the NBBP indicator is a versatile tool that empowers traders to assess market sentiment, identify potential reversals, and follow trends. Its intuitive visualizations, normalization function, and customizable settings make it a valuable addition to any trader's toolkit.
Colored VWAP and BarcolorThis indicator plots the Volume Weighted Average Price (VWAP) as well as changes the bar color if the current price is above or below VWAP, for quick visual reference.
Background Information
Straight from TradingView, "Volume Weighted Average Price (VWAP) is a technical analysis tool used to measure the average price weighted by volume. VWAP is typically used with intraday charts as a way to determine the general direction of intraday prices. It's similar to a moving average in that when price is above VWAP, prices are rising and when price is below VWAP, prices are falling. VWAP is primarily used by technical analysts to identify market trend."
About the Indicator
This indicator changes the VWAP line color and bar color based on the current price.
Bar Color
Bullish Up Candle Color = Current price is above VWAP and the close of the candle was greater than the open.
Bullish Down Candle Color = Current price is above VWAP and the close of the candle was less than the open.
Bearish Up Candle Color = Current price is below VWAP and the close of the candle was greater than the open.
Bearish Down Candle Color = Current price is below VWAP and the close of the candle was less than the open.

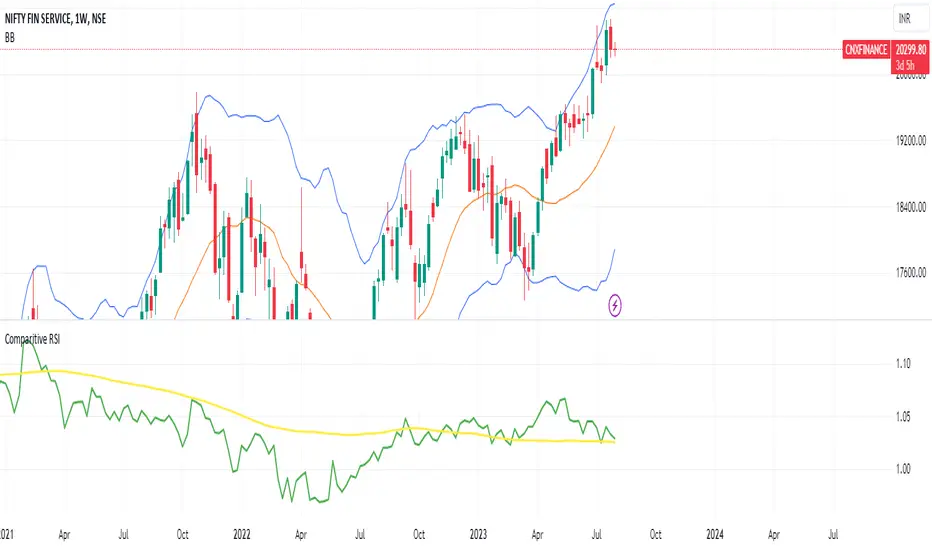
Comparative Relative StrengthIn Comparative RSI We need to Use weekly timeframe
Comparative Symbol should be Nifty and CRS moving average 100.
If the Moving avg is above the 100 period Comparative Symbol that means the stock is outperforming benchmark indices and can make position in that stock and hold till it goes below Comparative Symbol on weekly basis
All Candlestick Patterns Screener [By MUQWISHI]▋ INTRODUCTION :
The Candlestick Patterns Screener has been designed to offer an advanced monitoring solution for up to 40 symbols. Utilizing a log screener style, it efficiently gathers information on confirmed candlestick pattern occurrences and presents it in an organized table. This table includes essential details such as the symbol name, signal price, and the corresponding candlestick pattern name.
_______________________
▋ OVERVIEW:
_______________________
▋ CREDIT:
Credit to public technical “*All Candlestick Patterns*” indicator.
_______________________
▋ USAGE:
_______________________
▋ Final Comments:
For best performance, add the Candlestick Patterns Screener on active symbol chart like QQQ, SPY, AAPL, BTCUSDT, ES, EURUSD or …etc.
Candlestick patterns are not a major concept to build a trading decision.
Personally, I see candlestick patterns as a means to comprehend the psychology of the market, and help to follow the price action.
Please let me know if you have any questions.
Thank you.

Bull / Bear Market RegimeBull / Bear Market Regime
Instructions:
- A simple risk on or risk off indicator based on CBOE's Implied Correlation and VIX to highlight and indicate Bull / Bear Markets. To be used with the S&P500 index as that's the source from where the CBOE calculates and measures implied volatility & implied correlation. Can also be used with the other indices such as: Dow Jones, S&P 500, Nasdaq, & Nasdaq100, & Index ETF's such as DIA, SPY, QQQ, etc.
- Know the active regime, see the larger picture using the Daily or Weekly view, and visualize the current "Risk On (Bull) or Risk Off (Bear)" environment.
Description:
- Risk On and Risk Off simplified & visualized. Know if we are in a RISK ON or RISK OFF environment (Bull or Bear Market). (Absolute bottoms and tops will occur BEFORE a Risk On (Bull Market) or Risk Off (Bear Market) environment is confirmed!) This indicator is not meant to bottom tick or uptick market price action, but to show the active regime.
- Green: Bull Market, Risk On, low volatility, and low risk.
- Red: Bear Market, Risk Off, high volatility, and higher risk.
Buy & Sell Indicators (DAILY time frame)
- Nothing is 100% guaranteed! Can be used for short to medium term trades at the users discretion in BEAR MARKETS!!
- These signals are meant to be used during a RISK OFF / BEAR MARKET environment that tends to be accompanied with high volatility. A Risk on / Bull Market environment tends to have low volatility and endless rallies, so the signals will differ and in most instances not apply for Bull market / Risk on regime.
- The SELL signal will more often than not signal that a pullback is near in a BULL market and that a BMR-Bear Market Rally is almost over in a BEAR market.
- The BUY signal will have far more accuracy in a BEAR market-high volatility environment and can Identify short-term and major bottoms.
Always use proper sizing and risk management!

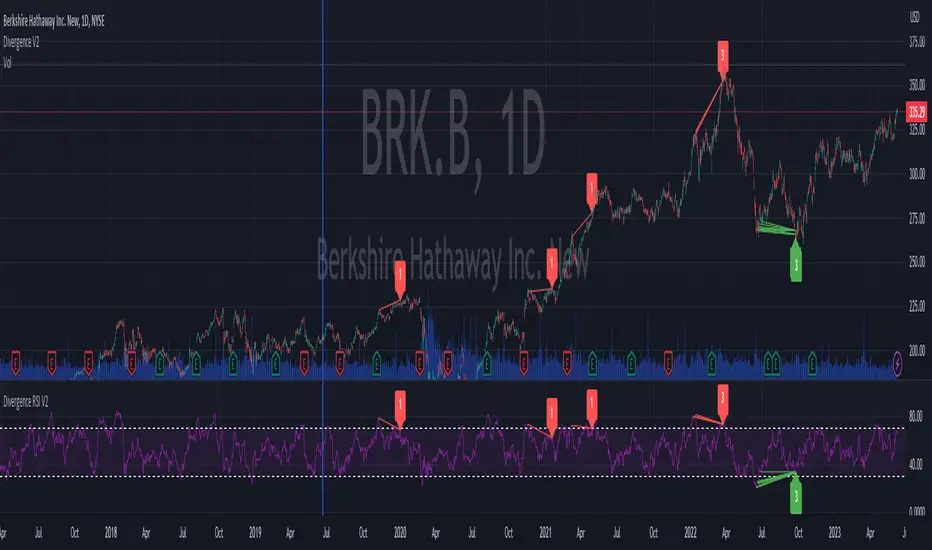
Divergence RSI V2This indicator is based on the concept of divergence. I recommend that you find out and study about this yourself as the concept of divergence will not be explained in depth in this description.
This indicator will show divergences between the asset price and the RSI oscillator. The indicator will look for divergent points between the rising highs and falling lows of the asset; and the rising lows and falling highs of the RSI.
The trend of the asset tends to follow the behavior of the oscillator when a divergence occurs. So if we find a divergence between the two, the price of the asset is likely to follow the trend of the oscillator.
This indicator looks for these types of divergences and will show (based on the RSI) if there is a bullish or bearish divergence.
If it is bullish, it will show a line joining those points in green and if it is bearish in red. In addition, it will show a label where you can see the number of occurrences that have been found from a certain point to another.
Note: this indicator can be complemented with the “Divergence V2” indicator which is also found in my library.
Settings
Backtesting Bars : is the number of bars back that the indicator will check. No more than 1000 is recommended as this will slow down the search.
Tolerance: number of times a divergent line can cross a bar. If you place 0, no bar can be crossed by a diverging line.
Min Bars To detect: will only search for divergences (or lines) that have the minimum number of bars selected in this option. Default option is 30.
Min Bars To detect: it will only search for divergences (or lines) that have the maximum number of bars selected in this option. Default option is 100.
Source Highs: The high points will be based on the close of each bar. You can use as another alternative.
Source Lows: The low points will be based on the close of each bar. You can use as another alternative.
Use squeeze parameter: only look for divergences (bullish or bearish) at times when such an indicator is in favor of the trend or coincides with the corresponding RSI divergence.
Divergence V2This indicator is based on the concept of divergence. I recommend that you find out and study about this yourself as the concept of divergence will not be explained in depth in this description.
This indicator will show divergences between the asset price and the RSI oscillator. The indicator will look for divergent points between the rising highs and falling lows of the asset; and the rising lows and falling highs of the RSI.
The trend of the asset tends to follow the behavior of the oscillator when a divergence occurs. So if we find a divergence between the two, the price of the asset is likely to follow the trend of the oscillator.
This indicator looks for these types of divergences and will show (based on the RSI) if there is a bullish or bearish divergence.
If it is bullish, it will show a line joining those points in green and if it is bearish in red. In addition, it will show a label where you can see the number of occurrences that have been found from a certain point to another.
Note: this indicator can be complemented with the “Divergence RSI V2” indicator which is also found in my library.
Settings
Backtesting Bars: is the number of bars back that the indicator will check. No more than 1000 is recommended as this will slow down the search.
Tolerance: number of times a divergent line can cross a bar. If you place 0, no bar can be crossed by a diverging line.
Min Bars To detect: will only search for divergences (or lines) that have the minimum number of bars selected in this option. Default option is 30.
Min Bars To detect: it will only search for divergences (or lines) that have the maximum number of bars selected in this option. Default option is 100.
Source Highs: The high points will be based on the close of each bar. You can use as another alternative.
Source Lows: The low points will be based on the close of each bar. You can use as another alternative.
Use squeeze parameter : only look for divergences (bullish or bearish) at times when such an indicator is in favor of the trend or coincides with the corresponding RSI divergence.

Broadview Dominance SuiteIntroducing the revolutionary Broadview Dominance Suite, a culmination of scientific precision and astute mathematical finance, designed to provide traders with unparalleled insights into market dynamics and the balance of power. This suite leverages a comprehensive set of seven distinct moving averages, including the Simple Moving Average (SMA), Exponential Moving Average (EMA), Hull Moving Average (HMA), Weighted Moving Average (WMA), Volume Weighted Moving Average (VWMA), Triple Exponential Moving Average (TEMA), and Least Squares Moving Average (LSMA). Through the combination of these moving averages, the Broadview Dominance Suite offers traders an authoritative perspective on the control exerted by market participants over a given period.
At the heart of the Broadview Dominance Suite lies the concept of the balance of power, a pivotal determinant of market dynamics. The balance of power refers to the tug-of-war between buyers (bulls) and sellers (bears) within the market. By analyzing the relationship between the market participants, the suite allows traders to identify and comprehend who holds control over a specific timeframe.
The seven different types of moving averages employed in the Broadview Dominance Suite contribute to an in-depth assessment of market dominance. Each moving average possesses unique characteristics that facilitate a comprehensive evaluation of the balance of power. Let's delve into the moving averages included in this suite and their respective properties:
Simple Moving Average (SMA): The SMA, known for its simplicity, calculates the average price over a specified period. When applied to the balance of power, the SMA provides a smoothed line that highlights overall price trends. Its straightforward nature allows for a clear interpretation of the dominant market forces.
Exponential Moving Average (EMA): The EMA assigns more weight to recent prices, making it highly responsive to short-term price movements. By incorporating the EMA into the balance of power analysis, traders can identify potential trend reversals and shifts in market control with increased accuracy.
Hull Moving Average (HMA): The HMA employs weighted moving averages and a square root function to reduce lag and noise. This results in a smoother line that closely aligns with current price action. When assessing the balance of power, the HMA enables traders to discern precise trend indications, minimizing false signals and providing a clearer understanding of market dominance.
Weighted Moving Average (WMA): The WMA assigns varying weights to different price points within the selected period, placing greater emphasis on recent data. This feature allows the WMA to be more sensitive to recent price changes. When utilized in the analysis of the balance of power, the WMA excels at detecting short-term shifts in market control and identifying periods of heightened buying or selling pressure.
Volume Weighted Moving Average (VWMA): The VWMA incorporates trading volume into its calculation, highlighting the importance of volume in determining market dynamics. By integrating volume data, the VWMA offers a more comprehensive understanding of price levels where significant buying or selling activity occurs. In the context of the balance of power, the VWMA provides valuable insights into the intensity of market control exerted by the bulls or bears.
Triple Exponential Moving Average (TEMA): The TEMA employs multiple exponential smoothing techniques to reduce lag and enhance responsiveness. It excels at capturing short-term price movements and potential trend reversals. By incorporating the TEMA into the analysis of the balance of power, traders can gain a deeper understanding of swift shifts in market control, allowing for timely decision-making.
Least Squares Moving Average (LSMA): The LSMA minimizes the sum of squared differences between the moving average and the actual price, resulting in a curve that closely fits the price data. When applied to the balance of power, the LSMA provides a smooth line that effectively captures significant price trends. Its ability to filter out noise ensures a clearer representation of dominant market forces.
By combining these seven moving averages within the Broadview Dominance Suite, traders gain an authoritative assessment of market control. The interplay between these moving averages presents a nuanced and multi-faceted perspective on the balance of power. When a line falls below the center line, it signifies the market is under the control of the bears, indicating a dominance of selling pressure. Conversely, when the lines rise above the center line, it suggests the market is controlled by the bulls, with buying pressure prevailing.

Balance of Force (BOF)The script "Balance of Force" is an indicator that aims to provide insight into the bullish and bearish forces present in the market by analyzing the relationship between bullish and bearish true ranges. The indicator first calculates the bearish and bullish true ranges by taking the absolute difference between the open and close prices for each period and summing these values over a user-specified length. It then calculates the ratio of the bullish true range to the bearish true range and takes the natural logarithm of this value, resulting in the "bullish-bearish ratio".
The script then calculates the standard deviation of this ratio over a user-specified length to create a measure of volatility. Using this deviation and the dominant cycle, it then applies an exponential moving average to smooth the ratio. The indicator plots the smoothed ratio, the raw ratio, and the deviation of the ratio multiplied by 1, 2 and 3 in addition to filling the area between the deviation multiplied by 3 and the log(1) with red and green. The user can use the indicator to identify potential bullish or bearish market conditions by analyzing the relationship between the smoothed ratio and the log(1) and the deviation of the ratio.

Rotational Gravity OscillatorMade using elements from two Cheatcountry scripts:
Includes a Bollinger Band for bounds that forms a trend follower based on the 0 point.
Includes CheatCountry color code signals, different color scheme. Bright colors are strong signals, ark are weak, green bull, red bear, the basics.
Switches for Bollinger Band color codes, which can actually be useful signals.
This oscillator can be used for divergences, trends, signal strength, confirmation, volatility readings, you name it.
It is a comparative oscillator, that compares adaptively smoothed, weighted modified Change of Gravity oscillators between 2 symbols and multiple lengths to determine directional momentum as one asset compares to another.
The default uses the Crypto TOTAL market cap to help trade cryptocurrencies. You will notice that BTC will give sell signals in uptrends at times. That is because it is being compared to an index of the total Crypto market cap, and since alt-coins move faster, BTC will lag behind this index.
Give CheatCountry a follow, hes one of the MVPs of Tradingview Pinescripters, constantly giving us access to novel new concepts as they are published by professionals.

RSI Overbought/Oversold + Divergence IndicatorDESCRIPTION:
This script combines the Relative Strength Index ( RSI ), Moving Average and Divergence indicator to make a better decision when to enter or exit a trade.
- The Moving Average line (MA) has been made hidden by default but enhanced with an RSIMA cloud.
- When the RSI is above the selected MA it turns into green and when the RSI is below the select MA it turns into red.
- When the RSI is moving into the Overbought or Oversold area, some highlighted areas will appear.
- When some divergences or hidden divergences are detected an extra indication will be highlighted.
- When the divergence appear in the Overbought or Oversold area the more weight it give to make a decision.
- The same color pallet has been used as the default candlestick colors so it looks familiar.
HOW TO USE:
The prerequisite is that we have some knowledge about the Elliot Wave Theory, the Fibonacci Retracement and the Fibonacci Extension tools.
Wave 1
(1) When we receive some buy signals we wait until we receive some extra indications.
(2) On the RSI Overbought/Oversold + Divergence Indicator we can see a Bullish Divergence and our RSI is changing from red to green ( RSI is higher then the MA).
(3) If we are getting here into the trade then we need to use a stop loss. We put our stop loss 1 a 2 pips just below the lowest wick. We also invest maximum 50% of the total amount we want to invest.
Wave 2
(4) Now we wait until we see a clear reversal and here we starting to use the Fibonacci Retracement tool. We draw a line from the lowest point of wave(1) till the highest point of wave (1). When we are retraced till the 0.618 fib also called the golden ratio we check again the RSI Overbought/Oversold + Divergence Indicator. When we see a reversal we do our second buy. We set again a stop loss just below the lowest wick (this is the yellow line on the chart). We also move the stop loss we have set in step (3) to this level.
Wave 3
(5) To identify how far the uptrend can go we need to use the Fibonacci Extension tool. We draw a line from the lowest point of wave(1) till the highest point of wave (1) and draw it back to the lowest point of wave (2). Wave (3) is most of the time the longest wave and can go till it has reached the 1.618 or 2.618 fib. On the 1.618 we can take some profit. If we don't want to sell we move our stop loss to the 1 fib line (yellow line on the chart).
(6) We wait until we see a clear reversal on the Overbought/Oversold + Divergence Indicator and sell 33% to 50% of our investment.
Wave 4
(7) Now we wait again until we see a clear reversal and here we starting to use the Fibonacci Retracement tool. We draw a line from the lowest point of wave(2) till the highest point of wave (3). When we are retraced till the 0.618 fib also called the golden ratio we check again the RSI Overbought/Oversold + Divergence Indicator. When we see a reversal we buy again. We set again a stop loss just below the lowest wick (this is the yellow line on the chart).
(8) If we bought at the first reversal ours stop los was triggered (9) and we got out of the trade.
(9) If we did not bought at step (7) because our candle did not hit the 0.618 fib or we got stopped out of the trade we buy again at the reversal.
Wave 5
(10) To identify how far the uptrend can go we need to use the Fibonacci Extension tool. We draw a line from the lowest point of wave(2) till the highest point of wave (3) and draw it back to the lowest point of wave (4). Most of the time wave 5 goes up till it has reached the 1 fib. And that is the point where we got out of the trade with all of our investment. In this trade we got out of the trade a bit earlier. We received the sell signals and got a reversal on the Overbought/Oversold + Divergence Indicator.
We are hoping you learned something so you can make better decisions when to get into or out of a trade.
If you have any question just drop it into the comments below.
FEATURES:
• You can show/hide the RSI .
• You can show/hide the MA.
• You can show/hide the lRSIMA cloud.
• You can show/hide the Stoch RSI cloud.
• You can show/hide and adjust the Overbought and Oversold zones.
• You can show/hide and adjust the Overbought Extended and Oversold Extended zones.
• You can show/hide the Overbought and Oversold highlighted zones.
• Etc...
HOW TO GET ACCESS TO THE SCRIPT:
• Favorite the script and add it to your chart.
REMARKS:
• This advice is NOT financial advice.
• We do not provide personal investment advice and we are not a qualified licensed investment advisor.
• All information found here, including any ideas, opinions, views, predictions, forecasts, commentaries, suggestions, or stock picks, expressed or implied herein, are for informational, entertainment or educational purposes only and should not be construed as personal investment advice.
• We will not and cannot be held liable for any actions you take as a result of anything you read here.
• We only provide this information to help you make a better decision.
• While the information provided is believed to be accurate, it may include errors or inaccuracies.
Good Luck and have fun,
The CryptoSignalScanner Team

The Ganesh TrendThe Ganesh Trend is an indicator developed by Ganesh to help Traders to identify potential trend showing candle .This indicator identifies bullish and bearish candle with some specific rules. This gives fair idea of direction of market .It is very helpful if you use it on Nifty 50 index . Candlestick developed by me is my original work . It is very helpful for new traders looking for proper entry and exit . It has stop loss and target as well . red dot shows the stop loss and green dot shows the target . taking 2-3 trades a day is good . Thank You . NSE:NIFTY

Quantum CDV HistogramThis script is an addition to Fixed Quantum Cdv.
It shows vector cdv ratio in columns.
You can select the length as an input to how many bars to look back for the whole calculation.
The green bars represent the bullish values and the red bars the bearish values.
The green line represents an ema of the bullish value and the red line the ema of the bearish value.
The momentum ema (in purple) represent the cdv ratio (bullish - bearish).
When the momentum ema is at 100% or more it’s a good sell opportunity and when the momentum ema is at or under 100% it’s a good buy opportunity. It is not financial advise. Make sure to make your own analysis. This script help to make entries, but do not enter positions only based on this signal.
In the inputs you can select the emas that you want to display on your histogram.
The original script is the Cumulative Delta Volume by LonesomeTheBlue.

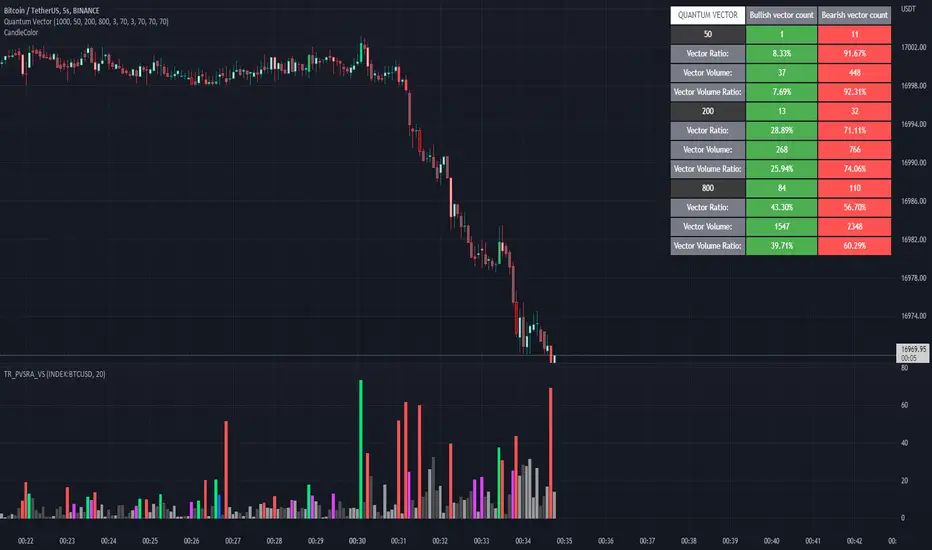
Quantum Vector AlertsIts the part 2 of Multiple Indicators 50EMA Cross Alerts.
Its more suitable for the seconds chart. Beside, you can use it in higher timeframe.
The input bars length is the sample size that the code will use to trigger all alert. 20 mean 20 bar after the current candle.
When you activate volume alert you can select an amount of volume that when volume cross it you will be notified. The volume of every bar is displayed in the screener below volume.
In the section percentage vector counting the script do the sum of the red vector and green vector and give a ratio. In bullish vector count percentage for alert, you can select the percentage difference that you want to receive an alert. If your sample have 3 red vectors and 7 green vectors you will receive an alert saying that there is an imbalance of 70% showing more green vectors.
You can select a variant of percentage vector. The variant will do a summation of volume. If 1 vector candle is the size of the 3 other vector, they will have the same ponderation.
Normal alert counting count the number of vectors in the bars length. You can count the red and green candle only or add the blue and violet.
Bullish vector count will show a notification when the number of green candle will appear on the chart in the selected length. The same process is valid for bearish vector count. For example, if you want 3 bullish candle in 20 bar. You select bars length 20 and bullish vector count 3.
These alerts are suitable to the hybrid system. Thanks to our teacher Trader Reality and to all the member that contribute to this great discord community.
[TTI] Ned Davis 3 day Price Thrust IndicatorThe NedDavis 3 Day Price Thrust Indicator
HISTORY AND CREDITS –––––––––––––––––––––––––––––––––––––––––––––––––––––––
The indicator is inspired by studies from Ned Davis' NDR Institutional Service. I have shared before the backtest of this indicator, and now have coded it for TradingView so that you can have it on your charts.
Link to idea here:
WHAT IT DOES ––––––––––––––––––––––––––––––––––––––––––––––––––––––––––––––
Thrusts occur when the S&P 500 rises at least 1.5% for one day, at least 1.15% for a second day, and at least 1.5% on the third day. The record since 1970 is perfect one year later. However, the prior 18 cases, ending in 1938, only show 11 out of 18 profitable one year later.
HOW TO USE IT –––––––––––––––––––––––––––––––––––––––––––––––––––––––––––––
I use the indicator as a gauge tool, in other words it is a piece of the puzzle to justify bullish or bearish trades. I put this type of analysis in my secondary tools that give me additional confidence for market direction and aggressiveness in my trading

Cheat Code's RedemptionWELCOME TO THE CHEAT CODE REDEMPTION PACK!!!!
I want to take a deep dive into what this indicator consists of and how you can use it to improve your trading strategy.
-What does the CCR consist of?
The Oscillator:
The oscillator is a combination of a true strength index sampled from on-balance volume and a regular RSI at default settings. The reason I added the on-balance volume is that it does not tend to remain at overbought or oversold conditions as traditional momentum oscillators do.
The Histogram:
The histogram is copied to a tee from the MACD histogram, the only difference here is that I extended the moving averages to depict a special pairing; the ema55 slow and ema21 fast. I then converted it into another true strength index, as the calculations fit all time frames.
The Divergences:
The divergences of an indicator can be extremely useful in catching scalp opportunities, a DARK RED/GREEN represents a REGULAR divergence, while a SALMON/LIGHT GREEN color represents a HIDDEN divergence.
The moving average:
The moving average built into this indicator is depicted as an aqua or yellow line, when the oscillator is moving in an uptrend, the moving average will appear aqua, when the oscillator is in a downtrend it will appear yellow. Use this as confirmation bias or as the third derivative of market position.
Oscillator Colors:
The Oscillator color is an important thesis of this indicator. When the line is green, it means the market is effectively in an uptrend, when it is red, it means the market is in a downtrend. Use this to prevent longing in a serious downtrend and vice versa.
If you have any questions regarding the indicator(s), feel free to reach out to me in the comments or through Direct Message!!!
Safe Trading, Don't get Rekt
- CheatCode1 <3
