RSI Regime: Continuation vs Reversal Indicator Description: RSI Regime (Continuation vs. Reversal)
This indicator uses the standard Relative Strength Index (RSI) to analyze market momentum and categorize it into three "regimes." Its primary goal is to help you determine if an overbought (OB) or oversold (OS) signal is likely to be a continuation of the current trend or a reversal point.
It also identifies "Fast Trend Starts," which are exceptionally fast and powerful moves from one extreme to the other.
Core Features & How to Read It
1. The Three RSI Regimes (Background Color) The script calculates a moving average (SMA) of the RSI to determine the dominant medium-term momentum. This is shown as the background color:
Bull Regime (Green Background): The RSI's average is high (e.g., above 55). The market is in a clear uptrend.
Bear Regime (Red Background): The RSI's average is low (e.g., below 45). The market is in a clear downtrend.
Range Regime (Orange Background): The RSI's average is in the middle. The market is consolidating or undecided.
2. Overbought (OB) & Oversold (OS) Signals
When the RSI line crosses into the overbought (e.g., >70) or oversold (e.g., <30) zones, the indicator generates one of two types of signals:
A) Continuation Signals (Small Triangles: ►)
These signals suggest an OB/OS reading is just a "pause" and the main trend will likely continue.
Orange ► (at the top): Appears when RSI becomes overbought while the market is already in a Bull Regime. This suggests the uptrend is strong, and this OB signal may not lead to a big drop.
Teal ► (at the bottom): Appears when RSI becomes oversold while the market is already in a Bear Regime. This suggests the downtrend is strong, and this OS signal may not lead to a big bounce.
(Note: An optional Price EMA filter can be enabled to make these signals more strict.)
B) Reversal Signals (Small Labels: "OS→>50" / "OB→<50")
These labels appear after an OB/OS signal to confirm that a reversal has actually occurred.
"OS→>50 Reversal" (Aqua Label): Appears if the RSI becomes oversold and then recovers back above the 50 midline within a set number of bars. This confirms the oversold dip was a reversal point.
"OB→<50 Reversal" (Orange Label): Appears if the RSI becomes overbought and then falls back below the 50 midline within a set number of bars. This confirms the overbought peak was a reversal point.
3. "Fast Trend Starts" (Large Labels)
This is a unique feature that identifies the fastest percentile of market moves. It measures how many bars it takes for the RSI to go from one extreme to the other and flags when a move is in the top 5% (default) of all historical moves.
"Long Pullbacks (Fast OS→BullRange)" (Large Green Label): This powerful signal appears when the RSI moves from oversold (<30) all the way up to the bull range (>60) exceptionally fast. It identifies a very strong, fast, and decisive bounce that could signal the start of a new uptrend.
"Short Pumps (Fast OB→BearRange)" (Large Red Label): This appears when the RSI moves from overbought (>70) all the way down to the bear range (<40) exceptionally fast. It identifies a very sharp, fast rejection or "pump-and-dump" that could signal the start of a new downtrend.
Key User Inputs
RSI Length (14): The lookback period for the main RSI calculation.
OB (70) / OS (30): The standard overbought and oversold levels.
Bull/Bear Range Threshold (60/40): These are the levels used to confirm the "Fast Trend Starts." They are separate from the OB/OS levels.
RSI Regime SMA Length (21): The lookback period for the moving average that determines the background regime.
Use Price EMA filter (true): If checked, the small "Continuation" triangles will only appear if the price is also above (for bulls) or below (for bears) its own 50-period EMA.
Fastest X% duration (5.0): This sets the percentile for the "Fast Trend Start" labels. 5.0 means it only flags moves that are in the fastest 5% of all recorded moves.
מתנדים ממורכזים

Alpha-Weighted RSIDescription:
The Alpha-Weighted RSI is a next-generation momentum oscillator that redefines the classic RSI by incorporating the mathematical principles of Lévy Flight. This advanced adaptation applies non-linear weighting to price changes, making the indicator more sensitive to significant market moves and less reactive to minor noise. It is designed for traders seeking a clearer, more powerful view of momentum and potential reversal zones.
🔍 Key Features & Innovations:
Lévy Flight Alpha Weighting: At the core of this indicator is the Alpha parameter (1.0-2.0), which controls the sensitivity to price changes.
Lower Alpha (e.g., 1.2): Makes the indicator highly responsive to recent price movements, ideal for capturing early trend shifts.
Higher Alpha (e.g., 1.8): Creates a smoother, more conservative output that filters out noise, focusing on stronger momentum.
Customizable Smoothing: The raw Lévy-RSI is smoothed by a user-selectable moving average (8 MA types supported: SMA, EMA, SMMA, etc.), allowing for further customization of responsiveness.
Intuitive Centered Oscillator: The RSI is centered around a zero line, providing a clean visual separation between bullish and bearish territory.
Dynamic Gradient Zones: Subtle, colour coded gradient fills in the overbought (>+25) and oversold (<-25) regions enhance visual clarity without cluttering the chart.
Modern Histogram Display: Momentum is plotted as a sleek histogram that changes color between bright cyan (bullish) and magenta (bearish) based on its position relative to the zero line.
🎯 How to Use & Interpret:
Zero-Line Crossovers: The most basic signals. A crossover above the zero line indicates building bullish momentum, while a crossover below suggests growing bearish momentum.
Overbought/Oversold Levels: Use the +25/-25 and +35/-35 levels as dynamic zones. A reading above +25 suggests strong bullish momentum (overbought), while a reading below -25 indicates strong bearish momentum (oversold).
Divergence Detection: Look for divergences between the Alpha-Weighted RSI and price action. For example, if price makes a new low but the RSI forms a higher low, it can signal a potential bullish reversal.
Alpha Tuning: Adjust the Alpha parameter to match market volatility. In choppy markets, increase alpha to reduce noise. In trending markets, decrease alpha to become more responsive.
⚙️ Input Parameters:
RSI Settings: Standard RSI inputs for Length and Calculation Source.
Lévy Flight Settings: The crucial Alpha factor for response control.
MA Settings: MA Type and MA Length for smoothing the final output.
By applying Lévy Flight dynamics, this indicator offers a nuanced perspective on momentum, helping you stay ahead of the curve. Feedback is always welcome!

Adaptive EMA CrossoverIndicator Name: Adaptive EMA Crossover
Description:
The Adaptive EMA Crossover is a sleek, visual tool designed to help traders identify trend direction and potential entry/exit points with clarity. By employing two Exponential Moving Averages (EMAs) with dynamic coloring, it cuts through the noise of the chart, allowing you to focus on high-probability signals.
🔍 Key Features:
Dual EMA System: Utilizes a fast and a slow EMA to gauge market momentum. The default settings are 12 (fast) and 21 (slow) periods, which can be fully customized.
Adaptive Visuals: Both EMAs change color simultaneously to reflect the dominant trend.
🟢 Bright Turquoise: Indicates an Uptrend (Fast EMA >= Slow EMA).
🔴 Bright Pink: Indicates a Downtrend (Fast EMA < Slow EMA).
Clear Crossover Signals: Prominent dots directly on the chart mark the exact moment a crossover occurs.
Turquoise Dot: A Bullish Crossover signal (Fast EMA crosses above Slow EMA).
Pink Dot: A Bearish Crossover signal (Fast EMA crosses below Slow EMA).
Integrated Alerts: Never miss a trading opportunity! Built-in alert conditions notify you instantly for both bullish and bearish crossovers.
🎯 How to Use:
Trend Identification: The primary colors of the EMAs give an immediate sense of the trend. Trade in the direction of the trend for higher-probability setups.
Signal Confirmation: Use the crossover dots as potential triggers for entry or exit. A turquoise dot in a rising market can signal a buy opportunity, while a pink dot in a falling market can signal a sell or short opportunity.
Combination with Other Tools: For best results, combine this indicator with other forms of analysis like support/resistance levels or volume confirmation to filter out false signals.
⚙️ Inputs:
EMA Small: Period for the faster-moving average (default: 12).
EMA Big: Period for the slower-moving average (default: 21).
This is my first published indicator. I welcome all feedback and suggestions for improvement! Happy Trading!

Force DashboardScalping Dashboard - Complete User Guide
Overview
This scalping system consists of two complementary TradingView indicators designed for intraday trading with no overnight holds:
Force Dashboard - Single-row table showing real-time market bias and entry signals
Large Order Detection - Visual diamonds showing institutional order flow
Together, they provide a complete at-a-glance view of market conditions optimized for quick entries and exits.
Recommended Timeframes
Primary Scalping Timeframes
1-minute chart: Ultra-fast scalps (30 seconds - 3 minutes hold time)
2-minute chart: Quick scalps (2-5 minutes hold time)
5-minute chart: Standard scalps (5-15 minutes hold time)
Best Practices
Use 1-2 minute for highly liquid instruments (ES, NQ, major forex pairs)
Use 5-minute for less liquid markets or if you prefer fewer signals
Never hold past the last hour of trading to avoid overnight risk
Set hard stop times (e.g., exit all positions by 3:45 PM EST)
Dashboard Components Explained
Core Indicators (Circles ●)
MACD (5/13/5)
Green ● = Bullish momentum (MACD histogram positive)
Red ● = Bearish momentum (MACD histogram negative)
Gray ● = No clear momentum
Use: Confirms trend direction and momentum shifts
EMA (9/20/50)
Green ● = Price > EMA9 > EMA20 (uptrend)
Red ● = Price < EMA9 < EMA20 (downtrend)
Gray ● = Choppy/sideways
Use: Identifies the immediate micro-trend
Stoch (5-period Stochastic)
Green ● = Oversold (<20) - potential reversal up
Red ● = Overbought (>80) - potential reversal down
Gray ● = Neutral zone (20-80)
Use: Spots reversal opportunities at extremes
RSI (7-period)
Green ● = Oversold (<30)
Red ● = Overbought (>70)
Gray ● = Neutral
Use: Confirms overbought/oversold conditions
CVD (Cumulative Volume Delta)
Green ● = CVD above its moving average (buying pressure)
Red ● = CVD below its moving average (selling pressure)
Gray ● = Neutral
Use: Shows overall buying vs selling pressure
ΔCVD (Delta CVD - Rate of Change)
Green ● = CVD accelerating upward (buying acceleration)
Red ● = CVD accelerating downward (selling acceleration)
Gray ● = No acceleration
Use: Detects momentum shifts in order flow
Imbal (Order Flow Imbalance)
Green ● = Buy pressure >2x sell pressure
Red ● = Sell pressure >2x buy pressure
Gray ● = Balanced
Use: Identifies extreme one-sided order flow
Vol (Volume Strength)
Green ● = Volume >1.5x average (strong interest)
Red ● = Volume <0.7x average (low interest)
Gray ● = Normal volume
Yellow background = Volume surge (>2x average) - BIG MOVE ALERT
Use: Confirms conviction behind price moves
Tape (Tape Speed)
Green ● = Fast order flow (>1.3x normal)
Red ● = Slow order flow (<0.7x normal)
Gray ● = Normal speed
Yellow background = Very fast tape (>1.5x) - RAPID EXECUTION ALERT
Use: Measures urgency and speed of orders
Key Levels
Support (Supp)
Shows the nearest high-volume support level below current price
Bright Green background = Price is AT support (within 0.3%) - BOUNCE ZONE
Green background = Price above support (healthy)
Red background = Price below support (broken support, now resistance)
Resistance (Res)
Shows the nearest high-volume resistance level above current price
Bright Orange background = Price is AT resistance (within 0.3%) - REJECTION ZONE
Red background = Price below resistance (facing overhead supply)
Green background = Price above resistance (breakout)
These levels update automatically every 3 bars based on volume profile
Entry Signal Components
Score
Displays format: "6L" (6 long indicators) or "4S" (4 short indicators)
Bright Green = 6-7 indicators aligned for long
Light Green = 5 indicators aligned for long
Yellow = 4 indicators aligned (weaker setup)
Gray = No alignment
Red/Orange colors = Same scale for short setups
Score of 5+ indicates high-probability setup
SCALP (Main Entry Signal)
BRIGHT GREEN "LONG" = High-quality long scalp (Score 5+)
Green "LONG" = Decent long scalp (Score 4)
BRIGHT ORANGE "SHORT" = High-quality short scalp (Score 5+)
Red "SHORT" = Decent short scalp (Score 4)
Gray "WAIT" = No clear setup - STAY OUT
Entry Strategies
Strategy 1: High-Probability Scalps (Conservative)
When to Enter:
SCALP column shows BRIGHT GREEN "LONG" or BRIGHT ORANGE "SHORT"
Score is 5 or higher
Vol or Tape has yellow background (volume surge)
Example Long Setup:
SCALP = BRIGHT GREEN "LONG"
Score = 6L
Vol = Yellow background
Price AT Support (bright green Supp cell)
EMA, MACD, CVD, ΔCVD, Imbal all green
Entry: Enter immediately on next candle
Target: 0.5-1% move or resistance level
Stop: Below support or -0.3%
Hold Time: 2-10 minutes
Strategy 2: Momentum Scalps (Aggressive)
When to Enter:
Tape has yellow background (fast tape)
Vol has yellow background (volume surge)
ΔCVD is green (for longs) or red (for shorts)
Imbal shows strong imbalance in your direction
Score is 4+
Example Short Setup:
Tape & Vol = Yellow backgrounds
ΔCVD = Red, Imbal = Red
Price AT Resistance (bright orange)
Score = 5S
Entry: Enter immediately
Target: Quick 0.3-0.7% move
Stop: Tight -0.2%
Hold Time: 1-5 minutes
Strategy 3: Reversal Scalps (Mean Reversion)
When to Enter:
Stoch shows oversold (green) or overbought (red)
RSI confirms the extreme
Price is AT Support (for longs) or AT Resistance (for shorts)
ΔCVD and Imbal start reversing direction
Score is 4+
Example Long Setup:
Stoch = Green (oversold)
RSI = Green (oversold)
Supp = Bright green (at support)
ΔCVD turns green
Imbal turns green
Score = 4L or 5L
Entry: Wait for confirmation candle
Target: Move back to EMA9 or mid-range
Stop: Below the low
Hold Time: 3-8 minutes
Large Order Detection Usage
Diamond Signals
Green diamonds below bar = Large buy orders (institutional buying)
Red diamonds above bar = Large sell orders (institutional selling)
Size matters: Larger diamonds = larger order flow
How to Use with Dashboard
Confirmation Entries
Dashboard shows "LONG" signal
Green diamond appears
Enter immediately - institutions are buying
Divergence Alerts (CAUTION)
Dashboard shows "LONG" signal
RED diamond appears (institutions selling)
DO NOT ENTER - conflicting order flow
Cluster Patterns
Multiple green diamonds in row = Strong accumulation, stay long
Multiple red diamonds in row = Strong distribution, stay short
Alternating colors = Chop, avoid trading
Risk Management Rules
Position Sizing
Risk 0.5-1% of account per scalp
Maximum 3 concurrent positions
Reduce size after 2 consecutive losses
Stop Loss Guidelines
Tight stops: 0.2-0.3% for 1-2 min charts
Standard stops: 0.3-0.5% for 5 min charts
Always use stop loss - no exceptions
Place stops below support (longs) or above resistance (shorts)
Take Profit Targets
Target 1: 0.3-0.5% (take 50% off)
Target 2: 0.7-1% (take remaining 50%)
Move stop to breakeven after Target 1 hit
Trail stop if Score remains high
Time-Based Exits
Exit immediately if:
SCALP changes from LONG/SHORT to WAIT
Score drops below 3
Large diamond appears in opposite direction
Maximum hold time: 15 minutes (even if profitable)
Hard exit time: 30 minutes before market close
Trading Sessions
Best Times to Scalp
High-Liquidity Sessions
9:30-11:00 AM EST (Market open, highest volume)
2:00-3:30 PM EST (Afternoon session, good moves)
Avoid
11:30 AM-1:30 PM EST (Lunch, low volume)
Last 30 minutes (unpredictable, don't initiate new trades)
News releases (wait 5 minutes for volatility to settle)
Common Patterns & Setups
The Perfect Storm (Highest Probability)
Score = 6L or 7L
SCALP = BRIGHT GREEN
Vol + Tape = Yellow backgrounds
Green diamond appears
Price AT Support
Win rate: ~70-80%
The Fade Setup (Counter-Trend)
Price hits resistance (bright orange)
Stoch + RSI overbought (red)
Red diamond appears
CVD starts turning red
SCALP shows "SHORT"
Win rate: ~60-70%
The Breakout Continuation
Price breaks resistance (Res turns green)
EMA, MACD green
Vol surge (yellow)
Multiple green diamonds
SCALP = "LONG"
Win rate: ~65-75%
Warning Signs - DO NOT TRADE
Red Flags
❌ SCALP shows "WAIT"
❌ Score below 3
❌ Vol and Tape both gray (no volume)
❌ Conflicting signals (dashboard says LONG but red diamonds appearing)
❌ Alternating green/red circles (choppy market)
❌ Support and Resistance very close together (tight range)
Market Conditions to Avoid
Low volume periods
Major news releases (first 5 minutes after)
First 2 minutes after market open
Wide spreads
Consecutive losing trades (take a break after 2 losses)
Quick Reference Checklist
Before Taking ANY Trade:
☑ SCALP shows LONG or SHORT (not WAIT)
☑ Score is 4 or higher
☑ Vol or Tape shows activity
☑ No conflicting diamond signals
☑ Stop loss level identified
☑ Target profit level identified
☑ Not in restricted time periods
After Entering:
☑ Set stop loss immediately
☑ Set profit targets
☑ Watch SCALP column - exit if changes to WAIT
☑ Watch for opposite-colored diamonds
☑ Move stop to breakeven after first target
☑ Exit all by market close
Advanced Tips
Scalping Psychology
Be patient: Wait for Score 5+ setups
Be decisive: When signal appears, act immediately
Be disciplined: Follow your stop loss always
Be flexible: Exit quickly if dashboard reverses
Optimization
Backtest on your specific instrument
Adjust RSI/Stoch levels for your market
Fine-tune volume thresholds
Keep a trade journal to track which setups work best
Multi-Timeframe Confirmation
Use 5-min dashboard as "trend filter"
Take 1-min trades only in direction of 5-min SCALP signal
Increases win rate by ~10-15%
Troubleshooting
Q: Dashboard shows WAIT most of the time
Normal - scalping is about patience. Quality > Quantity
3-8 good setups per day is excellent
Q: Too many false signals
Increase minimum Score requirement to 5 or 6
Only trade with volume surge (yellow backgrounds)
Add large order detection confirmation
Q: Signals too slow
You may be on too high a timeframe
Try 1-minute chart for faster signals
Ensure real-time data feed is active
Q: Support/Resistance not updating
Normal - updates every 3 bars
If completely stuck, remove and re-add indicator
Summary
This scalping system works best when:
✅ Multiple indicators align (Score 5+)
✅ Volume and tape speed confirm the move
✅ Order flow (diamonds) confirms direction
✅ Price is at key levels (support/resistance)
✅ You manage risk strictly
✅ You exit before market close
The golden rule: When SCALP says WAIT, you WAIT. Discipline beats frequency.

Squeeze Go Momentum Pro [KingThies] █ OVERVIEW
The Squeeze Momentum Pro indicator identifies volatility compression phases and breakout opportunities by comparing Bollinger Bands to Keltner Channels. When price consolidates (squeeze), the bands contract inside the channels, signaling an imminent breakout. The momentum histogram shows directional bias, helping traders anticipate which way price will move when the squeeze releases.
This indicator displays in a separate panel below the price chart, providing clear visual signals without cluttering price action.
█ KEY FEATURES
Momentum Histogram
The histogram is the primary visual element, displaying momentum strength and direction with four distinct color states:
• Dark Green (#00C853) — Strong bullish momentum that is increasing. This signals strengthening upward pressure and potential continuation.
• Light Green (#26A69A) — Bullish momentum that is decreasing. Price remains in bullish territory but upward force is weakening.
• Dark Red (#D32F2F) — Strong bearish momentum that is increasing. This signals strengthening downward pressure and potential continuation.
• Light Red (#EF5350) — Bearish momentum that is decreasing. Price remains in bearish territory but downward force is weakening.
The color intensity provides immediate feedback on momentum strength and trend health.
Squeeze State Indicator
Colored dots on the zero line communicate the current volatility state:
• Orange Dots — Squeeze is ON. Bollinger Bands have contracted inside Keltner Channels, indicating consolidation and low volatility.
A breakout is building and traders should prepare for directional movement.
• Green Dots — Squeeze is OFF. Bollinger Bands have expanded outside Keltner Channels, indicating active momentum and higher volatility.
Price is moving with conviction in the current direction.
• Gray Dots — Neutral state. The bands are transitioning between squeeze states.
Release Triangles
Triangle shapes mark the exact bar when a squeeze releases, providing precise entry timing:
• Green Triangle Up — Bullish squeeze release. The squeeze has ended with positive momentum, suggesting a long setup opportunity.
• Red Triangle Down — Bearish squeeze release. The squeeze has ended with negative momentum, suggesting a short setup opportunity.
Information Panel
A compact dashboard in the top-right corner displays real-time trading intelligence:
• Squeeze Status — Current state: ON, OFF, or NEUTRAL with color coding
• Momentum Direction — Current bias: BULL or BEAR
• Momentum Value — Precise numerical reading of momentum strength
• Trading Signal — Actionable status: LONG SETUP, SHORT SETUP, WAIT, or MONITOR
Configurable Parameters
All calculation inputs are adjustable to match your trading style and timeframe:
• BB Length — Bollinger Bands period (default: 20)
• BB StdDev — Bollinger Bands standard deviation multiplier (default: 2.0)
• KC Length — Keltner Channels period (default: 20)
• KC ATR Multiplier — Keltner Channels range multiplier (default: 1.5)
• Momentum Length — Linear regression period for momentum calculation (default: 20)
Alert System
Four alert conditions notify you of critical trading opportunities:
• Bullish Squeeze Release — Squeeze has released with bullish momentum, indicating a potential long entry
• Bearish Squeeze Release — Squeeze has released with bearish momentum, indicating a potential short entry
• Squeeze Started — Volatility compression detected, prepare for upcoming breakout
• Squeeze Ended — Volatility expansion confirmed, breakout is active
█ TRADING METHODOLOGY
The indicator follows a clear four-step process for identifying and trading squeeze breakouts:
1 - Wait for Orange Dots . When orange dots appear on the zero line, a squeeze is building. This indicates price consolidation and declining volatility.
Do not enter trades during this phase. Instead, prepare by identifying key support and resistance levels and potential breakout directions.
2 - Watch for Release Triangle . When a triangle appears, the squeeze has released and a breakout is beginning. This is your entry signal.
The triangle color (green up or red down) combined with the histogram direction indicates the breakout direction.
3 - Confirm with Histogram Direction . Check the momentum histogram for directional confirmation:
• Green histogram + green triangle up = Go long. Bullish momentum supports upward breakout.
• Red histogram + red triangle down = Go short. Bearish momentum supports downward breakout.
4 - Monitor Momentum Intensity . Stay in the trade while histogram bars maintain their dark, intense color.
When colors lighten (dark green to light green, or dark red to light red), momentum is weakening and you should consider taking profits or tightening stops.
█ INTERPRETATION GUIDE
Squeeze Detection Logic
A squeeze occurs when Bollinger Bands contract inside Keltner Channels. This happens when:
• Standard deviation of price decreases (BB narrows)
• Price consolidates within a tight range
• Volatility compresses to unsustainable levels
The orange dots signal this condition, warning traders that explosive movement is imminent.
Squeeze Release Logic
A squeeze releases when Bollinger Bands expand outside Keltner Channels. This happens when:
• Price volatility increases sharply
• Price breaks out of consolidation
• Volume typically expands (check volume separately)
The green dots and release triangles signal this condition, indicating the direction and timing of the breakout.
Momentum Reading
The histogram uses linear regression to calculate momentum relative to the midpoint of the recent range:
• Above Zero : Price is trading above the range midpoint with bullish pressure
• Below Zero : Price is trading below the range midpoint with bearish pressure
• Increasing Bars : Momentum is strengthening in the current direction (darker color)
• Decreasing Bars : Momentum is weakening in the current direction (lighter color)
█ BEST PRACTICES
• Timeframe Selection — The indicator works on all timeframes but performs best on 15-minute to daily charts.
Lower timeframes may produce more false signals due to noise.
• Confluence Trading — Combine squeeze releases with support/resistance levels, trend lines, or other indicators for higher probability setups.
• Volume Confirmation — Check that squeeze releases occur with increasing volume. Low volume breakouts are more likely to fail.
• Multiple Timeframe Analysis — Check higher timeframes for overall trend direction. Trade squeeze releases that align with the larger trend.
• Parameter Adjustment — Increase BB and KC lengths for smoother signals on higher timeframes. Decrease for more sensitive signals on lower timeframes.
█ LIMITATIONS
• The indicator does not predict breakout direction before the squeeze releases. The momentum histogram provides bias but is not definitive until the breakout occurs.
• False breakouts can occur, particularly in choppy or low-volume market conditions. Always use proper risk management and stop losses.
• The indicator works best in trending markets. In deeply ranging markets with no clear direction, squeeze signals may be less reliable.
• Momentum calculations use linear regression which can lag during extremely fast price movements. Confirm signals with price action.
█ NOTES
This implementation uses linear regression for momentum calculation rather than simple moving averages, providing more responsive and accurate directional signals. The four-color histogram system gives traders nuanced feedback on momentum strength that binary color schemes cannot provide.
The indicator automatically adjusts to any symbol and timeframe without modification, making it suitable for stocks, forex, crypto, and futures markets.
█ CREDITS
Squeeze methodology inspired by John Carter's TTM Squeeze indicator. Momentum calculation and visual design optimized for modern trading workflows.


RSI(Min-Max)RSI (Min-Max) is an enhanced version of Welles Wilder's Relative Strength Index, designed to offer greater analytical precision and dynamic insight into the behavior of the RSI within each candlestick.In addition to displaying the traditional RSI value, this script calculates the possible extreme values — the minimum and maximum RSI — based on the low and high prices of the current candle. This allows you to estimate how the RSI would react if the price moved to the extremes of the bar, providing a predictive and refined reading of momentum.

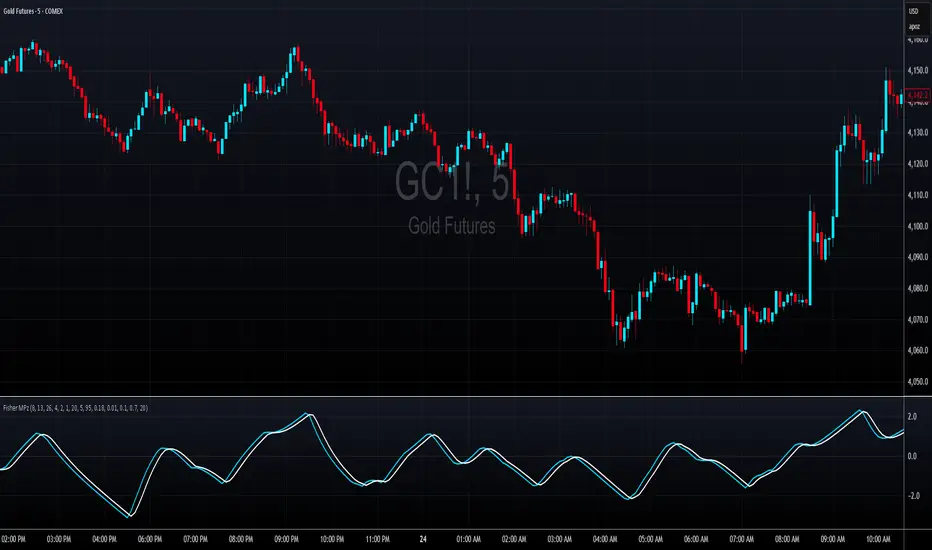
Fisher MPzFisher MPz - Multi-Period Z-Score Fisher Transform
Overview
An enhanced Fisher Transform that uses multi-period analysis and improved statistical methods to provide more reliable trading signals with the goal of fewer false positives.
Evolution Beyond Traditional Fisher Transform
While the classic Fisher Transform uses simple price normalization and basic smoothing, Fisher MPz introduces several key enhancements:
- Multi-period composite instead of single timeframe analysis
- Robust z-score normalization using median/MAD rather than mean/standard deviation
- Winsorization to handle outliers and price spikes
- Dynamic clipping that adapts to market volatility
- Kalman filtering for superior noise reduction vs. traditional EMA smoothing
These improvements result in cleaner signals, better adaptability to different market conditions, handles trending markets without over-saturation at extreme values, and reduced false signals compared to the standard Fisher Transform.
Key Features
Multi-Period Analysis
- Three Timeframe Approach: Simultaneously analyzes short (default 8), medium (default 13), and long (default 26) periods
- Weighted Composite: Combines all three periods using customizable weights for optimal signal generation
- Individual Period Display: Optional visualization of each period's Fisher Transform for deeper analysis
Advanced Statistical Methods
Robust Z-Score Calculation
- Uses median and MAD (Median Absolute Deviation) instead of mean and standard deviation
- More resistant to outliers and extreme price movements
- Provides stable normalization across varying market conditions
Winsorization
- Caps extreme price values at specified percentiles (default 5th and 95th)
- Reduces the impact of price spikes and anomalies
- Configurable lookback period for threshold calculation
Dynamic Z-Score Clipping
- Automatically adjusts clipping levels based on recent volatility
- Tighter bounds in calm markets (0.05) for precision
- Wider bounds in volatile markets (0.2) to capture significant moves
- Uses ATR-based volatility measurement
Kalman Filter Smoothing
- Optional advanced noise reduction using Kalman filtering
- Superior to traditional EMA smoothing for optimal signal extraction
- Configurable process noise (Q) and measurement noise (R) parameters
- Fallback to traditional smoothing factor available
How to Use
Basic Interpretation
- Above Zero: Bullish momentum
- Below Zero: Bearish momentum
- Extreme Values: Potential overbought/oversold conditions
- Crossovers: Entry/exit signals when composite crosses trigger line
Customizable Settings
Periods: Adjust based on your trading timeframe
- Lower values (3-10): More sensitive, suitable for scalping
- Medium values (10-20): Balanced for swing trading
- Higher values (20-50): Smoother for position trading
Weights: Customize responsiveness
- Increase short weight: More reactive to recent price changes
- Increase long weight: More stability and trend confirmation
Kalman Settings
- Lower Q (0.001-0.02): Smoother, more filtered signals
- Higher Q (0.02-0.1): More responsive to price changes
- Lower R (0.01-0.05): Trust data more, less filtering
- Higher R (0.1-1.0): More skeptical of data, more smoothing
True Strength Index with Crossovers Alerts🚀 True Strength Index (TSI) with Visual Crossover Alerts
Hey everyone! I’m sharing my customized True Strength Index (TSI) indicator, which I've boosted with clear visual signals and alert conditions based on my personal, high-probability trading strategy.
The True Strength Index is a powerful, oscillation-based momentum indicator that smooths price movements twice using Exponential Moving Averages (EMAs). This double-smoothing process helps to filter out market noise, giving you a much clearer view of momentum changes than basic indicators.
🛠️ How This Script Works
This script focuses on the crucial interaction between the TSI line and its Signal Line:
TSI Line (Blue): Tracks momentum direction and strength.
Signal Line (Red): A simple EMA of the TSI line, used to determine short-term trend shifts.
Visual Buy/Sell Signals:
To make signals impossible to miss, I've added distinct visual markers:
🟢 Green Dot: A "Buy Signal" is plotted at the bottom of the indicator pane when the TSI crosses above the Signal Line (bullish crossover).
🔴 Red Dot: A "Sell Signal" is plotted at the bottom when the TSI crosses below the Signal Line (bearish crossover).
Additionally, I've included named alertconditions so you can set up real-time notifications for these exact crossovers in the TradingView Alert system.
🧠 My Trading Logic: Combining TSI with RSI
I don't use the TSI in isolation. My favorite approach is to use this TSI indicator as a timing tool, but only when it aligns with the overall momentum context defined by the Relative Strength Index (RSI).
This is the key to my strategy:
Bullish Trade Filter: I only take a BUY signal (Green Dot) when my RSI indicator is already in a bullish territory (above 50).
Bearish Trade Filter: I only take a SELL signal (Red Dot) when my RSI indicator is already in a bearish territory (below 50).
This combination ensures you are trading with the underlying momentum trend, improving the probability of success.
⚙️ My Recommended Custom Settings
For the best results with this strategy, I recommend using the following custom settings. You can enter these values in the "Inputs" tab when adding the indicator to your chart.
1. TSI (Alerts) Settings
Long Length - 60
Higher value for smoother price change data.
Short Length -30
Medium-term smoothing for clearer momentum shifts.
Signal Length - 9
Short length for a responsive signal line.
2. Companion RSI Settings (RSI+)
RSI Length - 150
A long look-back period for highly accurate trend filtering.
MA1 Length - 60
Used for additional smoothing.
MA2 Length - 150
Used for powerful trend confluence.

Stoch PRO + Dynamic EMA (EMA cross)Stoch PRO + Dynamic EMA Documentation
Overview:
- Pine Script v6 overlay indicator combining a trend-colored EMA with a Stochastic oscillator to highlight midline momentum shifts.
- Designed for TradingView charts (Indicators → Import) as a visual aid for timing entries within trend-following setups.
- Crafted and optimized around BTCUSDT on the 4h timeframe; adapt inputs before applying to other markets or intervals.
Inputs:
- EMA Length (default 50): smoothing window for the dynamic EMA; lower values respond faster but whipsaw more.
- Stochastic K Length (20): lookback for the raw %K calculation.
- Stochastic K Smoothing (3): SMA applied to %K to reduce noise.
- Stochastic D Smoothing (3): SMA over %K to produce the companion %D line.
Visual Elements:
- EMA plotted on price with linewidth 3; teal when close > EMA, fuchsia otherwise.
- Background tinted teal/fuchsia at high transparency (≈92) to reinforce the current trend bias without obscuring price bars.
Oscillator Logic:
- %K = ta.stoch(high, low, close, kLength); smoothed with ta.sma(kRaw, kSmooth).
- %D = ta.sma(k, dSmooth).
- Focus is on the midline (50) rather than traditional 20/80 extremes to emphasize rapid momentum flips.
Signals:
- Buy: %K crossing above 50 while close > EMA (teal state). Plots tiny teal circle below the bar.
- Sell: %K crossing below 50 while close < EMA (fuchsia state). Plots tiny purple circle above the bar.
Trading Workflow Tips:
- Use EMA/background color for directional bias, then confirm with %K 50-cross to refine entries.
- Consider higher-timeframe trend filters or price-action confirmation to avoid range chop.
- Stops often sit just beyond the EMA; adjust thresholds (e.g., 55/45) if too many false positives occur.
- Always plan risk/reward upfront—define TP/SL levels that fit your strategy and backtest them thoroughly before trading live.
Alerts & Extensions:
- Wrap crossUp/crossDown in alertcondition() if TradingView alerts are needed.
- For automation/backtesting, convert logic to a strategy() script or add position management rules.

Stablecoin to BTC Market Cap RatioThis indicator calculates the ratio of the combined market capitalization of USDT and USDC stablecoins to the market capitalization of BTC. Data is updated daily from TradingView's CRYPTOCAP sources. It is displayed as a line in a separate panel, allowing analysis of stablecoin liquidity dynamics relative to BTC.
How to Use
Add the indicator to any asset chart in TradingView. It is useful for assessing the potential buying power of stablecoins in the cryptocurrency market. High ratio values may signal accumulation of liquidity in stablecoins, often preceding growth in BTC or altcoins (bullish signal). Low values indicate a decrease in the role of stablecoins, which may be bearish. It is recommended to combine with other indicators, such as RSI or volumes, to confirm trends.

MACD - Ostinato TradingMACD oscillator from Ostinato Trading, the classic momentum indicator. With this particular code you can superpose two different MACD and add a background to display cross of second indicator if you don't want to display it completely.

Koosha Dab's True Momentum OscillatorTrue Momentum Oscillator based on code written by SparkyFlary:
tradingview.com/u/SparkyFlary/
Different timeframe calculations added to the code.
MACD Remastered [CHE]MACD Remastered — Robust MACD with confirmed pivot-based divergence, optional signal bands, and ready-to-use alerts.
Summary
This indicator augments classic MACD with a robust, confirmed pivot-based divergence engine and an optional signal channel using Bollinger Bands. Divergence signals are only produced after a pivot is confirmed, which reduces noise from transient swings. A line-of-sight clearance check filters cases where the MACD histogram path contradicts the divergence, further cutting false flags. Histogram coloring clarifies momentum changes, while optional triangles project the same signals onto the main chart for quick context.
Motivation: Why this design?
Standard MACD divergence tools tend to fire early in volatile phases and flip during consolidation. The core idea here is to delay decision points until a pivot is confirmed and to validate the path between pivots. This addresses fake flips and improves signal credibility at the cost of some latency. Optional bands around the Signal line add context about compression and expansion without altering MACD’s core behavior.
What’s different vs. standard approaches?
Reference baseline: Classical MACD (fast and slow moving averages, Signal line, histogram) with simple divergence checks.
Architecture differences:
Confirmed pivot logic with left and right bars.
Line-of-sight clearance test across the histogram path between pivots.
Optional Signal-line Bollinger Bands with configurable length and width.
Composite “Any Divergence” alert plus separate regular and hidden alerts.
Optional main-chart triangles using forced overlay for at-a-glance context.
Practical effect: Fewer early or contradictory divergence signals, clearer momentum context via histogram colors and a visible Signal channel during compression and expansion.
How it works (technical)
The MACD line derives from a fast and a slow moving average on a chosen source. The Signal line smooths the MACD line using a selected moving average type and length. The histogram is the difference between MACD and Signal and is colored by direction and acceleration.
Divergence uses confirmed pivots: a pivot forms only after a set number of bars on the right side, so the event is locked in. The engine retrieves the last two relevant pivots and checks price movement versus the MACD histogram movement to classify regular or hidden divergence. A line-of-sight clearance routine traverses the histogram path between the two pivots and rejects the signal if the path invalidates the directional relationship. When enabled, Bollinger Bands are plotted around the Signal line; width scales with standard deviation. Programmatic alerts fire only on confirmed bars. No higher-timeframe requests are used.
Parameter Guide
Oscillator MA Type — Sets fast and slow MA family for MACD. Default: EMA. Tip: EMA is more responsive; SMA is steadier.
Fast Length — Fast MA period. Default: 12. Trade-off: Shorter is quicker but noisier.
Slow Length — Slow MA period. Default: 26. Trade-off: Longer reduces noise but adds lag.
Source — Price input. Default: Close. Tip: Use a stable source for consistency.
Signal MA Type — Moving average family for Signal. Default: EMA.
Signal Length — Smoothing of MACD into Signal. Default: 9. Trade-off: Longer smooths more, reacts slower.
Calculate Divergence — Enables divergence engine. Default: True.
Enable Bollinger Bands on Signal — Adds bands around Signal. Default: False.
BB Length — Sampling window for bands. Default: 20. Active: Only when bands are enabled.
BB StdDev — Band width in standard deviations. Default: 2.0. Bounds: between about zero point zero zero one and fifty.
Pivot Left / Pivot Right — Bars to the left and right that define a confirmed pivot. Default: five and five. Trade-off: Larger values mean stronger but slower pivots.
Min / Max Bars Between Pivots — Valid window between two pivots. Default: five and sixty. Tip: Increase minimum to reduce micro-divergences.
Detect Hidden — Include hidden divergence. Default: True.
Draw Lines — Draw connector lines on the MACD pane. Default: True.
Alerts: Enable / Regular / Hidden / Frequency / Prefix — Control alert emission, categories, cadence, and label. Defaults: Enabled, both categories on, once per bar close, prefix “MACD RM”.
Reading & Interpretation
Histogram: Columns above zero reflect positive momentum; below zero reflect negative momentum. Color shifts indicate momentum increasing or decreasing within each side.
MACD and Signal: Crosses and distance indicate momentum shifts and strength. When bands are enabled, touches and departures hint at compression and expansion around the Signal.
Divergence: Solid green lines and labels indicate regular bullish; solid red indicate regular bearish. Dashed teal and dashed orange denote hidden bullish and hidden bearish. Triangles on the main chart mirror these events for quicker visibility.
Practical Workflows & Combinations
Trend following: Use histogram color transitions with a structure filter such as higher highs and higher lows for long bias, or lower highs and lower lows for short bias. Divergence against the prevailing structure suggests caution or partial exits.
Exits and risk: In a long, regular bearish divergence near resistance can justify scaling out or tightening stops. Hidden divergence in the trend direction can support continuation but should not replace risk controls.
Multi-asset / Multi-timeframe: Works across liquid futures, forex, indices, and large-cap equities. Start with defaults on four-hour and daily; shorten lengths on intraday only when liquidity is strong.
Behavior, Constraints & Performance
Repaint and confirmation: Signals are anchored only after the right-side pivot bars complete; alerts trigger on confirmed bars. This intentionally adds latency to reduce noise.
No higher-timeframe requests: No `security` calls are used; repaint risk is primarily tied to live bars before confirmation.
Resources: Declared `max_bars_back` is five hundred. The divergence path check iterates between pivots, bounded by the maximum bars parameter. Line objects may accumulate; limits are set for lines and labels.
Known limits: Latency at sharp turns, potential misses during fast single-bar reversals, and sensitivity to extremely choppy sessions if minimum gap between pivots is set too low.
Sensible Defaults & Quick Tunin g
Starting point: EMA, twelve and twenty-six with Signal nine; pivots five and five; minimum five, maximum sixty; alerts on close; bands off.
Too many flips: Increase Signal length, raise pivot counts, and increase minimum bars between pivots. Consider disabling hidden divergence.
Too sluggish: Reduce pivot counts, lower Signal length, and enable bands to visualize early compression.
Cluttered chart: Keep lines off and rely on labels and main-chart triangles. Use the alert prefix to route events cleanly.
What this indicator is—and isn’t
This is a visualization and signal layer for MACD with confirmed, path-checked divergence and optional Signal bands. It is not a trading system, not predictive, and not a position management framework. Use it together with structure analysis, liquidity context, and explicit risk controls.
Disclaimer
The content provided, including all code and materials, is strictly for educational and informational purposes only. It is not intended as, and should not be interpreted as, financial advice, a recommendation to buy or sell any financial instrument, or an offer of any financial product or service. All strategies, tools, and examples discussed are provided for illustrative purposes to demonstrate coding techniques and the functionality of Pine Script within a trading context.
Any results from strategies or tools provided are hypothetical, and past performance is not indicative of future results. Trading and investing involve high risk, including the potential loss of principal, and may not be suitable for all individuals. Before making any trading decisions, please consult with a qualified financial professional to understand the risks involved.
By using this script, you acknowledge and agree that any trading decisions are made solely at your discretion and risk.
Do not use this indicator on Heikin-Ashi, Renko, Kagi, Point-and-Figure, or Range charts, as these chart types can produce unrealistic results for signal markers and alerts.
Best regards and happy trading
Chervolino

Liquidity Regime OscillatorThe Liquidity Signal Line is a macro-driven confirmation tool designed to capture the underlying global liquidity regime in a single, smoothed oscillator. It measures the combined directional flow of monetary and financial conditions using high-impact macro data: Federal Reserve assets (WALCL), Treasury General Account (TGA), and the Overnight Reverse Repo facility (RRP) – adjusted by key market proxies such as the U.S. Dollar Index, credit spreads (HYG/LQD), and equity risk appetite (SPHB/SPHQ). These components are normalized, weighted, and then double-smoothed into a stable signal that translates complex liquidity dynamics into a simple 0–100 scale.
Liquidity expansion provides fuel for risk assets, while contraction drains leverage and risk appetite. The Signal Line acts as a confirmation overlay for trend and allocation strategies, showing whether systemic liquidity is broadly supportive or restrictive. Readings above 50 indicate an expansionary environment (risk-on bias), below 50 a contractionary one (risk-off bias). Because the calculation uses higher-timeframe macro data, it can be displayed on any chart to give traders a consistent, regime-aware signal that bridges macro policy and technical execution.


Volume Weighted Price OscillatorThis indicator calculates the Percentage Price Oscillator (PPO), a momentum oscillator similar to the MACD. It displays the distance between two moving averages as a percentage, making it comparable across different assets. This implementation enhances the PPO with optional volume weighting and a built-in divergence engine.
Key Features:
Customizable MA & Volume Weighting: Both the fast and slow moving averages (and the signal line) can be customized using different MA types (e.g., EMA, SMA, WMA). An option (Volume weighted) applies volume weighting to all three MAs.
MACD-Style Display: Provides the three core components: the PPO line (momentum), a signal line (trigger), and a histogram (momentum acceleration). The histogram is color-coded to show increasing or decreasing momentum.
Full Divergence Suite (Class A, B, C): A built-in divergence engine automatically detects and plots all three major divergence classes between price and the PPO line:
Regular (A): Signals potential trend reversals.
Hidden (B): Signals potential trend continuations.
Exaggerated (C): Signals weakness at double tops/bottoms.
Divergence Filtering and Visualization:
Price Tolerance Filter: Divergence detection is enhanced with a percentage-based price tolerance (pivPrcTol) to filter out insignificant market noise.
Persistent Visualization: Divergence markers are plotted for the entire duration of the signal and are visually anchored to the PPO level of the confirming pivot.
Note on Confirmation (Lag): Divergence signals rely on a pivot confirmation method to ensure they do not repaint.
The Start of a- divergence is only detected after the confirming pivot is fully formed (a delay based on Pivot Right Bars).
The End of a divergence is detected either instantly (if the signal is invalidated by price action) or with a delay (when a new, non-divergent pivot is confirmed).
Multi-Timeframe (MTF) Capability:
MTF PPO Lines: The PPO, signal line, and histogram can be calculated on a higher timeframe, with standard options to handle gaps (Fill Gaps) and prevent repainting (Wait for...).
Limitation: The Divergence detection engine (pivDiv) is disabled if a timeframe other than the chart's timeframe is selected. Divergences are only calculated on the active chart timeframe.
Integrated Alerts: Includes 18 comprehensive alerts for:
The start and end of all 6 divergence types.
The PPO line crossing its signal line.
The PPO line crossing the zero line.
The histogram changing direction (reverting).
DISCLAIMER
For Informational/Educational Use Only: This indicator is provided for informational and educational purposes only. It does not constitute financial, investment, or trading advice, nor is it a recommendation to buy or sell any asset.
Use at Your Own Risk: All trading decisions you make based on the information or signals generated by this indicator are made solely at your own risk.
No Guarantee of Performance: Past performance is not an indicator of future results. The author makes no guarantee regarding the accuracy of the signals or future profitability.
No Liability: The author shall not be held liable for any financial losses or damages incurred directly or indirectly from the use of this indicator.
Signals Are Not Recommendations: The alerts and visual signals (e.g., crossovers) generated by this tool are not direct recommendations to buy or sell. They are technical observations for your own analysis and consideration.

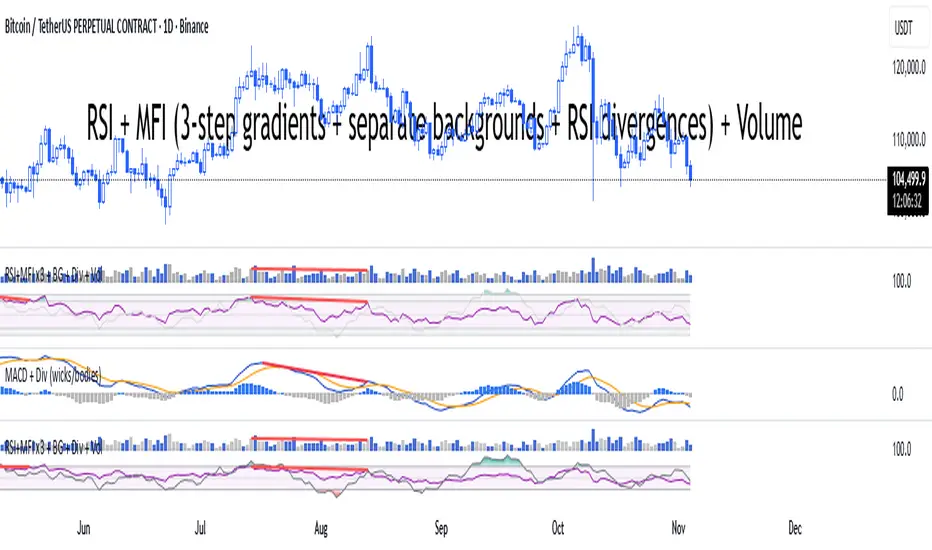
RSI + MFI + VolumeIndicator shows RSI + MFI + Volume in one panel, marks divergences separate for wicks and bodies, green dots shows where MFI and RSI are oversold
MACD (classic) + Divergences (wicks & bodies, fast/slow)macd with divergences. Wicks + bodies. Two settings for right bar

MACD HTF Hardcoded (A/B Presets) + Regimes [CHE] MACD HTF Hardcoded (A/B Presets) + Regimes — Higher-timeframe MACD emulation with acceptance-based regime filter and on-chart diagnostics
Summary
This indicator emulates a higher-timeframe MACD directly on the current chart using two hardcoded preset families and a time-bucket mapping, avoiding cross-timeframe requests. It classifies four MACD regimes and applies an acceptance filter that requires several consecutive bars before a state is considered valid. A small dead-band around zero reduces noise near the axis. An on-chart table reports the active preset, the inferred time bucket, the resolved lengths, and the current regime.
Pine version: v6
Overlay: false
Primary outputs: MACD line, Signal line, Histogram columns, zero line, regime-change alert, info table
Motivation: Why this design?
Cross-timeframe indicators often rely on external timeframe requests, which can introduce repaint paths and added latency. This design provides a deterministic alternative: it maps the current chart’s timeframe to coarse higher-timeframe buckets and uses fixed EMA lengths that approximate those views. The dead-band suppresses flip-flops around zero, and the acceptance counter reduces whipsaw by requiring sustained agreement across bars before acknowledging a regime.
What’s different vs. standard approaches?
Baseline: Classical MACD with user-selected lengths on the same timeframe, or higher-timeframe MACD via cross-timeframe requests.
Architecture differences:
Hardcoded A and B length families with a bucket map derived from the chart timeframe.
No `request.security`; all calculations occur on the current series.
Regime classification from MACD and Histogram sign, gated by an acceptance count and a small zero dead-band.
Diagnostics table for transparency.
Practical effect: The MACD behaves like a slower, higher-timeframe variant without external requests. Regimes switch less often due to the dead-band and acceptance logic, which can improve stability in choppy sessions.
How it works (technical)
The script derives a coarse bucket from the chart timeframe using `timeframe.in_seconds` and maps it to preset-specific EMA lengths. EMAs of the source build MACD and Signal; their difference is the Histogram. Signs of MACD and Histogram define four regimes: strong bull, weak bull, strong bear, and weak bear. A small, user-defined band around zero treats values near the axis as neutral. An acceptance counter checks whether the same regime persisted for a given number of consecutive bars before it is emitted as the filtered regime. A single alert condition fires when the filtered regime changes. The histogram columns change shade based on position relative to zero and whether they are rising or falling. A persistent table object shows preset, bucket tag, resolved lengths, and the filtered regime. No cross-timeframe requests are used, so repaint risk is limited to normal live-bar movement; values stabilize on close.
Parameter Guide
Source — Input series for MACD — Default: Close — Using a smoother source increases stability but adds lag.
Preset — A or B length family — Default: “3,10,16” — Switch to “12,26,9” for the classic family mapped to buckets.
Table Position — Anchor for the info table — Default: Top right — Choose a corner that avoids covering price action.
Table Size — Table text size — Default: Normal — Use small on dense charts, large for presentations.
Dark Mode — Table theme — Default: Enabled — Match your chart background for readability.
Show Table — Toggle diagnostics table — Default: Enabled — Disable for a cleaner pane.
Zero dead-band (epsilon) — Noise gate around zero — Default: Zero — Increase slightly when you see frequent flips near zero.
Acceptance bars (n) — Bars required to confirm a regime — Default: Three — Raise to reduce whipsaw; lower to react faster.
Reading & Interpretation
Histogram columns: Above zero indicates bullish pressure; below zero indicates bearish pressure. Darker shade implies the histogram increased compared with the prior bar; lighter shade implies it decreased.
MACD vs. Signal lines: The spread corresponds to histogram height.
Regimes:
Strong bull: MACD above zero and Histogram above zero.
Weak bull: MACD above zero and Histogram below zero.
Strong bear: MACD below zero and Histogram below zero.
Weak bear: MACD below zero and Histogram above zero.
Table: Inspect active preset, bucket tag, resolved lengths, and the filtered regime number with its description.
Practical Workflows & Combinations
Trend following: Use strong bull to favor long exposure and strong bear to favor short exposure. Use weak states as pullback or transition context. Combine with structure tools such as swing highs and lows or a baseline moving average for confirmation.
Exits and risk: In strong trends, consider exiting partial size on a regime downgrade to a weak state. In choppy sessions, increase the acceptance bars to reduce churn.
Multi-asset / Multi-timeframe: Works on time-based charts across liquid futures, indices, currencies, and large-cap equities. Bucket mapping helps retain a consistent feel when moving from lower to higher timeframes.
Behavior, Constraints & Performance
Repaint/confirmation: No cross-timeframe requests; values can evolve intrabar and settle on close. Alerts follow your TradingView alert timing settings.
Resources: `max_bars_back` is set to five thousand. Very large resolved lengths require sufficient history to seed EMAs; expect a warm-up period on first load or after switching symbols.
Known limits: Dead-band and acceptance can delay recognition at sharp turns. Extremely thin markets or large gaps may still cause brief regime reversals.
Sensible Defaults & Quick Tuning
Start with preset “3,10,16”, dead-band near zero, and acceptance of three bars.
Too many flips near zero: increase the dead-band slightly or raise the acceptance bars.
Too sluggish in clean trends: reduce the acceptance bars by one.
Too sensitive on fast lower timeframes: switch to the “12,26,9” preset family or raise the acceptance bars.
Want less clutter: hide the table and keep the alert.
What this indicator is—and isn’t
This is a visualization and regime layer for MACD using higher-timeframe emulation and stability gates. It is not a complete trading system and does not generate position sizing or risk management. Use it with market structure, execution rules, and protective stops.
Disclaimer
The content provided, including all code and materials, is strictly for educational and informational purposes only. It is not intended as, and should not be interpreted as, financial advice, a recommendation to buy or sell any financial instrument, or an offer of any financial product or service. All strategies, tools, and examples discussed are provided for illustrative purposes to demonstrate coding techniques and the functionality of Pine Script within a trading context.
Any results from strategies or tools provided are hypothetical, and past performance is not indicative of future results. Trading and investing involve high risk, including the potential loss of principal, and may not be suitable for all individuals. Before making any trading decisions, please consult with a qualified financial professional to understand the risks involved.
By using this script, you acknowledge and agree that any trading decisions are made solely at your discretion and risk.
Do not use this indicator on Heikin-Ashi, Renko, Kagi, Point-and-Figure, or Range charts, as these chart types can produce unrealistic results for signal markers and alerts.
Best regards and happy trading
Chervolino

ATR x Trend x Volume SignalsATR x Trend x Volume Signals is a multi-factor indicator that combines volatility, trend, and volume analysis into one adaptive framework. It is designed for traders who use technical confluence and prefer clear, rule-based setups.
🎯 Purpose
This tool identifies high-probability market moments when volatility structure (ATR), momentum direction (CCI-based trend logic), and volume expansion all align. It helps filter out noise and focus on clean, actionable trade conditions.
⚙️ Structure
The indicator consists of three main analytical layers:
1️⃣ ATR Trailing Stop – calculates two adaptive ATR lines (fast and slow) that define volatility context, trend bias, and potential reversal points.
2️⃣ Trend Indicator (CCI + ATR) – uses a CCI-based logic combined with ATR smoothing to determine the dominant trend direction and reduce false flips.
3️⃣ Volume Analysis – evaluates volume deviations from their historical average using standard deviation. Bars are highlighted as medium, high, or extra-high volume depending on intensity.
💡 Signal Logic
A Buy Signal (green) appears when all of the following are true:
• The ATR (slow) line is green.
• The Trend Indicator is blue.
• A bullish candle closes above both the ATR (slow) and the Trend Indicator.
• The candle shows medium, high, or extra-high volume.
A Sell Signal (red) appears when:
• The ATR (slow) line is red.
• The Trend Indicator is red.
• A bearish candle closes below both the ATR (slow) and the Trend Indicator.
• The candle shows medium, high, or extra-high volume.
Only one signal can appear per ATR trend phase. A new signal is generated only after the ATR direction changes.
❌ Exit Logic
Exit markers are shown when price crosses the slow ATR line. This behavior simulates a trailing stop exit. The exit is triggered one bar after entry to prevent same-bar exits.
⏰ Session Filter
Signals are generated only between the user-defined session start and end times (default: 14:00–18:00 chart time). This allows the trader to limit signal generation to active trading hours.
💬 Practical Use
It is recommended to trade with a fixed risk-reward ratio such as 1 : 1.5. Stop-loss placement should be beyond the slow ATR line and adjusted gradually as the trade develops.
For better confirmation, the Trend Indicator timeframe should be higher than the chart timeframe (for example: trading on 1 min → set Trend Indicator timeframe to 15 min; trading on 5 min → set to 1 hour).
🧠 Main Features
• Dual ATR volatility structure (fast and slow)
• CCI-based trend direction filtering
• Volume deviation heatmap logic
• Time-restricted signal generation
• Dynamic trailing-stop exit system
• Non-repainting logic
• Fully optimized for Pine Script v6
📊 Usage Tip
Best results are achieved when combining this indicator with additional technical context such as support-resistance, higher-timeframe confirmation, or market structure analysis.
📈 Credits
Inspired by:
• ATR Trailing Stop by Ceyhun
• Trend Magic by Kivanc Ozbilgic
• Heatmap Volume by xdecow

Composite Buy/Sell Score [-100 to +100] by LMComposite Buy/Sell Score (Stabilized + Sensitivity) by LM
Description:
This indicator calculates a composite trend strength score ranging from -100 to +100 by combining multiple popular technical indicators into a single, smoothed metric. It is designed to give traders a clear view of bullish and bearish trends, while filtering out short-term noise.
The score incorporates signals from:
PPO (Percentage Price Oscillator) – measures momentum via the difference between fast and slow EMAs.
ADX (Average Directional Index) – detects trend strength.
RSI (Relative Strength Index) – identifies short-term momentum swings.
Stochastic RSI – measures RSI momentum and speed of change.
MACD (Moving Average Convergence Divergence) – detects momentum shifts using EMA crossovers.
Williams %R – highlights overbought/oversold conditions.
Each component is weighted, smoothed, and optionally confirmed across a configurable number of bars, producing a stabilized composite score that reacts more reliably to significant trend changes.
Key Features:
Smoothed Composite Score
The final score is smoothed using an EMA to reduce volatility and emphasize meaningful trends.
A Sensitivity Multiplier allows traders to exaggerate the score for stronger trend signals or dampen it for quieter markets.
Customizable Inputs
You can adjust each indicator’s parameters, smoothing lengths, and confirm bars to suit your preferred timeframe and trading style.
The sensitivity multiplier allows fine-tuning the responsiveness of the trend line without changing underlying indicator calculations.
Visual Representation
Score Line: Green for positive (bullish) trends, red for negative (bearish) trends, gray near neutral.
Reference Lines:
0 = neutral
+100 = maximum bullish
-100 = maximum bearish
Adaptive Background: Optionally highlights the background intensity proportional to trend strength. Strong green for bullish trends, strong red for bearish trends.
Multi-Indicator Integration
Combines momentum, trend, and overbought/oversold signals into a single metric.
Helps identify clear entry/exit trends while avoiding whipsaw noise common in individual indicators.
Recommended Use:
Trend Identification: Look for sustained movement above 0 for bullish trends and below 0 for bearish trends.
Exaggerated Trends: Use the Sensitivity Multiplier to emphasize strong trends.
Filtering Noise: The smoothed score and confirmBars settings help reduce false signals from minor price fluctuations.
Inputs Overview:
Input Purpose
PPO Fast EMA / Slow EMA / Signal Controls PPO momentum sensitivity
ADX Length / Threshold Detects trend strength
RSI Length / Overbought / Oversold Measures short-term momentum
Stoch RSI Length / %K / %D Measures speed of RSI changes
MACD Fast / Slow / Signal Measures momentum crossover
Williams %R Length Detects overbought/oversold conditions
Final Score Smoothing Length EMA smoothing for final composite score
Confirm Bars for Each Signal Number of bars used to confirm individual indicator signals
Sensitivity Multiplier Scales the final composite score for exaggerated trend response
Highlight Background by Trend Strength Enables adaptive background coloring
This indicator is suitable for traders looking for a single, clear trend metric derived from multiple indicators. It can be applied to any timeframe and can help identify both strong and emerging trends in the market.

[AS] MACD-v & Hist [Alex Spiroglou | S.M.A.R.T. TRADER SYSTEMS] MACD-v & MACD-v Histogram
=======================================
Volatility Normalised Momentum 📈
Twice Awarded Indicator 🏆
=======================================
=======================================
✅ 1. INTRODUCTION TO THE MACD-v ✅
=======================================
I created the MACD-v in 2015,
as a way to deal with the limitations
of well known indicators like the Stochastic, RSI, MACD.
I decided to publicly share a very small part of my research
in the form of a research paper I wrote in 2022,
titled "MACD-v: Volatility Normalised Momentum".
That paper was awarded twice:
1. The "Charles H. Dow" Award (2022),
for outstanding research in Technical Analysis,
by the Chartered Market Technicians Association (CMTA)
2. The "Founders" Award (2022),
for advances in Active Investment Management,
by the National Association of Active Investment Managers (NAAIM)
=======================================
===================================================
❌ 2. WHY CREATE THE MACD-v ?
THE LIMITATIONS OF CONVENTIONAL MOMENTUM INDICATORS
====================================================
Technical Analysis indicators focused on momentum,
come in two general categories,
each with its own set of limitations:
(i) Range Bound Oscillators (RSI, Stochastics, etc)
These usually have a scaling of 0-100,
and thus have the advantage of having normalised readings,
that are comparable across time and securities.
However they have the following limitations (among others):
1. Skewing effect of steep trends
2. Indicator values do not adjust with and reflect true momentum
(indicator values are capped to 100)
(ii) Unbound Oscillators (MACD, RoC, etc)
These are boundless indicators,
and can expand with the market,
without being limited by a 0-100 scaling,
and thus have the advantage of really measuring momentum.
They have the main following limitations (among others):
1. Subjectivity of overbought / oversold levels
2. Not comparable across time
3. Not comparable across securities
=======================================
=======================================
💡 3. THE SOLUTION TO SOLVE THESE LIMITATIONS
=======================================
In order to deal with these limitations,
I decided to create an indicator,
that would be the "Best of two worlds".
A unique & hybrid indicator,
that would have objective normalised readings
(similar to Range Bound Oscillators - RSI)
but would also be able to have no upper/lower boundaries
(similar to Unbound Oscillators - MACD).
This would be achieved by "normalising" a boundless oscillator (MACD)
=======================================
==================================================
⛔ 4. DEEP DIVE INTO THE 5 LIMITATIONS OF THE MACD
==================================================
A Bloomberg study found that the MACD
is the most popular indicator after the RSI,
but the MACD has 5 BIG limitations.
Limitation 1: MACD values are not comparable across Time
The raw MACD values shift
as the underlying security's absolute value changes across time,
making historical comparisons obsolete
e.g S&P 500 maximum MACD was 1.56 in 1957-1971,
but reached 86.31 in 2019-2021 - not indicating 55x stronger momentum,
but simply different price levels.
Limitation 2: MACD values are not comparable across Assets
Traditional MACD cannot compare momentum between different assets.
S&P 500 MACD of 65 versus EUR/USD MACD of -0.5
reflects absolute price differences, not momentum differences
Limitation 3: MACD values cannot be Systematically Classified
Due to limitations #1 & #2, it is not possible to create
a momentum level classification scale
where one can define "fast", "slow", "overbought", "oversold" momentum
making systematic analysis impossible
Limitation 4: MACD Signal Line gives false crossovers in low-momentum ranges
In range-bound, low momentum environments,
most of the MACD signal line crossovers are false (noise)
Since there is no objective momentum classification system (limitation #3),
it is not possible to filter these signals out,
by avoiding them when momentum is low
Limitation 5: MACD Signal Line gives late crossovers in high momentum regimes.
Signal lag in strong trends not good at timing the turning point
— In high-momentum moves, MACD crossovers may come late.
Since there is no objective momentum classification system (limitation #3),
it is not possible to filter these signals out,
by avoiding them when momentum is high
===================================================================
===================================================================
🏆 5. MACD-v : THE SOLUTION TO THE LIMITATIONS OF THE MACD , RSI, etc
====================================================================
MACD-v is a volatility normalised momentum indicator.
It remedies these 5 limitations of the classic MACD,
while creating a tool with unique properties.
Formula: × 100
MACD-V enhances the classic MACD by normalizing for volatility,
transforming price-dependent readings into standardized momentum values.
This resolves key limitations of traditional MACD and adds significant analytical power.
Core Advantages of MACD-V
Advantage 1: Time-Based Stability
MACD-V values are consistent and comparable over time.
A reading of 100 has the same meaning today as it did in the past
(unlike traditional MACD which is influenced by changes in price and volatility over time)
Advantage 2: Cross-Market Comparability
MACD-V provides universal scaling.
Readings (e.g., ±50) apply consistently across all asset classes—stocks,
bonds, commodities, or currencies,
allowing traders to compare momentum across markets reliably.
Advantage 3: Objective Momentum Classification
MACD-V includes a defined 5-range momentum lifecycle
with standardized thresholds (e.g., -150 to +150).
This offers an objective framework for analyzing market conditions
and supports integration with broader models.
Advantage 4: False Signal Reduction in Low-Momentum Regimes
MACD-V introduces a "neutral zone" (typically -50 to +50)
to filter out these low-probability signals.
Advantage 5: Improved Signal Timing in High-Momentum Regimes
MACD-V identifies extremely strong trends,
allowing for more precise entry and exit points.
Advantage 6: Trend-Adaptive Scaling
Unlike bounded oscillators like RSI or Stochastic,
MACD-V dynamically expands with trend strength,
providing clearer momentum insights without artificial limits.
Advantage 7: Enhanced Divergence Detection
MACD-V offers more reliable divergence signals
by avoiding distortion at extreme levels,
a common flaw in bounded indicators (RSI, etc)
====================================================================
=======================================
⚒️ 5. HOW TO USE THE MACD-v: 7 CORE PATTERNS
HOW TO USE THE MACD-v Histogram: 2 CORE PATTERNS
=======================================
>>>>>> BASIC USE (RANGE RULES) <<<<<<
The MACD-v has 7 Core Patterns (Ranges) :
1. Risk Range (Overbought)
Condition: MACD-V > Signal Line and MACD-V > +150
Interpretation: Extremely strong bullish momentum—potential exhaustion or reversal zone.
2. Retracing
Condition: MACD-V < Signal Line and MACD-V > -50
Interpretation: Mild pullback within a bullish trend.
3. Rundown
Condition: MACD-V < Signal Line and -50 > MACD-V > -150
Interpretation: Momentum is weakening—bearish pressure building.
4. Risk Range (Oversold)
Condition: MACD-V < Signal Line and MACD-V < -150
Interpretation: Extreme bearish momentum—potential for reversal or capitulation.
5. Rebounding
Condition: MACD-V > Signal Line and MACD-V > -150
Interpretation: Bullish recovery from oversold or weak conditions.
6. Rallying
Condition: MACD-V > Signal Line and MACD-V > +50
Interpretation: Strengthening bullish trend—momentum accelerating.
7. Ranging (Neutral Zone)
Condition: MACD-V remains between -50 and +50 for 20+ bars
Interpretation: Sideways market—low conviction and momentum.
The MACD-v Histogram has 2 Core Patterns (Ranges) :
1. Risk (Overbought)
Condition: Histogram > +40
Interpretation: Short-term bullish momentum is stretched—possible overextension or reversal risk.
2. Risk (Oversold)
Condition: Histogram < -40
Interpretation: Short-term bearish momentum is stretched—potential for rebound or reversal.
=======================================
=======================================
📈 6. ADVANCED PATTERNS WITH MACD-v
=======================================
Thanks to its volatility normalization,
the MACD-V framework enables the development
of a wide range of advanced pattern recognition setups,
trading signals, and strategic models.
These patterns go beyond basic crossovers,
offering deeper insight into momentum structure,
regime shifts, and high-probability trade setups.
These are not part of this script
=======================================
===========================================================
⚙️ 7. FUNCTIONALITY - HOW TO ADD THE INDICATORS TO YOUR CHART
===========================================================
The script allows you to see :
1. MACD-v
The indicator with the ranges (150,50,0,-50,-150)
and colour coded according to its 7 basic patterns
2. MACD-v Histogram
The indicator The indicator with the ranges (40,0,-40)
and colour coded according to its 2 basic ranges / patterns
3. MACD-v Heatmap
You can see the MACD-v in a Multiple Timeframe basis,
using a colour-coded Heatmap
Note that lowest timeframe in the heatmap must be the one on the chart
i.e. if you see the daily chart, then the Heatmap will be Daily, Weekly, Monthly
4. MACD-v Dashboard
You can see the MACD-v for 7 markets,
in a multiple timeframe basis
=======================================
=======================================
🤝 CONTRIBUTIONS 🤝
=======================================
I would like to thank the following people:
1. Mike Christensen for coding the indicator
@TradersPostInc, @Mik3Christ3ns3n,
2. @Indicator-Jones For allowing me to use his Scanner
3. @Daveatt For allowing me to use his heatmap
=======================================
=======================================
⚠️ LEGAL - Usage and Attribution Notice ⚠️
=======================================
Use of this Script is permitted
for personal or non-commercial purposes,
including implementation by coders and TradingView users.
However, any form of paid redistribution,
resale, or commercial exploitation is strictly prohibited.
Proper attribution to the original author is expected and appreciated,
in order to acknowledge the source
and maintain the integrity of the original work.
Failure to comply with these terms,
or to take corrective action within 48 hours of notification,
will result in a formal report to TradingView’s moderation team,
and will actively pursue account suspension and removal of the infringing script(s).
Continued violations may result in further legal action, as deemed necessary.
=======================================
=======================================
⚠️ DISCLAIMER ⚠️
=======================================
This indicator is For Educational Purposes Only (F.E.P.O.).
I am just Teaching by Example (T.B.E.)
It does not constitute investment advice.
There are no guarantees in trading - except one.
You will have losses in trading.
I can guarantee you that with 100% certainty.
The author is not responsible for any financial losses
or trading decisions made based on this indicator. 🙏
Always perform your own analysis and use proper risk management. 🛡️
=======================================
