Relativity Autonomous Distribution Blocks
The relativity method is a method of trade inspired by the Theory of Relativity of Albert Einstein , which argues that trade is a relative concept and, according to the case it advocates, creates the values to be evaluated relatively by using various engineering methods, and converts these values to factors to ensure the highest efficiency.
Many layers are common with Autonomous LSTM.
For more information about Autonomous LSTM :
But there are additional layers that are much higher than that.
These systems use COT (Commitment of Traders) data positively in trade and significantly increase the hit rate compared to conventional methods.
And in all traded instruments, it decides the degree of scoring by linking with global markets.
The more liquidity of the selected parities, the higher the success rate, the higher liquidity in the markets.
***STRUCTURE
Feature Layer 1 : Formulation : Common Layer with Autonomous LSTM
Feature Layer 2: Forecast Algorithm : Common Layer with Autonomous LSTM
Feature Layer 3 : Composite of Two Layers : Adaptive Period (Length) Algorithm : Common Layer with Autonomous LSTM
Feature Layer 4 : High - Low Selection Algorithm : Common Layer with Autonomous LSTM
Feature Layer 5 : Volume (Ticker ) - Open Interest (Global Market) Power Factor according to Global Markets and Related instrument (Ticker)
Feature Layer 6 : Quantum Equations including COT Commercial Positions (Communicate with layer 5)
Feature Layer 7 : World's Price/Earnings Ratio (This layer is automatically added to layer 6 as a factor each week.)
Feature Layer 8 : Distribution Blocks : The design of script as a histogram, with distributional buying and selling points and positive/negative zone coloring, with alerts.
Uses the relativity algorithm. This will contribute not only to leveraged transactions but also to portfolio management and will give a more realistic perspective.
Informs the trading points within the regions.
In this way, it allows for gradual buying and selling and reduces the risk to a much lower level.
These feature allows a difference perspective especially for traders who act with portfolio logic and / or add regular income.
The educational idea I shared in order to set an example for this logic:
***SETTINGS
Menu
1. * Market Type
The menu is divided into 5 different algorithms and covers all instruments around the world.
For example:
Futures : XAUUSD , GC , XAGUSD , SUGARUSD , SB1! , XAGUSD
Stocks : All Stocks and Modified Parities (Example : AAPL/EUR , XAU/XAG , AAPL , MT , BAC)
Forex Excluding USD/X : CHFUSD , EURUSD , EURJPY , AUDNZD
Forex USD/X : USDJPY , USDTRY , USDMXN
Crypto : BTCUSD , ETHUSD , ADAUSD or BTCETH , ETHBTC
2. * Barcolor
Barcolor Plotting Rules : On / off section with these rules when barcolor on :
Orange : Distributional Sell Signal ( Not Short )
Blue : Distributinaol Buy Signal
*** FEATURES
Indicator Features :
Red Background with Cross : Short Signal
Green Background with Cross : Buy Signal
Blue Histogram Color : Distributional Buy Signal
Orange Histogram Color : Distributional Sell Signal
Alerts
Long Alert
Short Alert
Distributional Buy Alert
Distributional Sell Alert
*** USAGE
Since the script uses various Commitment of Traders data, it is designed only for the weekly time frame. ( TF = 1W )
Script does not repaint 1 Week and above time frames . (Source = close )
NOTE :
The script design was inspired by one of RafaelZioni's script :
Best regards.
Cftc

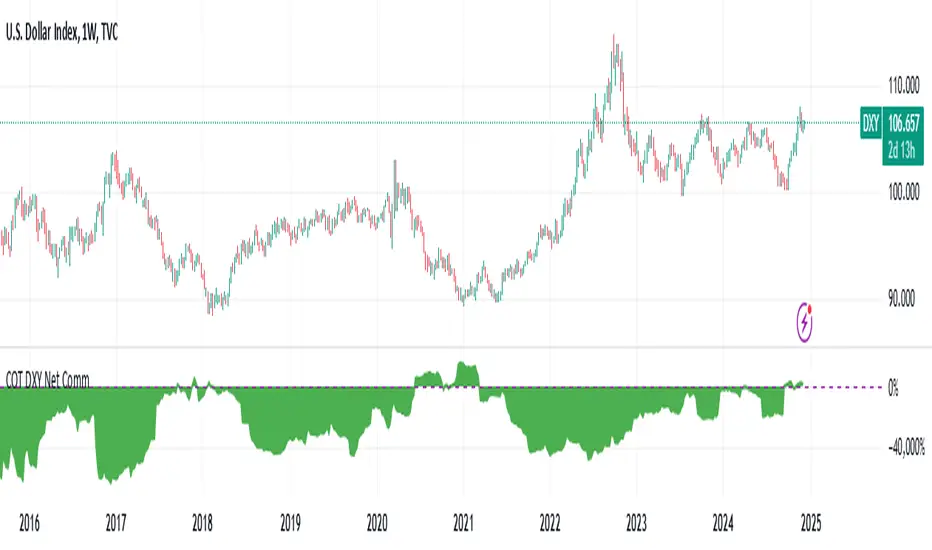
DXY COT Commercial Net PositionsThis script was created due to the lack of position of US Dollar Index Futures (DXY).
It is designed to perform a much more liquid and inclusive position analysis.
As the exponential ratios do not mean anything to positions, weights are used as multipliers instead of exponential functions.
Swedish Krona (SEK) Futures are not directly quoted in Quandl, therefore weighted in Euro / dollar parity.
By perceiving these positions as inverse correlations, you can also identify where the world economy is doing well.
COT Commercial Net Positions are calculated as (Short - Long) because of Commercials act according to the reverse of the market.
In this way, you can follow up normally instead of reverse correlation.
Because except in extreme cases, in which case capitals usually shift to Gold.
This is not the case, since there is no capital inflow to other currencies, it is not a strong sell position to the dollar index.
When there is a shift in bonds, we see the effect of the dollar in general.
I created for the Dollar Index in order not to deviate from the concept.
I wanted to share it with everyone as I thought that you have important clues about how investors take positions.
Modified currency weights :
Euro : % 61.8
Japanese Yen : % 13.6
British Pound : %11.9
Canadian Dollar : % 9.1
Swiss Franc : % 3.6
NOTE : You can use it for all instruments except crypto coins, especially US Dollar Index (DXY).
Since the COT data is taken, it will not repaint in 1 week (1W) timeframe.
The log can also be repaint according to the time of data publication.
It will repaint in lower time frames.
I hope it will help your analysis and your scripts,regards.
Open Interest Stochastic Money Flow IndexThis is the improved version of Stochastic Money Flow Index script that uses Open Interest instead of volume in Future markets.
I think it will make a difference especially in Future and CFD markets.
Since the system will pull data from Quandl, CFTC reports may cause repaint when disclosed.
So if you use it during the weekly time frame (1W), it will definitely not repaint.
You can also use the volume by selecting "Others" from the menu.This option applies to each instrument, you can use it on any financial instrument with or without COT data.
Bitcoin is included in the "Futures" option.
In Futures, you can observe the difference of Open Interest's success by comparing, since it counts exchanges between the two parties singularly, it reacts more firmly to speculative movements.
This script also includes alerts and bar color options, you can use from the menu.
It is also suitable for mutable variables.This script was freed from the integer loads.You can modify it in any adaptive or fractional period.
I hope it will help your analyzes, regards .

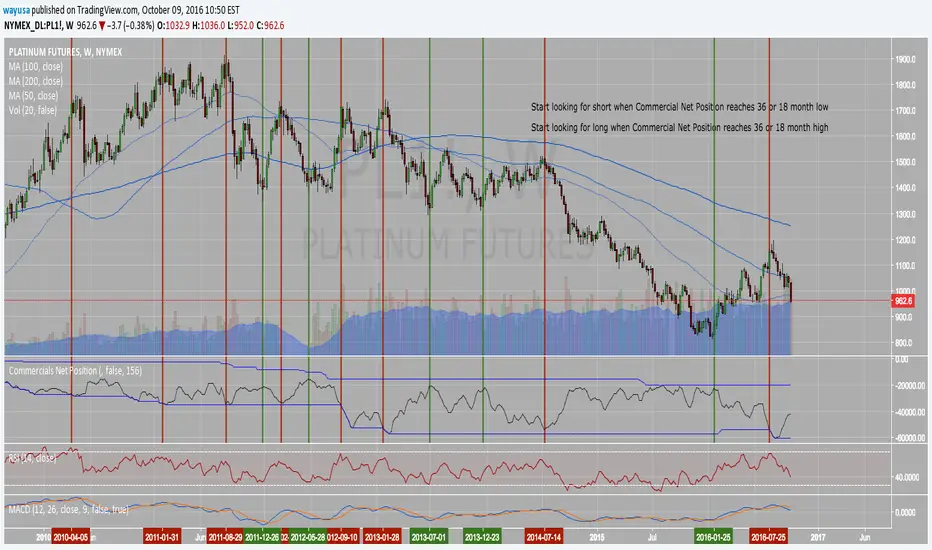
COT Commercial Positions (Updated)
This script aims to look at the markets from a manufacturer's point of view.
Producers or large enterprises gradually sell their goods as the price increases.
Because both the amount of product and position in their hands is too high, otherwise they can not find buyers, and they have to make a safe profit.
Therefore, I have shown short positions in green and long positions in red.
Blue is the net position formed by subtracting long positions from short positions.
This script is created with the latest Quandl data number codes.
Please let me know if you see a missing or a code update.
I recommend using it in a weekly (1W) time frame.
CAUTION : Since Bitcoin producer positions are very sparse, speculative long positions have been preferred in Bitcoin.
If you're looking for Bitcoin,
select Bitcoin from the menu.
Regards.

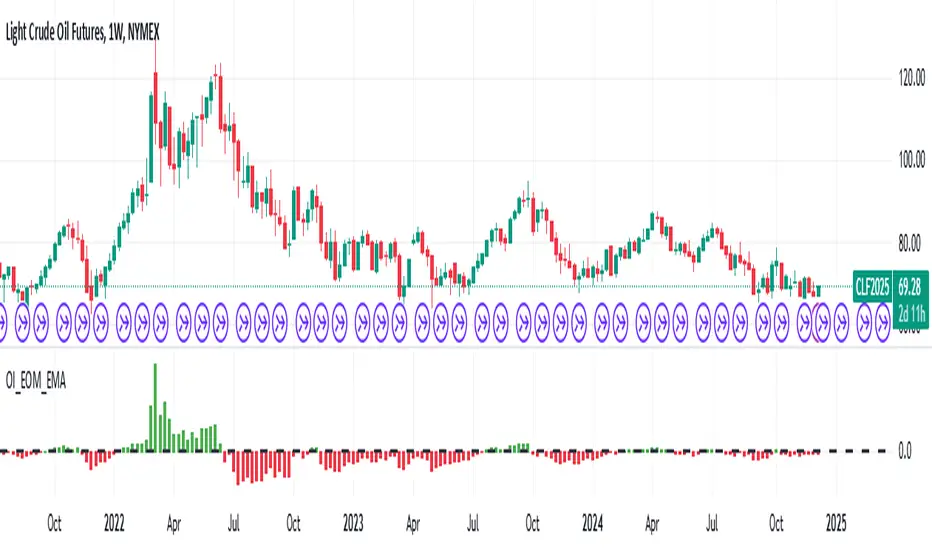
Open Interest Exponential Ease of MovementModified Ease of Movement :
* Open Interests used on Futures instead of Volume (Includes Bitcoin)
* Exponential Moving Average used instead of Simple Moving Average
* Division Number cancelled. (Division Number gives wrong signals inside strong trends.)
NOTE : This code is open source under the MIT License. If you have any improvements or corrections to suggest, please send me a pull request via the github repository github.com
Stay tuned. Best regards !
Open Interest Money Flow Index (OIMFI)CAUTION : This system was inspired from seiglerj' s "Money Flow Index " script. Open Interests are used instead of volume.
What is the Money Flow Index ( MFI )?
The Money Flow Index ( MFI ) is a technical oscillator that uses price and volume for identifying overbought or oversold conditions in an asset. It can also be used to spot divergences which warn of a trend change in price. The oscillator moves between 0 and 100.
Unlike conventional oscillators such as the Relative Strength Index ( RSI ), the Money Flow Index incorporates both price and volume data, as opposed to just price. For this reason, some analysts call MFI the volume-weighted RSI .
What Does the Money Flow Index ( MFI ) Tell You?
One of the primary ways to use the Money Flow Index is when there is a divergence. A divergence is when the oscillator is moving in the opposite direction of price. This is a signal of a potential reversal in the prevailing price trend.
For example, a very high Money Flow Index that begins to fall below a reading of 80 while the underlying security continues to climb is a price reversal signal to the downside. Conversely, a very low MFI reading that climbs above a reading of 20 while the underlying security continues to sell off is a price reversal signal to the upside.
Traders also watch for larger divergences using multiple waves in the price and MFI . For example, a stock peaks at $10, pulls back to $8, and then rallies to $12. The price has made two successive highs, at $10 and $12. If MFI makes a lower higher when the price reaches $12, the indicator is not confirming the new high. This could foreshadow a decline in price.
The overbought and oversold levels are also used to signal possible trading opportunities. Moves below 10 and above 90 are rare. Traders watch for the MFI to move back above 10 to signal a long trade, and to drop below 90 to signal a short trade.
Other moves out of overbought or oversold territory can also be useful. For example, when an asset is in an uptrend, a drop below 20 (or even 30) and then a rally back above it could indicate a pullback is over and the price uptrend is resuming. The same goes for a downtrend. A short-term rally could push the MFI up to 70 or 80, but when it drops back below that could be the time to enter a short trade in preparation for another drop .
Reference : www.investopedia.com
WARNING :
** Since each instrument in the list has its own unique contract data, you must first enter its name to display it. I recommend you to select OANDA from the markets. Finally, when the COT reports are issued, it may repaints. However, this repaint is usually close to closing or after close .(When COT reports are so sharp ) So use this script only 1W ( 1 week ) or 1 M ( 1 month ) timeframe.
** This data is taken to Tradingview with the help of Quandl. This is a very low possibility, but the system will not work if there is a malfunction.
FEATURES :
*** Working with all futures (Including : Bitcoin )
*** If you dont work with "Futures" , you can select "Others" from switchable menu and use volume for all instruments.
*** New generation elegant design used : Adaptive coloring Overbought - Oversold Levels according to the closing price.
NOTE : This code is open source under the MIT License. If you have any improvements or corrections to suggest, please send me a pull request via the github repository github.com
Stay tuned. Best wishes !

Weiss Wave Open Interest BarsFirstly :
LazyBear ' s "Weiss Wave " codes are used for open interests.
Original Weiss Wave Volume :
Let's start :
Open Interest vs. Volume: An Overview
Volume and open interest are two key measurements that describe the liquidity and activity of contracts In the options and futures markets. However, their meanings and applications are different. Volume refers to the number of contracts traded in a given period, while open interest denotes the number of active contracts.
Volume
Trading volume measures the number of options or futures contracts being exchanged between buyers and sellers, identifying the level of activity for that particular contract. For every buyer, there is a seller, and the transaction itself counts toward the daily volume.
Open Interest
Open interest indicates the number of options or futures contracts that are held by traders and investors in active positions. These positions have not been closed out, expired, or exercised. Open interest decreases when holders and writers of options (or buyers and sellers of futures) close out their positions. To close out positions, they must take offsetting positions or exercise their options. Open interest increases once again when investors and traders open new long positions or writers/sellers take on new short positions. Open interest also increases when new options or futures contracts are created.
Options or futures contract trading volume can only increase while open interest can either increase or decrease. While trading volume indicates the number of contracts that have been bought or sold, open interest identifies the number of contracts that are currently held.
Reference : www.investopedia.com
*** Worked to define all futures . You can look them in codes (between line : 13 to line 94 )
** CAUTION 1 : Since each instrument in the list has its own unique contract data, you must first enter its name to display it. I recommend you to select OANDA from the markets. Finally, when the COT reports are issued, it may repaints. However, this repaint is usually close to closing or after close .(When COT reports are so sharp ) So use this script only 1W ( 1 week ) or 1 M ( 1 month ) timeframe.
** CAUTION 2 : This data is taken to Tradingview with the help of Quandl. This is a tremendous possibility, but the system will not work if there is a malfunction.
Best regards.

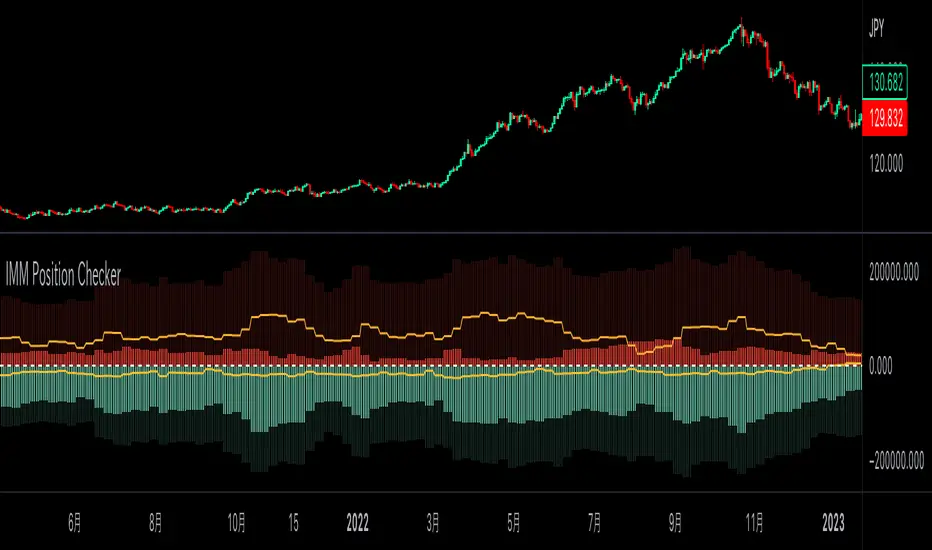
IMM Position CheckerCFTC建玉明細インジケータ『IMM Position Checker』
Commodity Futures Trading Commission (CFTC)からシカゴIMM通貨先物ポジションのデータを自動インポートし、チャート上に表示するインジケータです。
各証券会社や為替情報サイトで見られるものよりも、より期間・確認できる銘柄が広範で、ユーザーのニーズに合わせて表示できる自由度の高いものにしました。
詳細・購入はこちらにて(https://note.mu/cryptokitsune/n/n345110c8f4d2)
CFTC/COT:LUpdated to Tradingview Pinescript 3.0
CFTC COT REPORT IN LEGACY MODE
Source : Quandl
The Commitments of Traders ( COT ) reports provide traders positions at the close of Tuesday's trading session. Reports show how many long and how many short contracts do traders of each category hold. As the original data is weekly, charts will only work at weekly timeframe .
Supported tickers are all major FX pairs against USD and common CFD^s. Chart will not load if ticker is not supported.