Pair Correlation Master [Macro]The Main Idea
Trading represents a constant battle between Systemic Flows (the whole market moving together) and Idiosyncratic Moves (one specific asset moving on its own).
This tool allows you to monitor a "basket" of 4 assets simultaneously (e.g., the major USD pairs). It answers the most important question in forex and multi-asset trading: "Is this move happening because the Dollar is weak, or because the Euro is strong?"
It separates the "Signal" (the unique move) from the "Noise" (the herd movement).
1. The Chart Lines: The "Race" (Macro Trend)
Think of the lines on your chart as a long-distance race. They visualize the performance of all 4 assets over the last 200 candles (adjustable).
- Bunched Together: If all lines are moving in the same direction, the market is highly correlated. (e.g., "The Dollar is selling off everywhere").
- Fanning Out: If the lines are spreading apart, specific currencies are outperforming others.
- The Zero Line: This is the starting line.
--- Above 0: The pair is in a macro uptrend.
--- Below 0: The pair is in a macro downtrend.
2. The Dashboard: The "Health Check" (Micro Data)
The table in the top right gives you the immediate statistics for right now.
- A. The Z-Score (The Rubber Band)
This measures how "stretched" price is compared to its normal behavior.
- White (< 2.0): Normal trading activity.
- Orange (> 2.0): The price is stretching. Warning sign.
- Red (> 3.0): Critical Stretch. The rubber band is pulled to its limit. Statistically, a pullback or pause is highly likely.
B. The Star (★)
The script automatically calculates the average behavior of your group. If one asset is behaving completely differently from the rest, it marks it with a Star (★).
- Example: EURUSD, GBPUSD, and NZDUSD are flat, but AUDUSD is rallying hard. AUDUSD gets the ★. This is where the unique opportunity lies.
🎯 Best Uses: 4H & Daily Timeframes
This indicator is tuned for "Macro" analysis. It works best on the "4-Hour" and "Daily" charts to filter out intraday noise and capture swing trading moves.
- Strategy 1: The "Rubber Band" Snap (Mean Reversion)
- Setup: Look for a Z-Score in the RED (> 3.0) on the Daily timeframe.
- Action: This indicates an unsustainable move. Look for reversals or exhaustion patterns to trade against the trend back toward the mean.
- Strategy 2: The "Lone Wolf" (Trend Following)
- Setup: Look for the asset with the Star (★).
- Action: If the whole basket is flat (Balanced), but the Star asset is breaking out, that creates a high-quality trend trade because that specific currency has its own catalyst (News/Earnings).
- Strategy 3: Systemic Flows (Basket Trading)
- Setup: The dashboard footer says "⚠️ SYSTEMIC MOVE."
- Action: This means everything is moving together (e.g., a massive USD crash). Don't look for unique setups; just join the trend on the strongest pair.
Dashboard Footer Key
The bottom of the table summarizes the current state of the market for you:
- Balanced / Rangebound: The market is quiet. Good for range trading.
- Focus: : Trade this specific pair. It is moving independently.
- Systemic Move: The whole basket is moving violently. Trade the momentum.
p.s. Suggestion - apply and use on the chart rather than an oscillator.
Comparison

Relative Performance Analyzer [AstrideUnicorn]Relative Performance Analyzer (RPA) is a performance analysis tool inspired by the data comparison features found in professional trading terminals. The RPA replicates the analytical approach used by portfolio managers and institutional analysts who routinely compare multiple securities or other types of data to identify relative strength opportunities, make allocation decisions, choose the most optimal investment from several alternatives, and much more.
Key Features:
Multi-Symbol Comparison: Track up to 5 different symbols simultaneously across any asset class or dataset
Two Performance Calculation Methods: Choose between percentage returns or risk-adjusted returns
Interactive Analysis: Drag the start date line on the chart or manually choose the start date in the settings
Professional Visualization: High-contrast color scheme designed for both dark and light chart themes
Live Performance Table: Real-time display of current return values sorted from the top to the worst performers
Practical Use Cases:
ETF Selection: Compare similar ETFs (e.g., SPY vs IVV vs VOO) to identify the most efficient investment
Sector Rotation: Analyze which sectors are showing relative strength for strategic allocation
Competitive Analysis: Compare companies within the same industry to identify leaders (e.g., APPLE vs SAMSUNG vs XIAOMI)
Cross-Asset Allocation: Evaluate performance across stocks, bonds, commodities, and currencies to guide portfolio rebalancing
Risk-Adjusted Decisions: Use risk-adjusted performance to find investments with the best returns per unit of risk
Example Scenarios:
Analyze whether tech stocks are outperforming the broader market by comparing XLK to SPY
Evaluate which emerging market ETF (EEM vs VWO) has provided better risk-adjusted returns over the past year
HOW DOES IT WORK
The indicator calculates and visualizes performance from a user-defined starting point using two methodologies:
Percentage Returns: Standard total return calculation showing percentage change from the start date
Risk-Adjusted Returns: Cumulative returns divided by the volatility (standard deviation), providing insight into the efficiency of performance. An expanding window is used to calculate the volatility, ensuring accurate risk-adjusted comparisons throughout the analysis period.
HOW TO USE
Setup Your Comparison: Enable up to 5 assets and input their symbols in the settings
Set Analysis Period: When you first launch the indicator, select the start date by clicking on the price chart. The vertical start date line will appear. Drag it on the chart or manually input a specific date to change the start date.
Choose Return Type: Select between percentage or risk-adjusted returns based on your analysis needs
Interpret Results
Use the real-time table for precise current values
SETTINGS
Assets 1-5: Toggle on/off and input symbols for comparison (stocks, ETFs, indices, forex, crypto, fundamental data, etc.)
Start Date: Set the initial point for return calculations (drag on chart or input manually)
Return Type: Choose between "Percentage" or "Risk-Adjusted" performance.

Relative PerformanceCompare the relative and actual performance of up to 15 tickers against the current market being charted across multiple timeframes. Customisable look back periods and alerts configured. All data is displayed in a dynamic table for the market selected.

Weekday Close vs Open — Last N (per weekday)# Weekday Close vs Open - Last N Occurrences
This indicator distills every weekday's historical open-to-close behavior into a compact table so you can see how "typical" the current session is before the day even closes. It runs independently of your chart timeframe by pulling daily OHLCV data under the hood, tracking the last **N** completed occurrences for each weekday, and refreshing only when a daily bar closes. On daily charts you can also shade every past bar that matches today's weekday (excluding the in-progress session) to reinforce the pattern visually while the table remains non-repainting.
## What It Shows
- **Win/Loss/Tie counts** - how many of the last `N` occurrences closed above the open (wins), below (losses), or inside the tie threshold you define as "flat".
- **Win % heatmap** - the win column is color-coded (deep green > deep red) so you immediately recognize strong or weak weekdays.
- **Advanced metrics (optional)** - average daily volume plus the average percentage excursion above/below the open (`AvgUp%`, `AvgDn%`) for that weekday.
- **Totals row** - aggregates every weekday into one row to estimate overall hit rate and average stats across the entire data set.
- **Weekday shading (optional)** - on daily charts you can tint every bar that matches today's weekday (all Mondays, all Fridays, etc.) for instant pattern recognition.
## How It Works
1. The script requests daily OHLCV data (non-repainting) regardless of the chart timeframe.
2. When a new daily bar confirms, it packs that day's data into one of seven arrays (one per weekday). Each day contributes five floats (O/H/L/C/V) so trimming and statistics stay in lockstep.
3. A helper function (`f_dayMetrics`) scans daily history to compute average volume, average excursion above/below the open, and win/loss/tie counts for the requested weekday.
4. The table populates on the last bar of the chart session, respecting your advanced/totals toggles and keeping text at `size.normal`.
## Reading the Table
- **Win/Loss/Tie columns**: raw counts taken from your chosen `N`.
- **Win %***: excludes ties from the denominator so it reflects only decisive closes.
- **AvgUp% / AvgDn%**: typical intraday extension (high vs open, open vs low) in percent.
- **Avg Vol**: arithmetic mean of daily volume for that weekday.
- **TOTAL row**: provides a global win rate plus volume/up/down averages weighted by how many samples each weekday contributed.
## Practical Uses
- Spot weekdays that historically trend higher or lower before entering a trade.
- Compare current price action against the typical intraday range (`AvgUp%` vs today's move).
- Filter mean-reversion vs breakout setups based on the most reliable weekday patterns.
- Quickly gauge whether today is behaving "in character" by referencing the highlighted row or the optional whole-chart weekday shading.
> **Tip:** Use smaller `N` values (e.g., 10-20) for adaptive, recent behavior and larger values (50+) to capture longer-term seasonality. Tighten the tie threshold if you want almost every candle to register as win/loss, or widen it to focus only on meaningful moves.

Multi-Asset % Performance Table | v2.1 | TCP Multi-Asset % Performance Table | v2.1 | TCP
ESSENTIAL SUMMARY:
Multi-Asset % Performance Table eliminates the need to manually draw and manage individual "Price Range" tools for every asset. It automatically tracks up to 15 tickers independently in a single dashboard, calculating a TOTAL SCORE (Portfolio Average) for you. Unlike manual drawings, it supports a Global Range while allowing Custom Dates for specific assets, ensuring each ticker is calculated based on its own precise entry/exit. The Smart Visuals dynamically draw the correct date lines only for the ticker you are currently viewing, keeping your chart automatic, accurate, and clutter-free.
FUL DESCRIPTION:
📊 What is this tool?
The Multi-Asset % Performance Table is a powerful portfolio dashboard designed to track the percentage performance of up to 15 different assets simultaneously.
Instead of checking tickers one by one or manually drawing price ranges, this indicator aggregates everything into a single, clean table. It allows you to compare the ROI (Return on Investment) of a basket of coins or stocks over a specific time period and calculates an aggregate TOTAL SCORE (Average %) for your selection.
🚀 Key Features
15 Asset Slots: Monitor up to 15 different tickers (Crypto, Stocks, Forex, etc.) in one view.
Global vs. Custom Dates: Set a "Global" start/end date for the whole portfolio, but override specific assets with Custom Dates if they entered the portfolio at a different time.
Smart Visuals: Automatically draws vertical dashed lines on your chart representing the start and end dates of the ticker you are currently viewing.
Total Score Calculation: Calculates the average percentage change of your portfolio. You can dynamically include or exclude specific assets from this average using the settings.
Status Column: A quick visual reference (✔ or ✘) in the table showing which assets are currently included in the Total Score calculation.
⚙️ How it Works
Data Fetching: The script pulls "Close" prices from the Daily timeframe to ensure accuracy across long periods.
Smart Matching: The visual lines automatically detect which asset you are viewing. For example, if you are looking at BTCUSDT and have custom dates set for it, the vertical lines will jump to those specific dates. If you view a ticker not in your list, it defaults to the Global dates.
Visual Protection: The script uses advanced logic to ensure only one set of range lines appears on the chart at a time, keeping your workspace clean.
🛠️ Instructions & Settings
1. Setting up your Assets
Open the Settings (Cogwheel icon).
Under ASSET 1 through ASSET 15, enter the tickers you want to track (e.g., BINANCE:BTCUSDT).
Include in Avg?: Uncheck this if you want to see the asset in the table but exclude it from the "TOTAL SCORE" average.
2. Defining Time Ranges
Global Settings: Set the Global Start and Global End dates at the top. This applies to all assets by default.
Custom Dates: If a specific asset (e.g., Asset 4) was bought on a different day, check the "Custom Dates?" box for that asset and enter its specific Start/End time.
3. Reading the Table
The table appears on the chart (default: Bottom Right) with three columns:
Asset: The name of the ticker.
% Change: The percentage move from Start Date to End Date. (Green = Positive, Red = Negative).
Inc: Shows a ✔ if the asset is included in the Total Score average, or a ✘ if excluded.
4. The Visual Lines
Two vertical dashed lines will appear on your chart.
Note: These lines are visual references only. You cannot drag them to change the dates. To change the dates, you must use the Settings menu.
💡 Tips
Hover for Details: Hover your mouse over the % Change value in the table to see a tooltip showing the exact Start Price and End Price used for the calculation.
Resolution: The script defaults to 1 Day resolution for optimal accuracy on historical data.
v2.1 | TCP - Custom Built for Precision Performance Tracking

Symbol vs Benchmark Performance & Volatility TableThis tool puts the current symbol’s performance and volatility side-by-side with any benchmark —NASDAQ, S&P 500, NIFTY or a custom index of your choice.
A quick glance shows whether the stock is outperforming, lagging, or just moving with the market.
⸻
Features
• ✅ Returns over 1W, 1M, 3M, 6M, 12M
• 🔄 Benchmark comparison with optional difference row
• ⚡ Volatility snapshot (20D, 60D, or 252D)
• 🎛️ Fully customizable:
• Show/hide rows and timeframes
• Switch between default or custom benchmarks
• Pick position, size, and colors
Built to answer a simple, everyday question — “How’s this really doing compared to the broader market?”
Thanks to @BeeHolder, whose performance table originally inspired this.
Hope it makes your analysis a little easier and quicker.

Sector Relative StrengthDescription
This script compares sector performance relative to the S&P 500. Sector price levels or charts alone can mislead, because they tend to move with the broader market. An increase in a sector’s price does not necessarily indicate strength, as it may simply be following the index.
For more a more reliable picture, the script calculates a ratio between each sector ETF and SPY. If the ratio has increased, the sector has outperformed the index. In case it has declined, the sector has underperformed. If the value is near zero, the sector has moved in line with the index. The sectors are presented in a table and sorted on relative performance.
Calculation Method
The performance is expressed as a percentage change in the ratio over a user-defined lookback period. The default lookback is set to 21 bars, which corresponds to one month on a daily chart. This value can be adopted in the settings to match preferred time period.
Z-Score
In addition to the percentage change, the script calculates a Z-score of the ratio, which measures how far the current value deviates from its recent mean. A high positive Z-score indicates that the ratio is significantly above its average, while a negative value indicates it is below. This normalization allows for comparison between sectors with different price levels or volatility profiles.
Table Columns
- Relative %: The sector's performance relative to SPY over the selected lookback period
- Z-Score: Standardized measure of current performance ratio is relative to its average
- Trend Arrow: Indicates the direction of relative performance up down or flat
Example Interpretation
For example, if XLK shows a 3.7% change, it has outperformed SPY over the selected period. Another sector might show a -2.1% change, which indicates underperformance. While both values shows relative strength or weakness, the Z-score is optional and can provide additional context based on how unusual that performance is compared to the sector's own recent behavior.
Use Case
This approach helps evaluate overall market conditions and supports a top-down method. By starting with sector performance, it becomes easier to identify where the market is showing leadership or weakness. This allows the stock selection process to be more deliberate and can help refine or customize screeners based on certain sectors.

CAM | Currency Strength PerformanceOverview 📊
The "CAM | Currency Strength Performance" indicator is a powerful forex trading tool that blends traditional composite analysis with dynamic performance tracking! 🚀 It compares the strength of a currency pair’s base and quote currencies against the pair’s price movement, offering traders a clear, colorful view of market dynamics through normalized lines and an upgraded strength-based histogram. 🎨
How It Works 🛠️
🔍 Automatic Currency Detection: Instantly identifies the base (e.g., XAU in XAUUSD) and quote (e.g., USD) currencies—no setup required!
📈 Composite Strength Calculation: Measures each currency’s power by averaging its exchange rate against a basket of 10 major currencies (GBP, EUR, CHF, USD, AUD, CAD, NZD, JPY, NOK, XAU). A classic strength snapshot! 💪
📏 Normalization: Scales composites and pair prices with a smart formula (price minus moving average, divided by standard deviation) for easy comparison. ⚖️
🎨 Dynamic Visualization:
Plots 3 normalized lines with unique colors:
Base Composite
Quote Composite
Actual Pair (⚪ white)
Benefits 🌈
🧠 Simplified Analysis: Normalized composites make static strength clear, while the new histogram reveals dynamic trends.
✅ Enhanced Decisions: Color-coded lines and a performance-driven histogram pinpoint trading opportunities fast—spot when base or quote takes the lead! 🚨
⏱️ Time-Saver: Auto-detection and dual metrics (static + dynamic) streamline your workflow.
🌍 Versatile: Works across all supported pairs, with colors adapting to currencies (e.g., orange AUD, yellow XAU).
👀 Eye-Catching: Vibrant visuals (purple GBP, green USD) and a purple histogram make it engaging and intuitive.
How It Helps Traders 💡
📈 Spot Trends: Normalized lines show steady strength; the histogram tracks recent outperformance—perfect for timing trades.
⚠️ Catch Divergences: See when strength shifts (e.g., base surging, quote lagging) don’t match price—hello, reversal signals! 🔍
🛡️ Manage Risk: Levels (1, -1) and histogram swings help gauge overbought/oversold conditions for smarter stops.
🔮 Big Picture: Combines static strength with dynamic momentum, giving a fuller market view for scalping or long-term strategies.
Conclusion ✨
"CAM | Currency Strength Performance" now fuses classic strength analysis with real-time performance tracking. With its upgraded histogram, traders get a dual lens—static composites plus dynamic strength—turning complex forex data into actionable insights! 📈💰
Mar 11
Release Notes
✨ New Feature: Strength Histogram:
Tracks the performance of base and quote currencies over a customizable lookback period (default: 10 bars). 📅
Calculates strength as the currency’s percentage change minus the basket’s average change, then plots the difference (base - quote) as a purple histogram. 📊
⚙️ Customizable Settings: Adjust Scaling Period (50), Histogram Scale Factor (0.5), Lookback Bars (10), and Levels (1, -1) to fit your trading style! 🎚️
How It Differs from the Previous Version 🔄
Old Histogram:
Showed the static difference between normalized base and quote composites—a snapshot of relative strength at a single point in time. 📷
Focused on current exchange rate levels, scaled by the pair’s normalized price movement.
New Histogram:
Displays the dynamic strength difference (base strength - quote strength) over a user-defined lookback period (e.g., 10 bars). 🌊
Measures past and current performance by calculating percentage changes relative to a basket, highlighting momentum and trends. 📈
Offers a more responsive, time-based view, showing how each currency has performed recently rather than just its absolute strength.

CAM | Comparison and Normalisation Indicator Description: "CAM | Comparison and Normalisation" 🌟
Overview 📊
The "CAM | Comparison and Normalisation" indicator is a must-have tool for forex traders! 🚀 It analyzes the strength of a currency pair’s base and quote currencies against the pair’s price movement, using automatic detection, composite calculations, and normalization—all wrapped in a colorful, easy-to-read package. 🎨
How It Works 🛠️
- 🔍 **Automatic Currency Detection**: Instantly spots the base (e.g., EUR in EURUSD) and quote (e.g., USD) currencies—no manual setup needed!
- 💪 **Composite Strength Calculation**: Measures each currency’s power by averaging its rate against 9 major currencies (GBP, EUR, CHF, USD, AUD, CAD, NZD, JPY, NOK). A true strength test! 🏋️♂️
- 📏 **Normalization**: Scales everything with a smart formula (price minus moving average, divided by standard deviation) so base, quote, and pair prices play on the same field. ⚖️
- 🎨 **Dynamic Visualization**:
- Plots 3 normalized lines with unique colors:
- **Base Composite** (e.g., purple for GBP, blue for EUR)
- **Quote Composite** (e.g., green for USD, yellow for JPY)
- **Actual Pair** (⚪ white)
- Adds labels on the last bar (e.g., "Base: GBP" in purple). 🏷️
- 📊 **Performance Histogram**: Shows the base vs. quote strength gap with a green (👍) or red (👎) area chart—adjusted by the pair’s price.
- ⚙️ **Customizable Settings**: Adjust Scaling Period (50), Histogram Scale (0.5), and Levels (1, -1) to fit your style! 🎚️
Benefits 🌈
- 🧠 **Simplified Analysis**: Normalized data cuts through the noise, making trends crystal clear.
- ✅ **Enhanced Decisions**: Colorful lines and histograms spotlight trading signals fast.
- ⏱️ **Time-Saver**: No setup—just drop it on a chart and go!
- 🌍 **Versatile**: Works on any supported pair, with colors adapting automatically (e.g., orange AUD on AUDCAD).
- 👀 **Eye-Catching**: Currency-specific colors (like purple GBP from pound notes) make it fun and easy to follow.
How It Helps Traders 💡
- 📈 **Spot Trends**: See if the base is flexing 💪 or the quote is fading 📉, and how it ties to the pair’s price.
- ⚠️ **Catch Divergences**: Histogram flags when currency strength and price don’t match—hello, opportunity! 🚨
- 🛡️ **Manage Risk**: Normalized values and levels help gauge overbought/oversold zones for smarter stops.
- **Big Picture**: Compare currency strength to pair price for strategic edge, whether scalping or swinging.
Example in Action 🎬
- **GBPUSD Chart**:
- purple GBP line climbs, greenUSD dips, histogram turns green 👍—GBP’s gaining! If the white pair line rises too, it’s a bullish hint.
Conclusion ✨
"CAM | Comparison and Normalisation" turns forex complexity into clear, actionable insights. With its auto-detection, vibrant visuals, and trader-friendly design, it’s your shortcut to smarter trades! 📈💰

aivance_Multi-Index Performance Comparison# Multi-Index Performance Comparison
This indicator allows traders and investors to easily compare the performance of multiple global market and sector indexes from a user-defined start date. All indexes are normalized to 100% at the specified start date, making relative performance comparisons straightforward.
## Features:
- Customizable start date for performance comparison
- Toggleable global market indexes (S&P 500, MSCI World, DAX, Nasdaq 100, EURO STOXX 50, Japan, Hong Kong)
- Toggleable sector indexes (Materials, Health Care, Financial, Technology, AI & Robotics)
- Clear visualization with distinct colors for each index
- Reference line at 100% for easy benchmark comparison
## How to Use:
1. Set your desired start date for normalizing performance
2. Toggle indexes on/off under the "Inputs" tab
3. Compare relative performance across different markets and sectors
Perfect for identifying relative strength, sector rotation, or global market correlations over your specific timeframe of interest.

Real-Time Price Comparator→ La version française se trouve plus bas ←
Real-Time Price Spread Comparator
This indicator allows you to compare the real-time price difference (spread) between two assets. It is particularly useful for spotting arbitrage opportunities or price discrepancies between different markets.
💡 Why is this useful?
This tool is especially practical for monitoring the gap between CME futures and the spot market. If the spread becomes too large, we can expect the market to rebalance, which can help anticipate potential price movements.
📌 Features:
✅ Compare two assets of your choice (default: BTC CME vs. BTC OANDA).
✅ Displays the spread as a real-time value on the chart.
✅ Customizable threshold for alerts when the spread exceeds a certain value.
✅ Visual alert: The label changes color and an alert icon appears when the threshold is exceeded.
✅ Adjustable label position to avoid obstructing candlestick wicks.
🛠️ How to Use:
1️⃣ Choose the asset to compare (for example, BTC CME).
2️⃣ Select the main chart (the one you are currently viewing, such as BTC OANDA).
3️⃣ Set the alert threshold (the spread value that will trigger an alert).
4️⃣ Adjust the label position using the offset settings if needed.
5️⃣ When the spread exceeds the threshold, an alert will be displayed!
-------------------------------------------------
Comparateur de Spread en Temps Réel
Cet indicateur permet de comparer en temps réel la différence de prix (spread) entre deux actifs. Il est particulièrement utile pour détecter des opportunités d’arbitrage ou des écarts de prix entre différents marchés.
💡 Pourquoi c'est utile ?
Cet outil est pratique pour surveiller l’écart entre les contrats à terme CME et le marché spot. Si l’écart devient trop important, on peut s’attendre à ce que le marché s’équilibre, ce qui peut nous orienter sur les futurs mouvements du prix.
📌 Fonctionnalités :
✅ Comparez deux actifs de votre choix (par défaut : BTC CME vs. BTC OANDA).
✅ Affiche le spread en temps réel directement sur le graphique.
✅ Définissez un seuil d’alerte pour être notifié visuellement sur le graphique si le spread dépasse une certaine valeur.
✅ Alerte visuelle : le label change de couleur et une icône d’alerte apparaît en cas de dépassement.
✅ Ajustez la position du label pour éviter qu’il ne cache les mèches des bougies.
🛠️ Comment l’utiliser :
1️⃣ Choisissez l’actif à comparer (exemple : BTC CME).
2️⃣ Sélectionnez ensuite l’actif affiché sur votre graphique principal (exemple : BTC OANDA).
3️⃣ Définissez le seuil d’alerte (valeur du spread qui déclenchera une alerte).
4️⃣ Ajustez la position du label grâce aux options d’offset si nécessaire.
5️⃣ Si le spread dépasse le seuil, une alerte visuelle apparaîtra !

[Spinn] ATH ScreenerThe indicator helps visualize the market’s state as a kind of heatmap, showing how far coins are from their all-time highs (ATH).
Since TradingView has a limitation on the number of coins processed simultaneously (no more than 40), all coins are divided into sets of 40 coins per set. If you place multiple copies of the indicator on the chart and assign a different set number in each copy, you can see the full picture for the exchange or the entire market.
The screener displays a table indicating the set number and the base currency (default is USDT).
For each coin, the following data is provided:
its name;
the distance from the current price to the ATH in percentage;
a 🔹 icon marks new coins (with a short price history);
coins that recently reached their ATH or ATL are highlighted in bold;
the background is colored as follows:
green — when less than 40% remains to the ATH;
red — when more than 60% remains;
blue — between 40% and 60%;
gray — when no data is available.
Hovering over a coin displays its name, current price, ATH and ATL values, and how many days ago they were reached.
Settings
Coin set number
Base currency (USDT)
Exchange
List of all coins on the exchange (comma-separated)*
No overlaps — if this option is enabled, tables with different sets will be placed one below the other.
Sorted — if this option is enabled, coins in the set will be sorted by their distance from ATH.
Colorize — whether to color the cell background with the specified colors or leave it light gray.
Bold ATH or ATL, days back — highlight coins in bold that recently reached an extreme (number of days is configurable).
New coins (🔹), days — mark young coins with a short price history using an icon (number of days is configurable).
Table width, % — approximate table width as a percentage of screen width.
Text size — text size in the table, from 1 to 3.
*Note: The default list was up-to-date at the time of the indicator’s publication. If certain coins are no longer traded, they will be marked with a dark gray background (no data).
Recommendation: to prevent the graph from obscuring the data, I recommend hiding it. This is done in the Object Tree, on the right side of the panel.
—
Индикатор помогает увидеть состояние рынка в виде своеобразной тепловой карты — как далеко монеты находятся от своих исторических максимумов (ATH).
Поскольку у TradingView есть ограничение на количество одновременно обрабатываемых монет (не более 40), все монеты разбиты на наборы по 40 монет в каждом. Если разместить на графике несколько копий индикатора и в каждой копии задать свой номер набора монет, можно видеть всю картину по бирже или рынку целиком.
Скринер выводит на экран таблицу с указанием номера набора монет и базовой валюты (по умолчанию — USDT).
Для каждой монеты указаны следующие данные:
её название;
расстояние от текущей цены до ATH в процентах;
значком 🔹 выделены новые монеты (с короткой историей графика);
жирным шрифтом выделены монеты, у которых ATH или ATL был достигнут недавно;
фон окрашен в такие оттенки:
зелёные — когда до ATH осталось менее 40%;
красные — более 60%;
голубые — между 40% и 60%;
серые — когда нет данных.
Если навести курсор на монету, будут показаны её название, текущая цена, значения ATH и ATL, а также сколько дней назад они были достигнуты.
Настройки
Номер набора монет
Базовая монета (USDT)
Биржа
Список всех монет на бирже (через запятую)*
No overlaps — если эта опция выделена, таблицы с разными наборами будут размещены одна под другой.
Sorted — если эта опция отмечена, монеты в наборе будут отсортированы по удалению от ATH.
Colorize — окрашивать ли фон ячеек в указанные выше цвета или оставить его светло-серым.
Bold ATH or ATL, days back — выделять жирным монеты, у которых недавно был достигнут экстремум (задаётся количество дней).
New coins (🔹), days — выделять значком молодые монеты, история графика которых небольшая (задаётся количество дней).
Table width, % — задаётся приблизительная ширина таблицы в процентах от ширины экрана.
Text size — размер текста в таблице, от 1 до 3.
*Примечание: заданный по умолчанию список был актуален на момент публикации индикатора. Если какие-то монеты перестали торговаться, они будут отмечены тёмно-серым фоном (нет данных).
Рекомендация: для того, чтобы график не заслонял данные, рекомендую его скрыть. Делается это в Дереве объектов, справа на панели.

Relative Performance Indicator by ComLucro - 2025_V01The "Relative Performance Indicator by ComLucro - 2025_V01" is a powerful tool designed to analyze an asset's performance relative to a benchmark index over multiple timeframes. This indicator provides traders with a clear view of how their chosen asset compares to a market index in short, medium, and long-term periods.
Key Features:
Customizable Lookback Periods: Analyze performance across three adjustable periods (default: 20, 50, and 200 bars).
Relative Performance Analysis: Calculate and visualize the difference in percentage performance between the asset and the benchmark index.
Dynamic Summary Label: Displays a detailed breakdown of the asset's and index's performance for the latest bar.
User-Friendly Interface: Includes customizable colors and display options for clear visualization.
How It Works:
The script fetches closing prices of both the asset and a benchmark index.
It calculates percentage changes over the selected lookback periods.
The indicator then computes the relative performance difference between the asset and the index, plotting it on the chart for easy trend analysis.
Who Is This For?:
Traders and investors who want to compare an asset’s performance against a benchmark index.
Those looking to identify trends and deviations between an asset and the broader market.
Disclaimer:
This tool is for educational purposes only and does not constitute financial or trading advice. Always use it alongside proper risk management strategies and backtest thoroughly before applying it to live trading.
Chart Recommendation:
Use this script on clean charts for better clarity. Combine it with other technical indicators like moving averages or trendlines to enhance your analysis. Ensure you adjust the lookback periods to match your trading style and the timeframe of your analysis.
Additional Notes:
For optimal performance, ensure the benchmark index's data is available on your TradingView subscription. The script uses fallback mechanisms to avoid interruptions when index data is unavailable. Always validate the settings and test them to suit your trading strategy.

Automatic comparison of symbols depending on custom listIn the indicator settings, specify a list of tickers and the corresponding symbol for comparison (e.g. TVC:DXY). Each new list must be on a separate line. The line must begin with the symbol for comparison, then an equal sign (=), and then a list of tickers separated by commas (e.g. OANDA:XAUUSD, OANDA:XAGUSD). If the ticker selected in the chart window is not found in any of the lists, then the symbol from the first list, which is specified before the equal sign, will be used as the symbol for comparison. For example:
TVC:DXY = OANDA:XAUUSD, OANDA:XAGUSD
OANDA:BCOUSD = OANDA:SPX500USD
OANDA:SPX500USD = BINANCE:BTCUSDT
***
Автоматическое сравнение символов в зависимости от настраиваемого списка
В настройках индикатора укажите список тикеров и соответствующий символ для сравнения. Каждый новый список должен быть на отдельной строке. В начале строки должен быть указан символ для сравнения (например, TVC:DXY), затем знак равенства (=) и после него список тикеров, разделенных запятыми (например, OANDA:XAUUSD, OANDA:XAGUSD). Если выбранный в окне графика тикер не будет найден ни в одном из списков, то в качестве символа для сравнения ему будет соответствовать символ из первого списка, который указан перед знаком равенства. Например:
TVC:DXY = OANDA:XAUUSD, OANDA:XAGUSD
OANDA:BCOUSD = OANDA:SPX500USD
OANDA:SPX500USD = BINANCE:BTCUSDT

Ticker Performance ComparisonTicker Performance Comparison Indicator
With this tool you can compare how three different tickers of your choice have performed over a specific period you choose. It can be used on any timeframe.
As you can see in the image above, I am comparing Nvidia, Bitcoin and Wadzpay over a 365 day period. This shows me at glance which asset has done better and by how much.
It shows how the closing prices have changed from the start of your chosen period to now, by automatically drawing lines on the same scale.
Key Features:
Lookback Period: You decide how many bars (days, weeks, etc.) back to look from today.
Three Tickers: Enter up to three different ticker symbols to see how they stack up against each other
Percentage Change: The tool calculates how much each ticker's closing price has changed, in percentage terms, from the start of your lookback period.
Performance Labels: Labels at the end of the period show the percentage change for each ticker.
Important:
Ignore the lines that are drawn before your lookback period: The lines before your chosen lookback period might be misleading. They appear due to the way historical data is processed and should be ignored. Only consider the data and trends from the start of the lookback period you entered to the present for an accurate comparison.
Use this tool to easily compare how different assets have performed over the timeframe that matters to you.

Relative Strength Universal
Relative strength is a ratio between two assets, generally it is a stock and a market average (index). RS implementation details are explained here .
This script automatically decides benchmark index for RS calculation based on market cap input values and input benchmark indices values.
Relative strength calculation:
"To calculate the relative strength of a particular stock, divide the percentage change over some time period by the percentage change of a particular index over the same time period". This indicator value oscillates around zero. If the value is greater than zero, the investment has been relatively strong during the selected period; if the value is less than zero, the investment has been relatively weak.
In this script, You can input market cap values and all are editable fields. If company market cap value is grater than 75000(Default value) then stock value will be compared with Nifty index. If company market cap is between 75000 and 25000 then stock value will be compared with midcap 150 to calculate RS. If marketcap is greater than 5000 and less than 25000 then RS will be calculated based on smallcap250. If marketcap is less than 5000 and greater than 500 then it will be compared with NIFTY_MICROCAP250

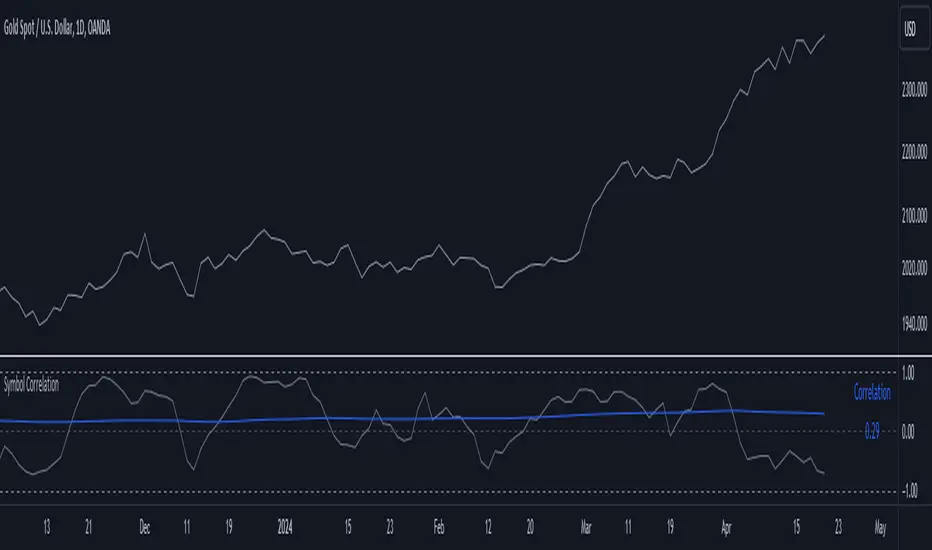
Symbol CorrelationThe "Symbol Correlation" indicator calculates and displays the correlation between the chosen symbol's price and another selected source over a specified period. It also includes a moving average (SMA) of this correlation to provide a smoothed view of the relationship.
Why SMA and Table Display ?
The inclusion of SMA (Simple Moving Average) with adjustable length (SMA Length) enhances the indicator's utility by smoothing out short-term fluctuations in correlation, allowing for clearer trend identification. The SMA helps to visualize the underlying trend in correlation, making it easier to spot changes and patterns over time.
The table display of the correlation SMA value offers a concise summary of this trend. By showcasing the current correlation SMA alongside its historical values, traders can quickly gauge the relationship's strength relative to previous periods.
Interpreting the Indicator:
1. Correlation Values: The primary plot shows the raw correlation values between the symbol's price and the specified source. A value of 1 indicates a perfect positive correlation, -1 signifies a perfect negative correlation, and 0 suggests no linear relationship.
2. Correlation SMA: The SMA line represents the average correlation over a defined period (SMA Length). Rising SMA values indicate strengthening correlation trends, while declining values suggest weakening correlations.
3. Choosing SMA Length: Traders can adjust the SMA Length parameter to tailor the moving average to their specific analysis horizon. Shorter SMA lengths react quickly to price changes but may be more volatile, while longer SMA lengths smooth out noise but respond slower to recent changes.
In summary, the "Symbol Correlation" indicator is a valuable tool for assessing the evolving relationship between a symbol's price and an external source. Its use of SMA and tabular presentation facilitates a nuanced understanding of correlation trends, aiding traders in making informed decisions based on market dynamics.
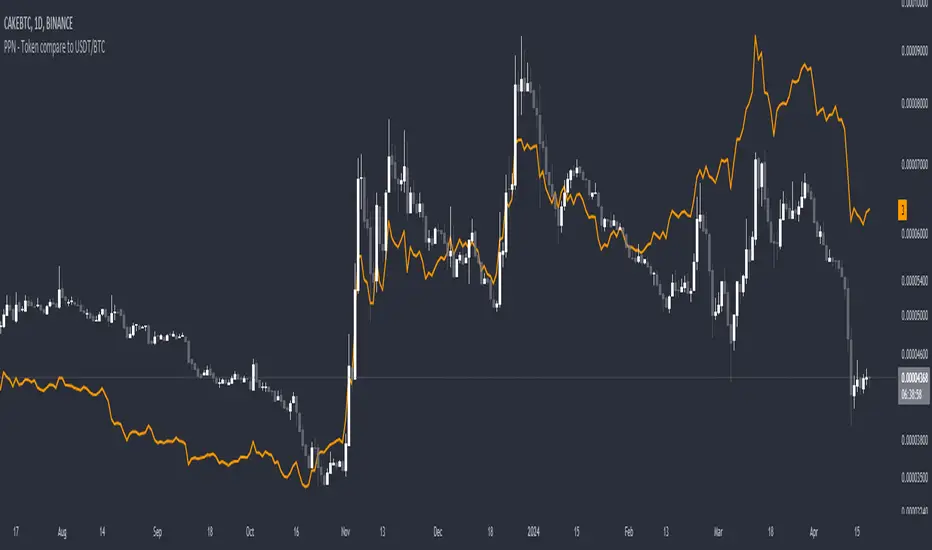
PPN - Token compare to USDT/BTCThis simple indicator allows you to easily view the price of a selected cryptocurrency token in either USDT or BTC on TradingView charts. By adding this indicator to your chart, you can quickly compare the price of the token to either USDT (Tether) or BTC (Bitcoin).
**Features:**
- Choose between displaying the token price in USDT or BTC.
- Automatically detects the current trading pair and adjusts the display accordingly.
- Uses data from the BINANCE exchange to fetch real-time prices.
**How to Use:**
1. Add the indicator to your TradingView chart.
2. Select the desired ticker ending (USDT or BTC) in the indicator settings.
3. Pin the indicator to a new scale (More -> Pin to Scale -> New scale or no scale (fullscreen).
**Note:** This indicator is intended for informational purposes only and should not be used as the sole basis for making trading decisions. Always conduct your own research and consult with a financial advisor before making any investment decisions.
---
Feel free to use and modify! <3
Message me on TradingView if you have any suggestions!
Time Based Comparison Tool [TFO]The goal of this indicator is to show how multiple assets are trading relative to their Previous Highs and Lows. Many traders have probably seen charts resembling this that may plot how asset prices are trading as a percent change over time, or something similar.
The key difference with this indicator is that all prices are normalized to reflect how they are trading with respect to the previous range of a user-defined timeframe. Without the normalization process, we would simply be observing some percent change from a given point in time; but this does not provide enough information to describe where price is trading relative to our desired frame of reference.
For example, if the timeframe setting was chosen to be 1 day, the indicator would plot the Previous High (PH) and Previous Low (PL) of the current symbol on the daily timeframe, denoted here by the black lines and labels. Then, the adjusted price of all selected symbols would be shown to visualize how each one is moving with respect its own PH and PL, using the current symbol's PH and PL as reference points.
In the above chart, we can see that CL was trading below its PDL from about 10:00-11:00 am EST, then broke above and retested it at around 11:20 am EST, before trading higher. To verify that this comparison works as intended, we can check to see that CL did in fact retest its PDL at this time before trading higher. Note that we are using the close price for this evaluation.
Since limiting the output to close prices can leave out some vital information, we can change the Plot Type setting from "Close" to "High to Low," which will instead show the range of prices from high to low instead of just the close.
We can expand on this by detecting when PH's and PL's have been raided (traded through), by displaying the text PHR (Previous High Raid) or PLR (Previous Low Raid) next to the symbol's label on the right. In this case below, where we're using the 1 week timeframe, we can observe that NQ1! (purple) traded through the PL level and thus its label (right) is updated to indicate a PLR.
Similarly, YM1! traded through its PH level and was updated to indicate a PHR; and ES1! raided both levels, with its label reflecting just that.
Due to the native limitation of output series in a single pine script, alerts have been consolidated to "Any PHR" or "Any PLR," meaning these alerts would fire if any of the selected symbols raided a PH or PL, respectively. If one wanted to be alerted for just a specific symbol, this could be achieved by deselecting all symbols except that which is desired, then setting an alert and adjusting its title for easier user recognition.

Divergence AnalyzerUnlock the potential of your trading strategy with the Divergence Analyzer, a sophisticated indicator designed to identify divergence patterns between two financial instruments. Whether you're a seasoned trader or just starting, this tool provides valuable insights into market trends and potential trading opportunities.
Key Features:
1. Versatility in Symbol Selection:
- Choose from a wide range of symbols for comparison, including popular indices like XAUUSD and SPX.
- Seamlessly toggle between symbols to analyze divergences and make informed trading decisions.
2. Flexible Calculation Options:
- Customizable options allow you to use a different symbol for calculation instead of the chart symbol.
- Fine-tune your analysis by selecting specific symbols for comparison based on your trading preferences.
3. Logarithmic Scale Analysis:
- Utilizes logarithmic scales for accurate representation of price movements.
- Linear regression coefficients are calculated on the logarithmic scale, providing a comprehensive view of trend strength.
4. Dynamic Length and Smoothing:
- Adjust the length parameter to adapt the indicator to different market conditions.
- Smoothed linear regression with exponential moving averages enhances clarity and reduces noise.
5. Standard Deviation Normalization:
- Normalizes standard deviations over 200 periods, offering a standardized view of price volatility.
- Easily compare volatility levels across different symbols for effective divergence analysis.
6. Color-Coded Divergence Visualization:
- Clearly distinguish positive and negative divergences with customizable color options.
- Visualize divergence deltas with an intuitive color scheme for quick and effective interpretation.
7. Symbol Information Table:
- An included table provides at-a-glance information about the selected symbols.
- Identify Symbol 1 and Symbol 2, along with their corresponding positive and negative divergence colors.
How to Use:
1. Select symbols for analysis using the user-friendly inputs.
2. Customize calculation options based on your preferences.
3. Analyze the divergence delta plot for clear visual indications.
4. Refer to the symbol information table for a quick overview of selected instruments.
Empower your trading strategy with the Divergence Analyzer and gain a competitive edge in the dynamic world of financial markets. Start making more informed decisions today!

Sector relative strength and correlation by KaschkoThis script provides a quick overview of the relative strength and correlation of the symbols in a sector by showing a line chart of the close prices on a percent scale with all symbols starting at zero at the left side of the chart. It allows a great deal of flexibility in the configuration of the sectors and symbols in it. The standard preset sectors cover the most important futures markets and their symbols.
However, up to ten sectors with up to ten symbols each can be freely configured. Each sector is defined by a single line that has the following format:
Sector name:Symbol suffix:List of comma separated symbols
For example, the first predefined sector is defined as follows.
Energies:1!:CL,HO,NG,RB
1. The name of the sector is "Energies"
2. The suffix is "1!", i.e., to each symbol in the list "1!" is appended to get the continous future for the given symbol root. When using stock, forex or other symbols, simply leave the suffix empty.
3. The list of comma separated symbols is "CL,HO,NG,RB", i.e. crude oil, heating oil, natural gas and gasoline. As the suffix is "1!", the actual symbols whose prices are shown are "CL1!","HO1!","NG1!" and "RB1!"
You can choose to use settlement-as-close and back-adjusted contracts. The sector can also be determined automatically ("Auto-select"). In this case, it is determined to which sector the symbol currently displayed in the main chart belongs and the script displays it in the context of the other symbols in the sector.
By selecting a suitable chart time frame and time range, you can quickly determine which symbols in the sector are stronger or weaker and which are more or less strongly correlated.
The following symbols are best suited for a quick trial, as the sectors are preset for these:
CL1!,ES1!,6A1!,6B1!,6c1!,6E1!,6J1!,6M1!,6N1!,6S1!,GC1!,GF1!,HE1!,HG1!,HO1!,LBR1!,LE1!,NG1!,NQ1!,PA1!,PL1!,RB1!,SI1!,YM1!,ZB1!,ZC1!,ZF1!,ZL1!,ZM1!,ZN1!,ZO1!,ZR1!,ZS1!,ZT1!,ZW1!,CC1!,CT1!,DX1!,KC1!,OJ1!,SB1!,RTY1!
You can also use the script to compare any symbols (e.g. different shares) with each other. Preferably use the "Custom" sector for this.

Easy To Trade indicatorAbstract
This script evaluates how easy for traders to trade.
This script computes the level that the gains were distributed in many trading days.
We can use this indicator to decide the instruments and the time we trade.
Introduction
Why we think the trading markets are boring?
It is because most of the gains were concentrated in a few trading days.
We look for instruments we can buy at support and sell at resistance frequently and repeatedly.
However, it does not happen usually because it is difficult to find sellers sell at support and buyers buy at resistance.
This script is a method to measure if an instrument is difficult to trade.
If most of the gains were concentrated in a few trading days, this script says it is difficult to trade.
If gains were distributed in many trading days and we can buy low and sell high repeatedly, this script says it is easy to trade.
Therefore, this script measure how difficult for us to trade by the ratio between the area of value and the total gain.
How it works
1. Determine the instruments and time frames we are interested in.
2. Determine how many days this script evaluate the result. This number may depend on how many days from you buy in to you sell out.
3. If the instrument you choose is easy to trade, this script reports higher values.
4. If the instrument is long term bullish, the number "easy to invest" is usually higher than the number "easy to short" .
5. We can consider trade instruments which are easier to trade than others.
6. We can consider wait until the period that it is difficult to trade has past or keep believing that some instruments are easier to trade than others.
Parameters
x_src = The price for each trading day this script use. It may be open , high , low , close or their combination.
x_is_exp = Whether this script evaluate the price movement in exponential or logarithm. You are advised to answer yes if the price changes drastically.
x_period = How many days this script evaluate the result.
Conclusion
With this indicator , we have data to explain how easy or difficult an instrument is for traders . In other words , if we hear some people say the trading markets are boring or difficult for traders , we can use this indicator to verify how accurate their comments are.
With this explainable analysis , we have more knowledge about which instruments and which sessions are relative easy for us to buy low and sell high repeatedly and frequently , we can have better proceeding than buy and hold simply.

SFC Valuation Model - RelativeComparable company analysis, or “Comps” for short, is commonly used to value firms by comparing them to publicly traded companies with similar business operations. An analyst will compare the current share price a public company relative to some metric such as its earnings to derive a P/E ratio. It will then use that ratio to value the company it is trying to determine the worth of.
One of the most popular relative valuation multiples is the price-to-earnings (P/E) ratio. It is calculated by dividing stock price by earnings per share (EPS), and is expressed as a company's share price as a multiple of its earnings. A company with a high P/E ratio is trading at a higher price per dollar of earnings than its peers and is considered overvalued. Likewise, a company with a low P/E ratio is trading at a lower price per dollar of EPS and is considered undervalued. This framework can be carried out with any multiple of price to gauge relative market value. Therefore, if the average P/E for an industry is 10x and a particular company in that industry is trading at 5x earnings, it is relatively undervalued to its peers.
Limitations
Like any valuation tool, relative valuation has its limitations. The biggest limitation is the assumption that the market has valued the business correctly.
Second, all valuation metrics are based on past performance. Investors' perceptions of future performance heavily influence stock prices and most relative valuation metrics don’t account for growth.
Finally and most importantly, relative valuation is no assurance that the "cheaper" company will outperform its peer.
With this indicator, investors can easily compare a few companies and find the outlier. It calculates the average for the sector and highlights the stock that is above the average.
Due to some limitations, the indicator can only compare 5 tickers, but users can always load it twice for more stocks.
Save hours of data entry into Excel spreadsheets to compare stocks !
There are few valuation methods/steps
- Macroeconomics - analyse the current economic;
- Define how the sector is performing;
- Relative valuation method - compare few stocks and find the Outlier;
- Absolute valuation method historically- define how the stock performed in the past;
- Absolute valuation method - define how the stock is performed now and find the fair value;
- Technical analysis
How to use:
1. Once you have completed the initial evaluation steps, simply load the indicator.
2. Add the forwarded EPS.
3. The indicator will do the rest of the calculations for you.
