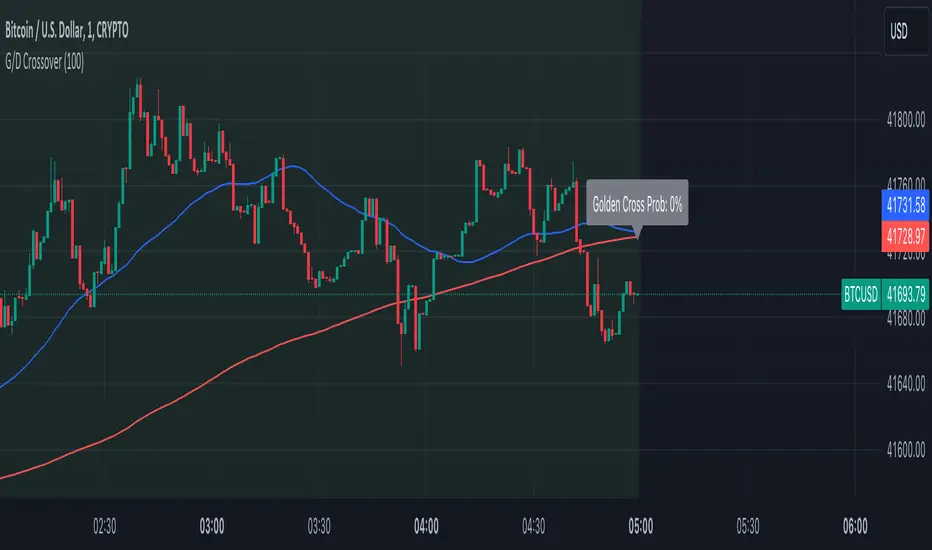
Golden Cross and Death Cross with ProbabilityThe Advanced Golden and Death Crossover Indicator offers traders a powerful tool for identifying potential buy and sell signals through the classic technical analysis method of moving average crossovers. This script enhances decision-making by dynamically changing the chart background color in response to Golden (bullish) and Death (bearish) crossovers, providing a visual representation of the market's momentum.
Features:
Golden and Death Crossover Detection: Utilizes a 50-period SMA and a 200-period SMA to identify potential buy (golden cross) and sell (death cross) points.
Continuous Background Coloring: Changes the chart's background color to green for golden crosses and red for death crosses, offering an intuitive grasp of market trends.
Customizable Lookback Period: Allows users to adjust the lookback period for calculating the success rate of each crossover, making the indicator adaptable to various trading strategies.
Success Rate Calculation: Provides an additional layer of analysis by calculating the historical success rate of crossovers within the specified lookback period.
Instructions:
Adding the Indicator: Search for "Advanced Golden and Death Crossover Indicator" in the TradingView Indicators & Strategies library and add it to your chart.
Customization: Access the indicator settings to adjust the lookback period according to your trading preferences.
Interpretation: Use the continuous background color as a guide to market conditions, with green indicating bullish momentum and red indicating bearish momentum. The success rate of past crossovers can help assess the reliability of the signals.
How the Script Works:
The Advanced Golden and Death Crossover Indicator operates by continuously monitoring two key moving averages (MAs) on your chart: a short-term (50-period) SMA and a long-term (200-period) SMA. Here's a step-by-step breakdown of its functionality:
Crossover Detection:
Golden Cross: When the short-term MA crosses above the long-term MA, indicating potential bullish momentum, the script identifies this as a Golden Cross signal.
Death Cross: Conversely, when the short-term MA crosses below the long-term MA, suggesting potential bearish momentum, the script flags this as a Death Cross signal.
Background Coloring:
Upon detecting a Golden Cross, the script changes the chart background to green, visually representing a bullish market condition.
Upon detecting a Death Cross, the chart background turns red, indicating bearish market conditions.
This color change remains in effect until the next crossover event, providing a continuous visual cue of the market's trend direction.
Success Rate Calculation:
The script calculates the historical success rate of these crossovers within a user-defined lookback period. This metric helps assess the reliability of the signals based on past performance.
Customization:
Users have the flexibility to adjust the lookback period for the success rate calculation, allowing for customization according to individual trading strategies and risk preferences.
Application in Trading Analysis:
Traders can use this indicator as part of their technical analysis toolkit to make informed decisions about entry and exit points. The visual cues from the continuous background coloring, combined with the success rate of past signals, provide a comprehensive overview of market trends and crossover reliability. It’s important for traders to combine this indicator with other analysis tools and consider broader market conditions to optimize their trading strategy.
Disclaimer:
This script is provided for educational and informational purposes only and should not be construed as investment advice. Trading involves risk, and you should conduct your own research or consult a financial advisor before making investment decisions. The author or distributor of this script bears no responsibility for any trading losses incurred by users.
Crossover
Price Cross Time Custom Range Interactive█ OVERVIEW
This indicator was a time-based indicator and intended as educational purpose only based on pine script v5 functions for ta.cross() , ta.crossover() and ta.crossunder() .
I realised that there is some overlap price with the cross functions, hence I integrate them into Custom Range Interactive with value variance and overlap displayed into table.
This was my submission for Pinefest #1 , I decided to share this as public, I may accidentally delete this as long as i keep as private.
█ INSPIRATION
Inspired by design, code and usage of CAGR. Basic usage of custom range / interactive, pretty much explained here . Credits to TradingView.
█ FEATURES
1. Custom Range Interactive
2. Label can be resize and change color.
3. Label show tooltip for price and time.
4. Label can be offset to improve readability.
5. Table can show price variance when any cross is true.
6. Table can show overlap if found crosss is overlap either with crossover and crossunder.
7. Table text color automatically change based on chart background (light / dark mode).
8. Source 2 is drawn as straight line, while Source 1 will draw as label either above line for crossover, below line for crossunder and marked 'X' if crossing with Source 2's line.
9. Cross 'X' label can be offset to improve readability.
10. Both Source 1 and Source 2 can select Open, Close, High and Low, which can be displayed into table.
█ LIMITATIONS
1. Table is limited to intraday timeframe only as time format is not accurate for daily timeframe and above. Example daily timeframe will give result less 1 day from actual date.
2. I did not include other sources such external source or any built in sources such as hl2, hlc3, ohlc4 and hlcc4.
█ CODE EXPLAINATION
I pretty much create custom function with method which returns tuple value.
method crossVariant(float price = na, chart.point ref = na) =>
cross = ta.cross( price, ref.price)
over = ta.crossover( price, ref.price)
under = ta.crossunder(price, ref.price)
Unfortunately, I unable make the labels into array which i plan to return string value by getting the text value from array label, hence i use label.all and add incremental int value as reference.
series label labelCross = na, labelCross.delete()
var int num = 0
if over
num += 1
labelCross := label.new()
if under
num += 1
labelCross := label.new()
if cross
num += 1
labelCross := label.new()
I realised cross value can be overlap with crossover and crossunder, hence I add bool to enable force overlap and add additional bools.
series label labelCross = na, labelCross.delete()
var int num = 0
if forceOverlap
if over
num += 1
labelCross := label.new()
if under
num += 1
labelCross := label.new()
if cross
num += 1
labelCross := label.new()
else
if cross and over
num += 1
labelCross := label.new()
if cross and under
num += 1
labelCross := label.new()
if cross and not over and not under
num += 1
labelCross := label.new()
█ USAGE / EXAMPLES

Trend Line XrossTrend Line Xross (TLX) Uses User Input Points to draw trendlines and displays the exact intersection point of those trendlines.
This is the public indicator of the practical application for this intersection method included in my entry for Pinefest #1.
To determine the exact intersection point I am using the y-intercept method as seen below.
The code is notated for more information on the technical workings.
One difference to note between this version and the pinefest version is that I had to change the line drawings to use bar_index values so that I can use line.get_price() to grab the current value of the line to make alerts from.
Additionally, there are alerts built-in to this version for every type of cross on all of the visible lines.
Enjoy!

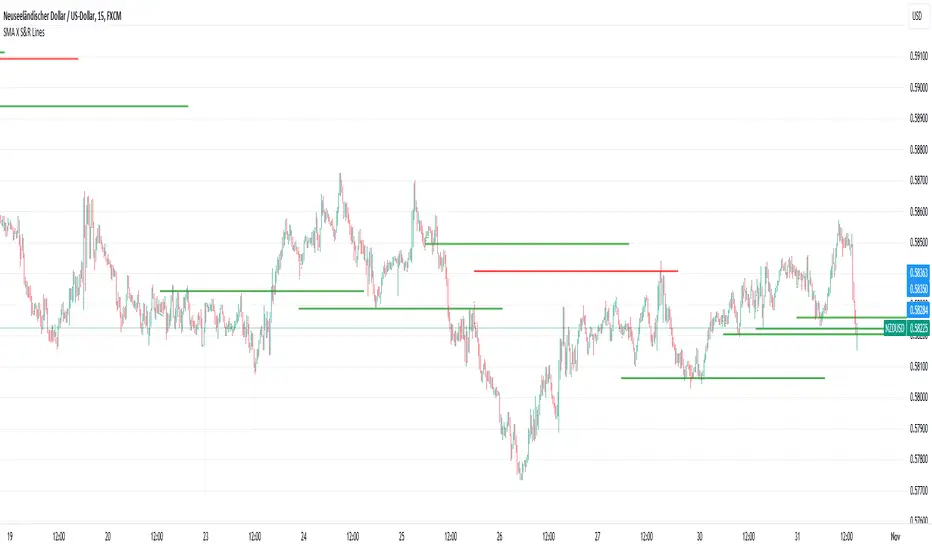
SMA Crossover Support & Resistance [Rami_LB]This indicator draws a horizontal line on the price chart at the point where two pre-defined SMA (Simple Moving Average) lines intersect. It is most useful for identifying crossed SMA lines on the 1-hour chart and then trading on smaller chart intervals.
For optimal performance, it is recommended to customize the values of the SMA lines individually for each currency pair, as these values can vary from one pair to another. To do this, switch to the 1-hour chart and adjust the SMA parameters until you visually observe that these settings would yield favorable results based on historical data. Certainly, you can also adjust the length of the lines accordingly when you switch from the 1-hour chart to smaller timeframes.
Please note that this indicator allows traders to visually identify potential trend changes and crossovers between short-term and long-term moving averages, aiding in decision-making for trading strategies.
Hull WavesThe Hull Waves indicator is based on the Hull Moving Averages (HMA), which are special moving averages that stand out for their ability to filter out market noise and offer a clearer view of price trends. Compared to traditional moving averages, HMAs are more responsive yet smoother, allowing traders to capture significant price movements without getting overwhelmed by short-term fluctuations.
The HMAs integrated into Hull Waves provide two distinct perspectives on the price trend:
8-period HMA: This short-term HMA is extremely reactive and closely follows price changes. It is ideal for capturing short-term trading signals while the medium-term 21-period HMA offers a more balanced view of price trends and identifies medium-term trends.
By crossing HMAs, traders can efficiently identify trend reversal points or strong market continuations.
Another feature of the indicator is the “fan” of dynamic lines, which acts as a visual float for price candles, allowing traders to quickly evaluate trading opportunities.
The "fan" or float of dynamic lines represents a visual representation of the candle's price movements. These lines extend from the start point to the end point, like an open fan. This visual approach makes the market dynamics immediately evident.
Strategy:
Long Entry Signal (Buy):
When the Hull Waves range shows a series of upward sloping lines and the Hull Moving Averages (e.g. 8-period HMA) crosses the 21-period HMA upwards, it is a long entry signal.
Confirmation of the signal can come from an increase in trader volume or other supporting indicators.
Place a buy order at the next closing price.
Short Entry Signal (Sell):
When the Hull Waves range shows a series of downward sloping lines and the Hull Moving Averages (e.g. 8-period HMA) crosses the 21-period HMA downward, it is a short entry signal.
Confirm the signal with an increase in trader volume or other relevant indicators.
Place a sell order at the next closing price.
Exit Signal (Closing a Position):
To close a long position, wait for a signal reversal, such as the Hull Moving Averages crossing downwards or a change in the Hull Waves range.
To close a short position, wait for a signal reversal, such as the Hull Moving Averages crossing higher or a change in the Hull Waves range.

Linear Cross Trading StrategyLinear Cross Trading Strategy
The Linear Cross trading strategy is a technical analysis strategy that uses linear regression to predict the future price of a stock. The strategy is based on the following principles:
The price of a stock tends to follow a linear trend over time.
The slope of the linear trend can be used to predict the future price of the stock.
The strategy enters a long position when the predicted price crosses above the current price, and exits the position when the predicted price crosses below the current price.
The Linear Cross trading strategy is implemented in the TradingView Pine script below. The script first calculates the linear regression of the stock price over a specified period of time. The script then plots the predicted price and the current price on the chart. The script also defines two signals:
Long signal: The long signal is triggered when the predicted price crosses above the current price.
Short signal: The short signal is triggered when the predicted price crosses below the current price.
The script enters a long position when the long signal is triggered and exits the position when the short signal is triggered.
Here is a more detailed explanation of the steps involved in the Linear Cross trading strategy:
Calculate the linear regression of the stock price over a specified period of time.
Plot the predicted price and the current price on the chart.
Define two signals: the long signal and the short signal.
Enter a long position when the long signal is triggered.
Exit the long position when the short signal is triggered.
The Linear Cross trading strategy is a simple and effective way to trade stocks. However, it is important to note that no trading strategy is guaranteed to be profitable. It is always important to do your own research and backtest the strategy before using it to trade real money.
Here are some additional things to keep in mind when using the Linear Cross trading strategy:
The length of the linear regression period is a key parameter that affects the performance of the strategy. A longer period will smooth out the noise in the price data, but it will also make the strategy less responsive to changes in the price.
The strategy is more likely to generate profitable trades when the stock price is trending. However, the strategy can also generate profitable trades in ranging markets.
The strategy is not immune to losses. It is important to use risk management techniques to protect your capital when using the strategy.
I hope this blog post helps you understand the Linear Cross trading strategy better. Booost and share with your friend, if you like.

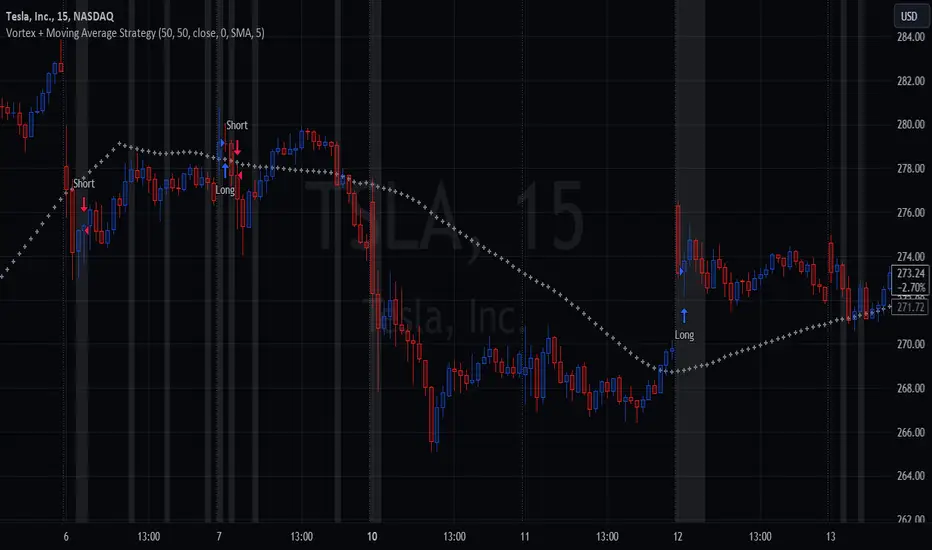
Vortex Cross w/MA ConfirmationThis script is a trading strategy that combines the Vortex Indicator and a Moving Average (MA) to generate potential entry signals for long and short positions.
1. Vortex Indicator:
The Vortex Indicator consists of two lines: Vortex Positive (VIP) and Vortex Negative (VIM). It is designed to identify trend direction and measure the strength of a trend.
2. Moving Average (MA):
The script uses a chosen type of Moving Average (SMA, EMA, SMMA, WMA, or VWMA) to smooth the price data. The smoothed line is referred to as the "Smoothing Line."
3. Determine Long and Short Conditions:
The script looks for potential long entry signals when VIP crosses above VIM, highlighting each crossover on the chart, and the closing price is above the Smoothing Line. It searches for short entry signals when VIM crosses above VIP, with the closing price is below the Smoothing Line. When the long or short conditions are met, the strategy enters either a long or short position accordingly.
Potential Usage:
The strategy can be utilized in trending markets, where the Vortex Indicator helps identify trend direction and strength, and the Moving Average smooths the price data to filter out some noise. It aims to capture trends and ride them while avoiding false signals during choppy or sideways markets.
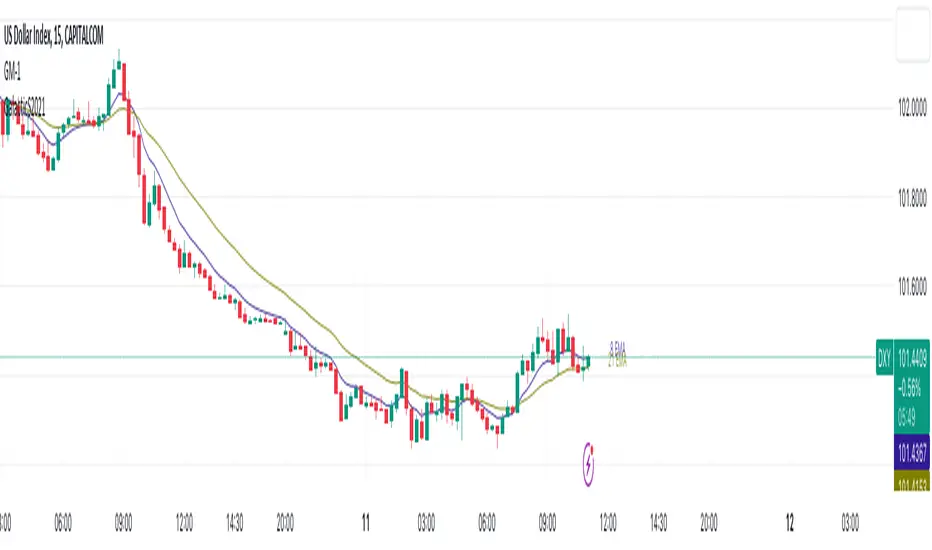
gFancyMALibrary "GalacticS2021"
printLbl(y, x, c, m, b)
Parameters:
y (float)
x (int)
c (color)
m (string)
b (bool)
Moving Average - TREND POWER v1.1- (AS)0)NOTE:
This is first version of this indicator. It's way more complicated than it should be. Check out Moving Average-TREND POWER v2.1-(AS), its waaaaay less complicated and might be better.Enjoy...
1)INTRODUCTION/MAIN IDEA:
In simpliest form this script is a trend indicator that rises if Moving average if below price or falling if above and going back to zero if there is a crossover with a price. To use this indicator you will have to adjust settings of MAs and choose conditions for calculation.
While using the indicator we might have to define CROSS types or which MAs to use. List of what cross types are defined in the script and Conditiones to choose from.The list will be below.
2) COMPOSITION:
-MA1 can be defined by user in settings, possible types: SMA, EMA, RMA, HMA, TEMA, DEMA, LSMA, WMA.
-MA2 is always ALMA
3) OVERLAY:
Default is false but if you want to see MA1/2 on chart you can change code to true and then turn on overlay in settings. Most plot settings are avalible only in OV=false.
if OV=true possible plots ->MA1/2, plotshape when choosen cross type
if OV=false -> main indicator,TSHs,Cross counter
4)PRESETS :
Indicator has three modes that can be selected in settings. First two are presets and do not require selecting conditions as they set be default.
-SIMPLE - most basic
-ABSOLUTE - shows only positive values when market is trending or zero when in range
-CUSTOM - main and the most advanced form that will require setting conditions to use in calculating trend
4.1)SIMPLE – this is the most basic form of conditions that uses only First MA. If MA1 is below selected source (High/Low(High for Uptrend and Low for DNtrend or OHLC4) on every bar value rises by 0.02. if it above Low or OHLC4 it falls by 0.02 with every bar. If there is a cross of MA with price value is zero. This preset uses CROSS_1_ULT(list of all cross types below)
4.2) ABSOLUTE – does not show direction of the trend unlike others and uses both MA1 and MA2. Uses CROSS type 123_ULT
4.3) CUSTOM – here we define conditions manually. This mode is defined in parts (5-8 of description)
5)SETTINGS:
SOURCE/OVERLAY(line1) – select source of calculation form MA1/MA2, select for overlay true (look point 3)
TRESHOLDS(line2). – set upper and lower THS, turn TSHs on/off
MA1(line3) – Length/type of MA/Offset(only if MA type is LSM)
MA2(line4) – length/offset/sigma -(remember to set ma in the way that in Uptrend MA2MA1 in DNtrend)
Use faster MA types for short term trends and slower types / bigger periods for longer term trends, defval MA1/2 settings
are pretty much random so using them is not recomended.
CROSSshape(line5) – choose which cross type you want to plot on chart(only in OV=true) or what type you want to use in counting via for loops,
CROSScount(line6) – set lookback for type of cross choosen above
BOOLs in lines 5 and 6 - plotshape if OV=true/plot CROSScount histogram (if OV=false)
Lines 7 and 8 – PRESET we want to use /SRC for calculation of indicator/are conditions described below/which MAs to use/Condition for
reducing value t 0 - (if PRESET is ABSOLUTE or SIMPLE only SRC should be set(Line 8 does not matter if not CUSTOM))
5)SOURCE for CONDS:
Here you can choose between H/L and OHLC. If H/L value grow when MAlow. If OHLC MAOHLC. H/L is set by default and recommended. This can be selected for all presets not only CUSTOM
6)CROSS types LIST:
“1 means MA1, 2 is MA2 and 3 I cross of MA1/MA2. L stands for low and H for high so for example 2H means cross of MA2 and high”
NAME -DEFINITION Number of possible crosses
1L - cross of MA1 and low 1
1H - cross of MA1 and high 1
1HL - cross of MA1 and low or MA1 and high 2 -1L/1H
2L - cross of MA2 and low 1
2H - cross of MA2 and high 1
2HL - cross of MA2 and low or MA1 and high 2 -2L/2H
12L - cross of MA1 and low or MA2 and low 2 -1L/2L
12H - cross of MA1 and high or MA2 and high 2 -1H/2H
12HL - MA1/2 and high/low 4 -1H/1L/2H/2L
3 -cross of MA1 and MA2 1
123HL -crosses from 12HL or 3 5 -12HL/3
1_ULT - cross of MA1 with any of price sources(close,low,high,ohlc4 etc…)
2_ULT - cross of MA2 with any of price sources(close,low,high,ohlc4 etc…)
123_ULT – all crosses possible of MA1/2 (all of the above so a lot)
7)CRS CONDS:
“conditions to reduce value back to zero”
>/< - 0 if indicator shows Uptrend and there’s a cross with high of selected MA or 0 if in DNtrend and cross with low. Better for UP/DN trend detection
ALL – 0 if cross of MA with high or low no matter the trend, better for detecting consolidation
ULT – if any cross of selected MA, most crosses so goes to 0 most often
8)MA selection and CONDS:
-MA1: only MA1 is used,if MA1 below price value grows and the other way around
MA1price =-0.02
-MA2 – only MA2 is used, same conditions as MA1 but using MA2
MA2price =-0.02
-BOTH – MA1 and MA2 used, grows when MA1 if below, grows faster if MA1 and MA2 are below and fastest when MA1 and MA2 are below and MA2price=-0.02
-MA1 and MA2 >price=-0.03
-MA1 and MA2 ?price and MA2>MA1=-0.04
9)CONDITIONS SELECTION SUMMARRY:
So when CUSTOM we choose :
1)SOURCE – H/L or OHLC
2)MAs – MA1/MA2/BOTH
3)CRS CONDS (>/<,ALL,ULT)
So for example...
if we take MA1 and ALL value will go to zero if 1HL
if MA1 and >/< - 0 if 1L or 1H (depending if value is positive or negative).(1L or 1H)
If ALL and BOTH zero when 12HL
If BOTH and ULT value goes back to zero if Theres any cross of MA1/MA2 with price or cross of MA1 and MA2.(123_ULT)
If >/< and BOTH – 0 if 12L in DNtrend or 12H if UPtrend
10) OTHERS
-script was created on EURUSD 5M and wasn't tested on different markets
-default values of MA1/MA2 aren't optimalized so do not
-There might be a logical error in the script so let me know if you find it (most probably in 'BOTH')
-thanks to @AlifeToMake for help
-if you have any ideas to improve let me know
-there are also tooltips to help

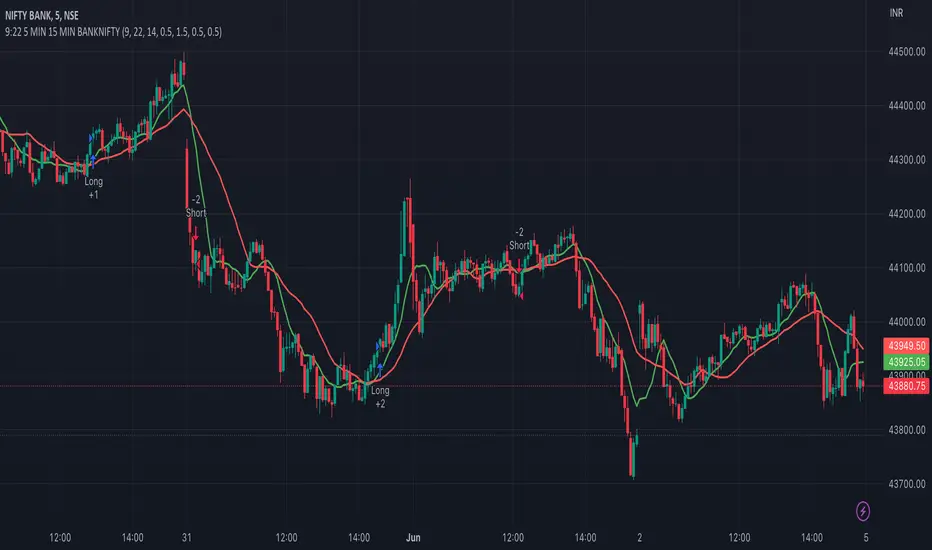
9:22 5 MIN 15 MIN BANKNIFTY9:22 5 MIN 15 MIN BANKNIFTY Strategy with Additional Filters
The 9:22 5 MIN 15 MIN BANKNIFTY Strategy with Additional Filters is a trend-following strategy designed for trading the BANKNIFTY instrument on a 5-minute chart. It aims to capture potential price movements by generating buy and sell signals based on moving average crossovers, breakout confirmations, and additional filters.
Key Features:
Fast MA Length: 9
Slow MA Length: 22
ATR Length: 14
ATR Filter: 0.5
Trailing Stop Percentage: 1.5%
Pullback Threshold: 0.5
Minimum Candle Body Percentage: 0.5
Use Breakout Confirmation: Enabled
Additional Filters:
Volume Threshold: Set a minimum volume requirement for trades.
Trend Filter: Optionally enable a trend filter based on a higher timeframe moving average.
Momentum Filter: Optionally enable a momentum filter using the RSI indicator.
Support/Resistance Filter: Optionally enable a filter based on predefined support and resistance levels.
Buy and Sell Signals:
Buy Signal: A buy signal is generated when the fast moving average crosses above the slow moving average, with additional confirmation from breakout and volume criteria, along with optional trend, momentum, and support/resistance filters.
Sell Signal: A sell signal is generated when the fast moving average crosses below the slow moving average, with similar confirmation and filtering criteria as the buy signal.
Exit Strategy:
The strategy employs a trailing stop-loss mechanism based on a percentage of the average entry price. The stop-loss is dynamically adjusted to protect profits while allowing for potential upside.
Please note that this strategy should be thoroughly backtested and evaluated in different market conditions before applying it to live trading. It is also recommended to adjust the parameters and filters according to individual preferences and risk tolerance.
Feel free to customise and adapt the description as needed to suit your preferences and the specific details of your strategy.
TrendLine I3-TLIdea:
Draw a trendline that can set an alert every time the price cross over/under.
Concept:
(Note that we take the close to get the closing price).
-Determine the coordinates of 2 points of the line AB: A(x1;y1); B(x2;y2).
-Apply Oxy geometry to the chart with price as Oy axis, time as Ox axis. Use linear equations to determine:
+If point's x > line's x, the point is to the right of the line.
+If point's x < line's x, the point is to the left of the line.
+If point's x == line's x, the point is on the line.
-Determine when the price is crossOver or crossUnder the trend line, display that time on the chart and send an alert.
How it works:
1. Input value to config the line by manually:
- Y1: Price 1 as point 1.
- X1: Time at point 1.
- Y2: Price 2 as point 2.
- X2: Time at point 2.
X2 (To date) must be after X1 (From date).
Please consider time (hour, minute) if timeframe < 1hour.
Then draw a line on the pouring table with straight line AB as solid line, extended line as broken line. Logic will start from dashed line (To date in input).
If the price changes value from side to side of the line, show the text label, change the background color accordingly (blue top, red bottom),
also sends an alert ("CrossUnder"; "CrossOver").
2. The indicator's operating range is limited to 500 bars from the "From date" bar. When reaching to the outside, it will show a yellow warning with outbound message.
3. Set alert for this indicator, it will send alert follow 1. condition.
Suitable time frames:
5m, 15m, 1h, 4h, 1D
* Please note that this logic does not attempt to predict future prices or 100% accurate signal.
This is FREE indicator.
(Please direct message or visit website if you want to try another invite-only indicators)
Hope you guys enjoy!
Examples:
GOLD 1D
EURUSD 1H

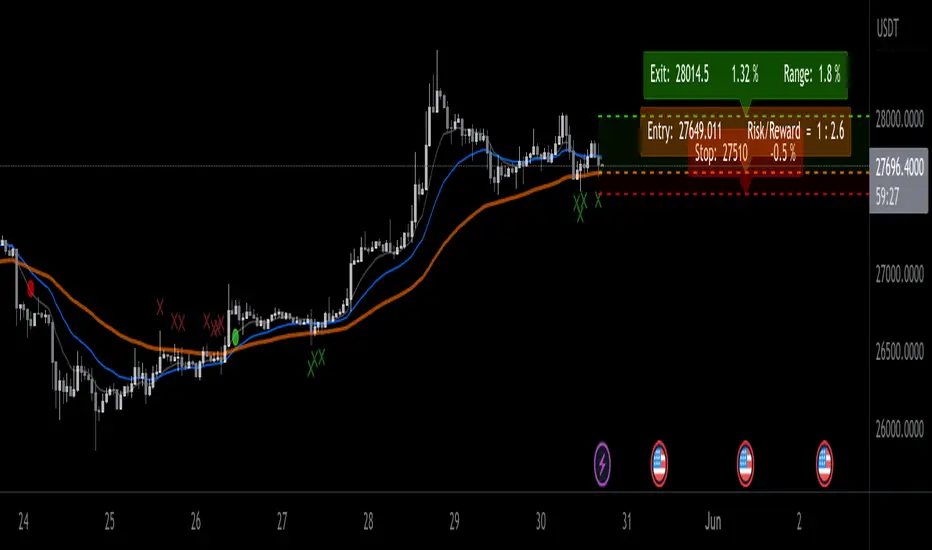
EMA ProHi Traders!
This Improved EMA Cross Pro Indicator does a few things that Ease Up Our Charting.
Personally it Saved me Tons of Time searching for structure highs / lows, measuring ranges and distances from my entry to stop or take profit.
It's like having most of your trade in front of you, charted for you.
Works Across Assets & Time Frames.
The Functions
1. Signals EMA Crosses - green for Bull Cross & Red for Bear Cross
2. Signals Touches to the 55 EMA
a. In a Bull Cross it will only signal touches and closes Above the 55
b. In a Bear Cross it will only signal touches and closes Under the 55
3. Plots Current Horizontals:
a. The current position of the 55
b. The last High & Low
4. Calculation:
a. % from the 55 to the High & Low
b. Risk / Reward Ratio ("Bad Risk Management" message appears if ratio is not favorable)
c. Over Range between the Low and the High
5. Labels - Current prices for all horizontals marked as Entry, Exit & Stop
Notes:
* This Indicator is Interchanging between bull and bear crosses, it recognizes the trend and adapts its high and low output.
* You Can and Should make your personal changes. everything can be changed in the settings inputs.
* You can Turn On & Off most functions in the settings inputs.
BYBIT:BTCUSDT.P
Rainbow Collection - VioletMoving averages come in all shapes and types. The most basic type is the simple moving average which is simply the sum divided by the quantity. Therefore, the simple moving average is the sum of the values divided by their number.
In technical analysis, you generally use moving averages to understand the underlying trend and to find trading signals. In the case of the Violet indicator, we are using a Hull moving average which is a special variation based on different weights to minimize lag.
The Violet indicator is therefore used as follows:
* A bullish signal is generated whenever the close price surpasses the 20-period Hull moving average while the previous close prices from periods were all below their respective Hull moving average of the period.
*A bearish signal is generated whenever the close price breaks the 20-period Hull moving average while the previous close prices from periods were all above their respective Hull moving average of the period.
The aim of the Violet indicator is to capture reversals as early as possible through a combination of lagged conditions based on the Fibonacci sequence.

Crossing TableCrossing Table V1
I created this indicator as it had been asked for a number of times to create a crossover/under table screen and here it is!!!
The indicator is set up to be selected from SMA, EMA and Volume.
The SMA is defaulted to 2/10 but it is customizable to whatever SMA you choose to use.
Volume is based off a volume formula and the volume settings in the indicators settings, and the table will show either buyers/sellers on the last candle on the volume in the settings.
Just like the SMA the EMA option will be based off the default value of 5/13 but can be customized to your choosing.
If there are any question or comments just let me know :)

MA Band Distance Monitor'MA Band Distance Monitor' indicator is a simple tool for traders who rely on moving averages to make trading decisions. This indicator plots two moving averages of your choice (you can select the type of the moving average), and fills the space between them, creating a "band".
The indicator also generates a table that displays the current price distance from both the fast and slow moving averages, as well as the average of the two. This allows you to quickly assess the strength of the trend and potential entry or exit points.
In addition, the table also shows the average price distance from one to another MA and also the current distance between them, allowing you to compare the current price action to the historical average. This information can help you identify potential trend reversals and assess the overall health of the market.
*** Slow length input must be greater than fast length input, otherwise indicator will produce faulty results

Price Cross ━ [whvntr]This oscillator is an attractive way to view hidden price divergence... The formula originated from the Lark, but I have cleanly displayed this information. When the two moving averages (ema) cross with a simple moving average, you find the hidden price divergence. What kind of market should you use this in? It works well when a trend is already established.
Disclaimer: This indicator does not constitute investment advice. Trade at your own
risk with this method of identifying hidden price divergence.

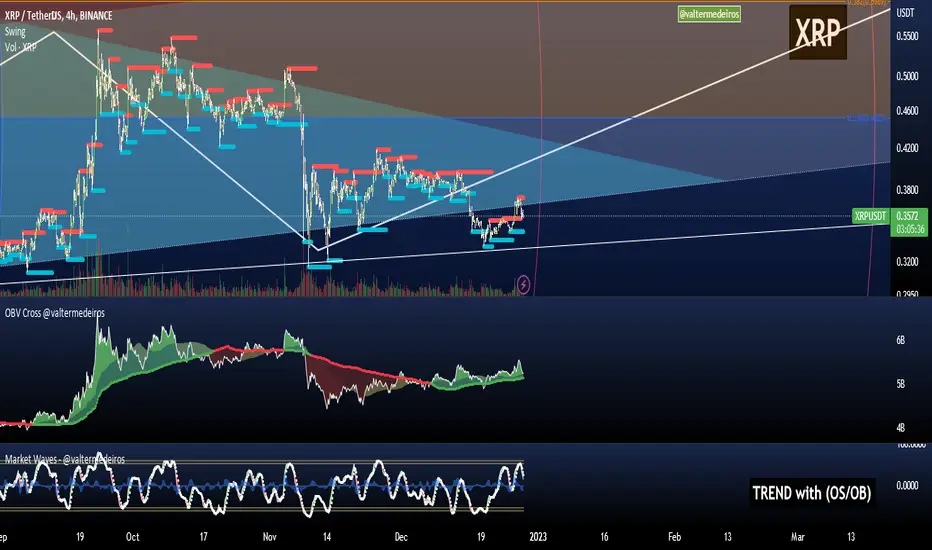
On Balance Volume CrossoversCheck on balance volume but with crossover. You can choose the smoothing method, which is set by default to use the Volume Weighted Moving Average (bringing volume to the equation is always a good idea) but you can change to SMA, MA, EMA, ...
Hope you guys enjoy it and don't forget to rate it up! :)
I plan to include % from 0-100 OBV in here later! Stay tuned.
Feedback is cool.
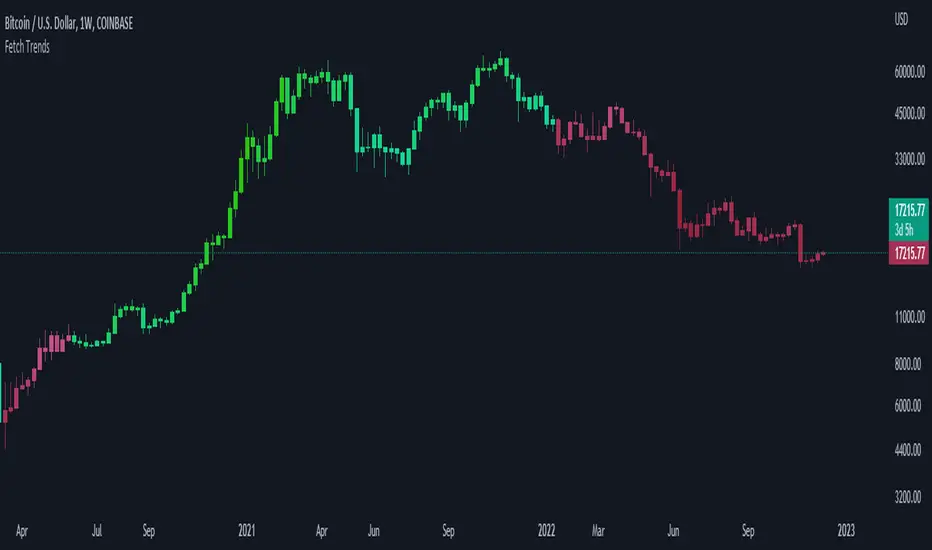
Fetch TrendsThis indicator can be used as a tool to measure the strength of the current trend. It is also trying to achieve to alert traders on when a trend can shift.
In order to achieve this, it uses three simple indicators:
1: 9 Simple moving average
2: 50 Simple moving average
3: Rsi (14)
The moving averages are used to define the current trend of the market, and the rsi is used to measure the strength. We use a color gradient to reach our second goal with this indicator.
The gradient is calculated based on the rsi value, which means the trader can use this indicator to visualize the strength of the current trend. It also helps to alert the trader when the trend starts to shift.
Lets say we use green to signal a strong positive trend, and blue for a weak positive trend. The candles are green in a strong uptrend, and are getting more blue once the trend starts to weaken.
As soon as the trend shifts from bullish to bearish, the bars become a diferent color.
True Momentum OscillatorThe True Momentum Oscillator (TMO) calculates the delta of the price using the open and close. We have taken the true momentum oscillator a step further and have added the momentum of the main signal (TMO) and the smooth signal line. We believe this helps give a clearer picture of price momentum and helps verify crossovers of the TMO and the smooth signal line. The momentum lines can also help confirm a divergence of the TMO. We have also added multiple moving average options so the user can customize the TMO to suit their needs.
TMO- Green when above Smooth Signal Line, red when below Smooth Signal Line
Smooth Signal- Gray Line
Histogram- TMO-Smooth Signal
TMO Momentum- Orange line
Smooth Signal Momentum- Yellow line
Overbought/Oversold regions- Gray highlighted boundaries
The TMO has defined overbought and oversold regions where either a crossover signal or divergence in the oscillator itself can be taken as a signal. Similar to the MACD, a crossover of the zero line by the TMO can also be utilized as a signal.

RedK Magic Ribbon JeetendraGaurCross Over Strategy
Moving average Cross Over Strategy
Please use in 1 minute Expiry

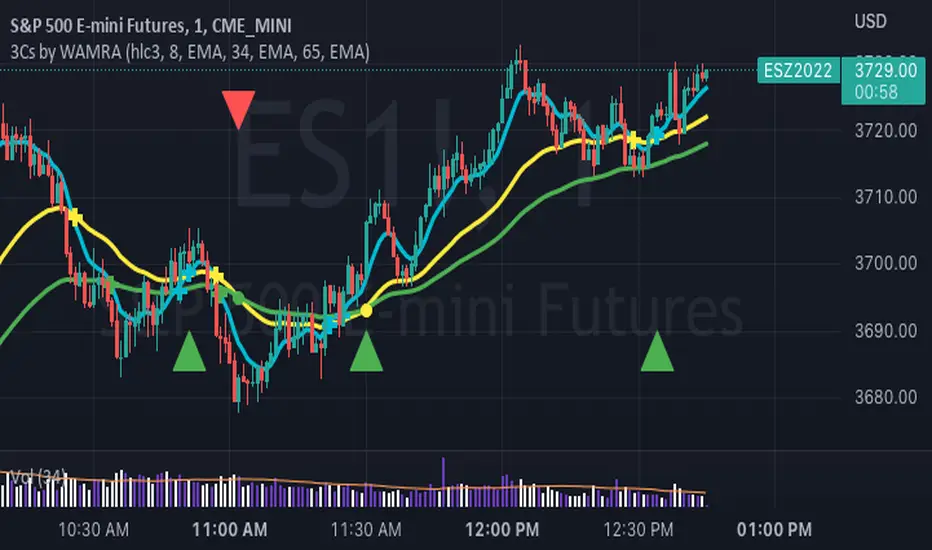
3 Series Cross Indicator with Alerts - by WAMRAThis Indicator allows users to add any 3 combinations of moving averages (SMA, EMA, RMA, RSI, Stochastic RSI, WMA, VWAP ) with granular alert conditions.
Users can alert when all series are in climbing or declining mode.
Crossover Alerts for Yesterday O/H/L/C , Today Vwap [Zero54]This is a very simple script/indicator that trigger alerts every time the script triggers the following conditions.
1) Script crosses yesterday's (previous day's) high
2) Script crosses yesterday's (previous day's) low
3) Script crosses yesterday's (previous day's) open
4) Script crosses yesterday's (previous day's) close
5) Script crosses today's vwap.
I developed this to keep track of the scripts I follow and I find it useful. Hope you will find it useful too.
Steps to use:
1) Open the ticker for which you want to set the alerts.
2) Add this indicator to the chart.
3) Right Click on the text and set choose "Add Alert"
4) After you have done with setting up the alert, feel free to remove the indicator from the chart. It is not necessary for the indicator to be added in the chart in order for it to work.
5) Repeat 1-4 for all the scripts for which you want to set the alerts.
Be advised: During market open, if you have set alerts for multiple scripts, a tsunami of alerts may be triggered.
If you like this alert indicator, please like/boost it. Feel free to re-use this code however you may wish to. Cheers!

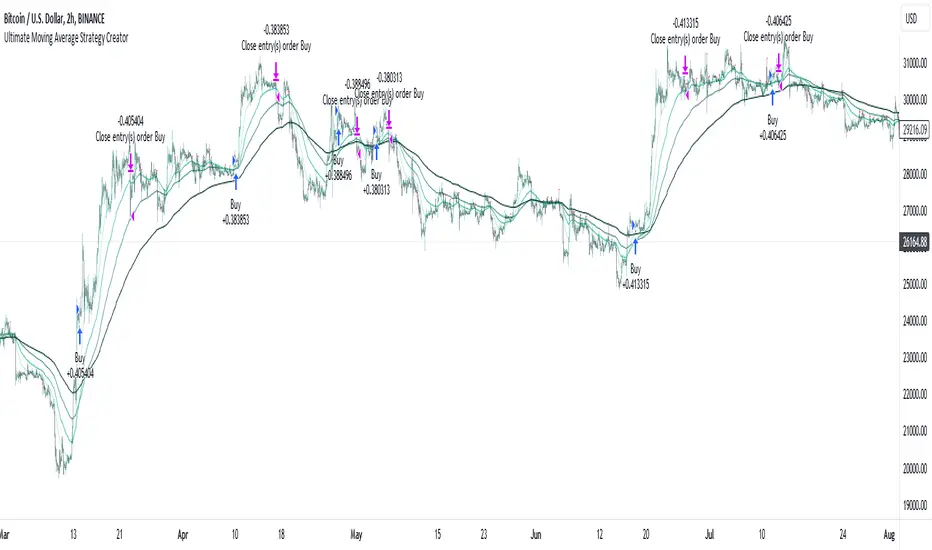
Ultimate Moving Average Strategy CreatorHave you ever wanted to create your OWN strategy, but don't have coding experience? Well now you can.
With simple settings, but millions of potential strategies and combinations, this indicator / strategy lets YOU make ALL the rules.
Start by choosing up to 4 moving averages from all the various types - Simple, Exponential, Hull, Volume-Weighted, etc. Choose the period and choose price source.
Now the fun part.
You select your values to compare and how to compare them. Want to test if the Fast Moving Average crosses over the Slow Moving Average? No problem. Want to add an additional test to check the closing price is greater than the Fast Moving Average? Done.
With additonal options to set take profit % and stop loss %, as well as a date range and the option for 'Long Only' positions, you can instantly see the results of any strategy in the strategy tester, then simply make an adjustment and refine the criteria without having to know or understand any of the complex coding and scripting.
I have tried many popular moving average strategies, but irrespective of the results, the thing that stood out to me was how inflexible they were. If it was designed to test a triple crossover, that's all it could do. With this indicator, literally anything is possible and modifying the parameters couldn't be easier.