Cyatophilum PSAR Bot Trader V2 [BACKTEST]A strategy built upon Parabolic Stop And Reverse.
This new version includes my whole Trend Detector / Stop Loss / Takeprofit / Trailing System.
מטבע קריפטו

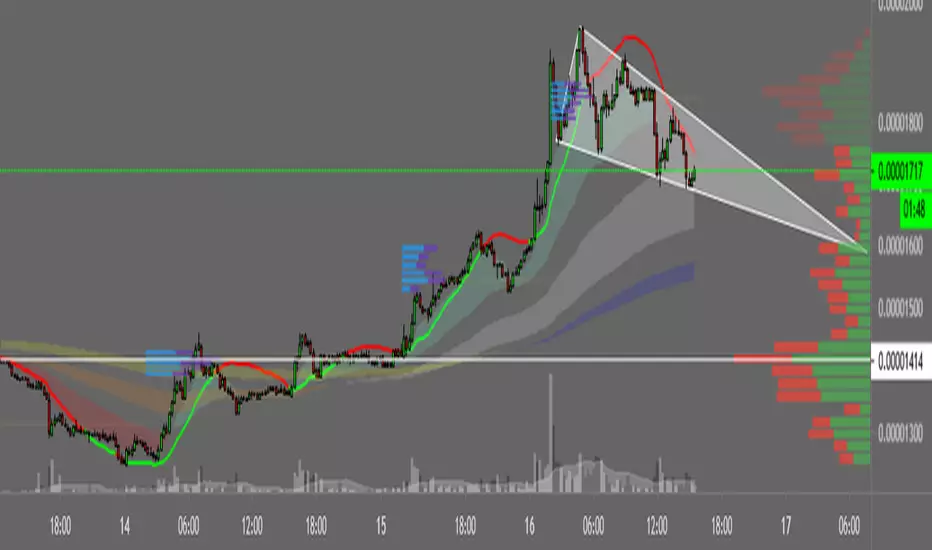
APEX - Swing Aura StrategyA backtester of my new strat, it's a hybrid swing/scalp strat that really looks for quick low profits. Will keep it hidden as it's a bit of a work in progress right now. Working on it to perform well enough with the Apex Trading bot, ran it for a day now and it ended the day on a 1.78% portfolio profit, so I'm really pleased with that.
As for details it's based on Keltner Channels, Bolingers Bands and a Ichimoku cloud. To spice it up there's even a Wave trend in there as well!
All the settings for the bits and parts are changeable so feel free to mess around with them, but will keep my sell triggers fixed for now, so no editing of those from within the script unfortunately.
Enjoy!

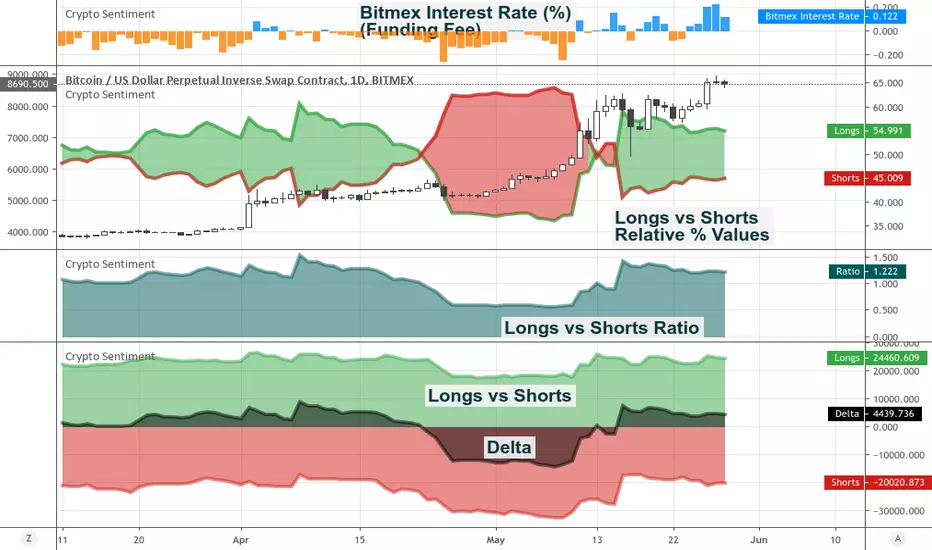
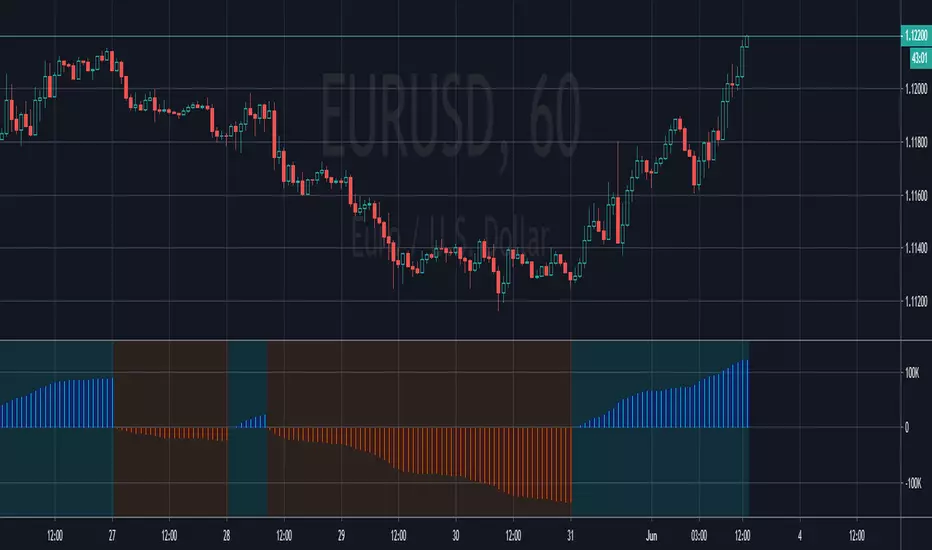
Ultimate Crypto SentimentThis study plots sentiment data from Longs vs Shorts reported at Bitfinex and the Funding Interest Rate that applies at Bitmex.
The indicator includes 4 visualization modes:
Overlapped Areas: Plots Longs and Shorts overlapping each other
Opposed Areas: Displays Longs as positive values and Shorts as negative.
Cloud: Highlights the difference between Longs and Shorts
Bitmex Interest Rate: Shows the funding rate that applies at Bitmex
The Longs vs Shorts data can be displayed either in Absolute mode or in Relative Mode.
The indicator includes visibility controls to Show/Hide:
The Longs
The Shorts
The Delta
The Longs vs Shorts Ratio
PpSignal Variable Move Average V 3.0VMA V 3 www.prorealcode.com
Variable Moving Average (VMA) ... Longer-term moving averages are slow to react to reversals in trend when prices move up and down over a long period of time. A Variable Moving Average regulates its sensitivity and lets it function better in any market conditions by using automatic regulation of the smoothing constant.

Scalp TraderA nice strategie for the beginners traders..in order to help see better how to folllow the trend.. because trend is youre friend :)
For access ----> private message.

PpSignal CFB Tren Follow V 1.0 Stock and Indicesthis strategy is based in strong signal of analysis trend (CFB and 2), volatility (ATR & STD Band) and volume.
when we have the first CFB 1 alarm ( green buy signal) we must wait until the price breaks out the upper band of the ATR MA, you have atr alarm ma option signal in the setup of indicator.
we can enter in the 3rd time when the cfb 2 give you the 3 signal blue buy color alarm.
The indicator also has an exit alarm option when the price goes into the ATR band.
It also has a smoothed W% alarm.
enjoy it

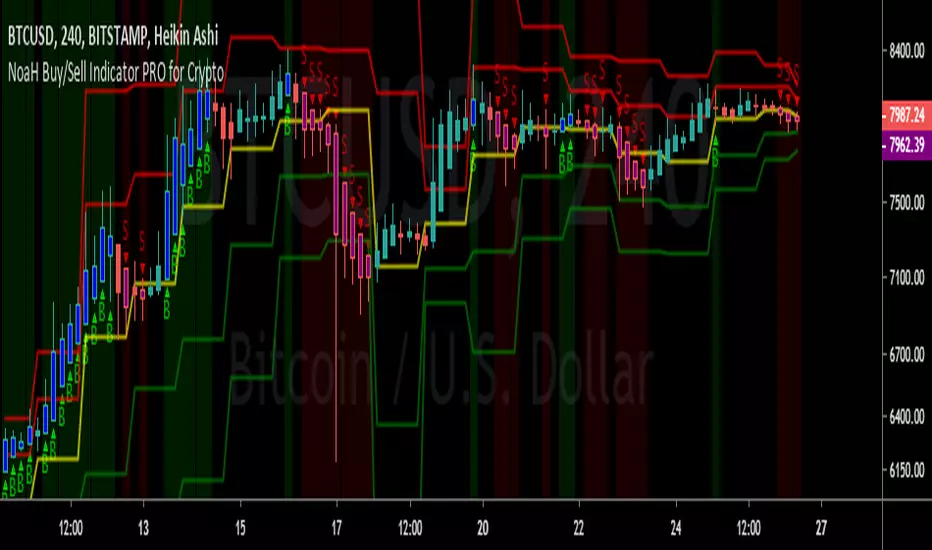
NoaH Buy/Sell Indicator PRO for Crypto Noah Crypto introduces an improved specified version Buy/Sell indicator for cyptocurrency market.
- This indicator can work for all pairs on all exchanges but for CRYPTO MARKET ONLY. Don't use it for margin trading or other markets.
- This indicator was optimized for Heikin Ashi chart, so please use it on Heikin Ashi charts only. Wrong chart may lead to wrong signals.
- This indicator shows best performance at M30, H4 and D1. So it is very suitable for day traders or scalp traders.
BENEFITS OF THIS VERSION:
- Show Buy/Sell zones: Good buy zone are 3 first candles marked with 'B' letter, close/exit buy on first 'S' candle confirmed.
- Targets and stop-loss are shown directly on chart. Buy/Sell areas have Green/Red background.
- No 'B' or 'S' marked on candles indicates the undecided market, wait for trend to be more clear to put orders.
- Applicable to set alarm when a coin reaches entry, sell targets or stop-loss.
PM me for 1 day trial and monthly fee, or if you have question or need support.
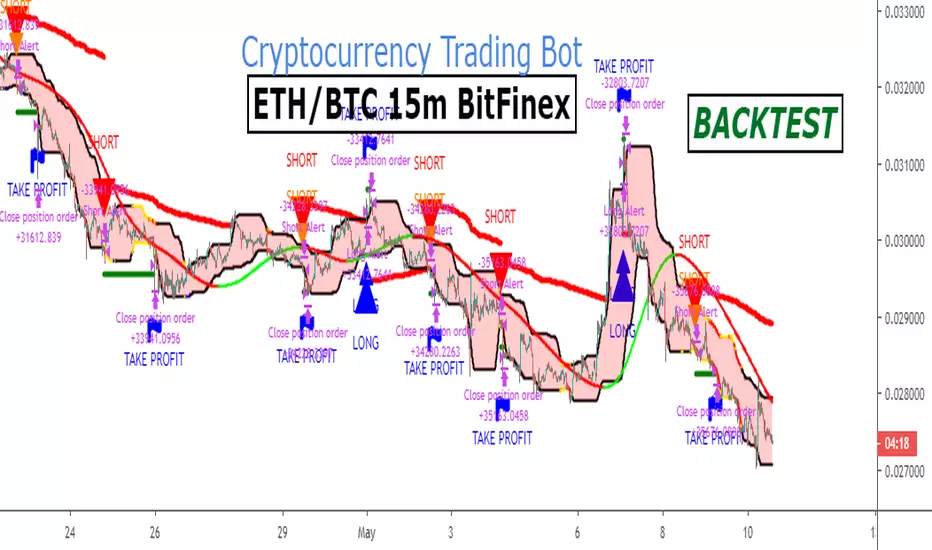
Ethereum Automated Strategy - Bitfinex - 3HHello guys !
Here is a ready to use BITFINEX:ETHBTC Automated Strategy with Long and Short Alerts !
You can see the backtest below using 100% equity of 10 000$, 0.1% commission, long and short trades with no leverage.
Indicator used
Leave a comment to get your trial !
or
Get the indicator today !

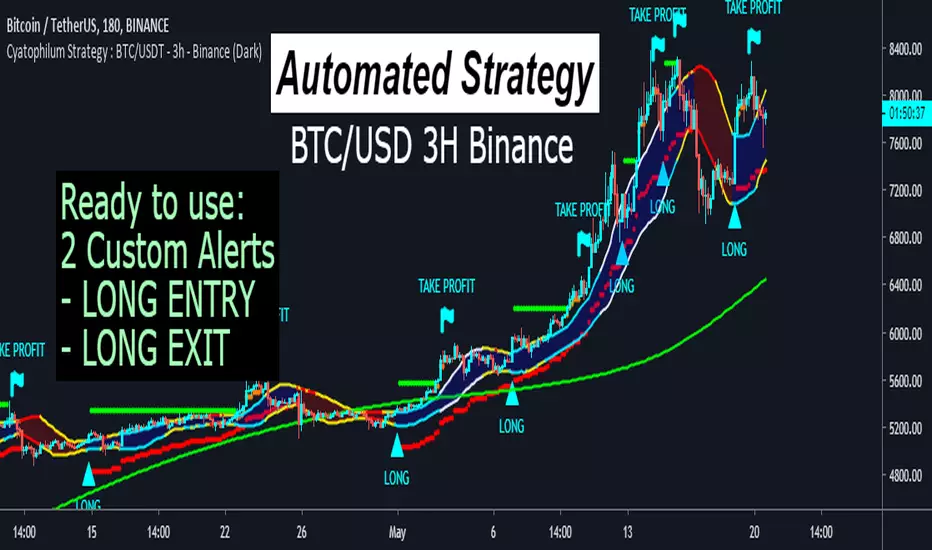
Automated Bitcoin Binance Strategy - RIP HODLERSBuilt upon my latest script
Already configured for BINANCE:BTCUSDT in 3H timeframe.
Backtest results below using 100% equity of 10 000$, 0.05% commission, and only buy and sell trades.
Leave a comment to get your trial
or
Get the indicator today !
Smart Target Introduction
This is the first forward-looking indicator on TradingView!
A normal moving average indicator will use two averages of differing lengths, referred to as “fast and slow” or “short and long” moving averages, to identify trends and potential trades.
The Smart Target indicator uses the average trade profitability and trade duration of a moving average strategy to determine a forward-looking target that is specific to the chart that it has been applied to.
Every historical trade is considered when the indicator determines the future price target of an asset and the accuracy will improve with time as new trade data is continually introduced.
Indicator Utility
If the fast-moving average crosses above the slow, a blue target will appear.
A red target will appear when the fast-moving average crosses below the slow.
The target will never change once it has been plotted and will not repaint in any way which means that it is fully functional for trading in real-time.
Input Values
The period length of the two moving averages will need to be determined by the user and can be changed in the indicator settings panel.
View the full documentation on this indicator at this link: www.kenzing.com

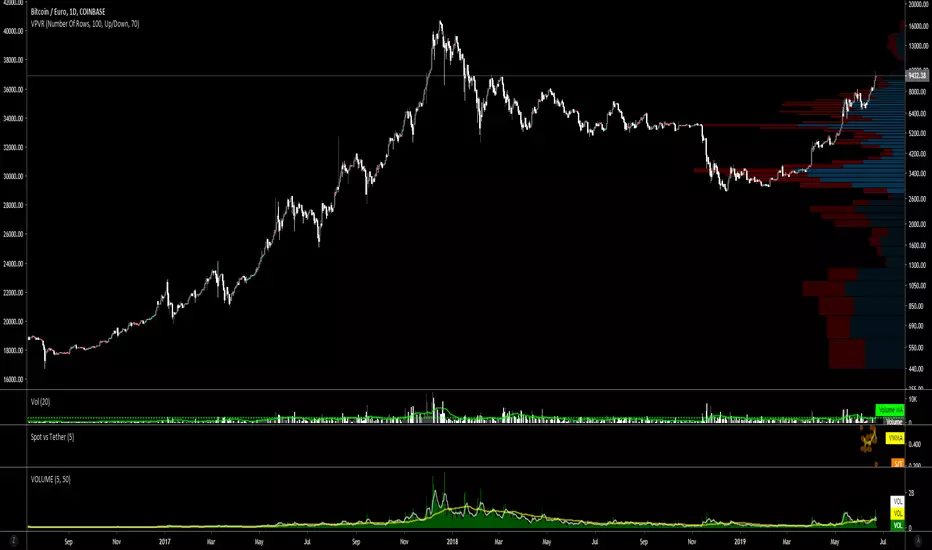
BTC Spot vs Tether Volumespot_volume / tether_volume
spot = Coinbase + bitFlyer + Kraken + Bitstamp
tether = Bitfinex + binance + Huobi + HitBTC

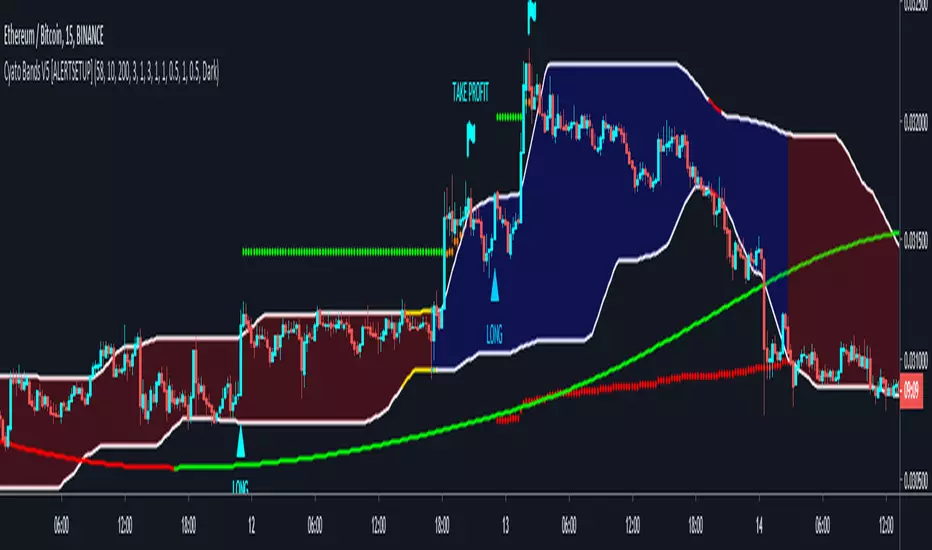
Cyatophilum Bands Pro Trader V5 [ALERTSETUP]Alert Setup version
Get the Free Backtest version here :
This version includes a new feature.
Trailing Take Profit with % deviation.
For those seeing the indicator for the first time, it works like Donchian Channels with lag and a channel width condition to detect breakouts. On top of that I integrated a Stop Loss and Take Profit system to pinescript.
Backtest results below are calculated with :
Short + Long Strategy
0.05% Commission
100% of 10 000% equity per trade
Strategy data from 25/04/2019 to 18/05/2019
Default Configuration for BITFINEX:ETHBTC 3 minutes timeframe.
This version also has the Stop Loss / Take Profit system included in the previous version, plus a short / long setup distinction. For example you can choose a different stop loss % for long and for short trades.
Previous version:
Get access to the Alert Setup version and automate the strategy today !
Purchase the Cyatophilum Indicators pack
I will publish backtests and configurations so make sure to follow me if you don't want to miss anything !
My Website - blockchainfiesta.com -
My Discord channel - discord.gg -
Cyatophilum Bands Pro Trader V5 [BACKTEST]Hi guys, I improved my script once again :)
This version includes a new feature.
Trailing Take Profit with % deviation.
For those seeing the indicator for the first time, it works like Donchian Channels with lag and a channel width condition to detect breakouts. On top of that I integrated a Stop Loss and Take Profit system to pinescript.
Backtest results below are calculated with :
Short + Long Strategy
0.05% Commission
100% of 10 000% equity per trade
Strategy data from 25/04/2019 to 18/05/2019
Default Configuration for BITFINEX:ETHBTC 3 minutes timeframe.
This version also has the Stop Loss / Take Profit system included in the previous version, plus a short / long setup distinction. For example you can choose a different stop loss % for long and for short trades.
Previous version:
This Backtest version is free to test. Just Leave a comment, thanks !
Get access to the Alert Setup version and automate the strategy today !
Purchase the Cyatophilum Indicators pack
I will publish backtests and configurations so make sure to follow me if you don't want to miss anything !
My Website - blockchainfiesta.com -
My Discord channel - discord.gg -

Crypto Indicators #u9tusA set of low timeframe (LTF), medium timeframe (MTF), and high timeframe (HTF) indicators for use in crypto currencies / bitcoin.
Traditionally the 10, 20, 50, 100, and 200 SMAs are used in TA. With cryptos, I've found that the 8 EMA, 21, 55, and 128 SMAs backtest better, while no change in length was necessary for the 200. I wanted to combine all these into one indicator to easily add them to a chart layout, hence this script.
You can customize the length of each MA to your liking in the settings, or accept the defaults.
LTF Indicators:
8 EMA in blue hues, medium line stroke.
MTF Indicators:
21, 55 SMA in purple hues, medium line stroke.
HTF Indicators:
128, 200 SMA in yellow hues, thick line stroke.
Defaults are for daily timeframes and lower; suggest changing up the intervals for weekly and monthly to:
21 -> 30
55 -> 50
128 -> 100
$BTC, $ETH, #ALTS
twitter.com
(c) @jhaurawachsman 20190515

Correlate 21 coinsHey!
I remade some dude's script to add more coins.
Its a pearson correlation indicator, which would give us an idea of the main trend and behaviour of the pairs you choose.


EMA 9/45/90/180/270/360 ReversalsHey!
This is a 6EMA crossover script, to make a whole trend and S/R analysis in a second ;)
Hope you like it! Leave a like pls :)
PpSignal Volume Profilethis indicator shows us the strength of the volume. green is buy signal an orange is sell signal.
The yellow signal is the net volueme. Net volume is a technical indicator calculated by subtracting a security's uptick volume by its downtick volume over a specified period of time.
when the volume buy is greater than the volume of sell the background change to aqua color. When the sell volume is greater than the buy volume, the background is painted orange ...
Ethereum FREE Backtest Version ETHBTC 15m BITFINEXA strategy for trading ETH/BTC in 15m timeframe.
The strategy includes long and short trades.
You can find the Alert Setup version below.
More info here .
-------------------------------------------------------------------------------
My website : blockchainfiesta.com
Automated Strategies for TradingView
BOSS Automatic TrendlinesTHE BEST FOREX, BINARY OPTIONS, AND CRYPTO INDICATORS FOR TRADINGVIEW.COM
Trendlines when drawn properly make an excellent tool for traders. Used improperly though, they become ineffective and even counterproductive, resulting in a belief that prices have made a reversal when they really haven't, or that a trend has strength when price action suggests it doesn't.
The Boss Auto Trendline Indicator draws the trendlines automatically, and now you can effectively use trendlines as part of your trading strategy.
Trendlines highlight a trend or range (sideways movement). A trendline connects swing lows, where the low is lower than the surrounding prices, and swing highs in price. When the price rises, the swing lows rise.
Red Lines & Dots.
Connecting these lows with a line results in an ascending trendline, showing you that the trend is up. A trendline can also be drawn along the swing highs. This shows the angle of ascent, and the strength of the price move, whether strongly higher or not.
Green Lines & Dots
When the price falls, the swing highs fall. Connecting these highs with a line results in a descending trendline, illustrating the downward trend. A trendline can also be drawn along the swing lows. This shows the angle of descent and the strength of the downward price movement.
Available at bosscripts.com
Website bosscripts.com


PpSignal SlopeSlope measures the rise-over-run of a linear regression. In general, an uptrend is present when Slope is positive and a downtrend exists when the slope is negative. The timeframe depends on the number of days. ... As with moving averages, Slope can be used with momentum indicators to participate in an ongoing trend.
We did a smooth slope eldher version...
