Divergence Detector (MACD + Volume)Divergence Detector (MACD + Volume Confirmation)
This indicator automatically detects bullish and bearish divergences between price and MACD, enhanced with volume confirmation to filter out weak signals.
🔹 Core Logic
Pivot Detection:
The script identifies swing highs and lows (pivots) using customizable left/right lookback values.
Bullish Divergence:
Occurs when price makes a lower low, but MACD makes a higher low.
A label "Bull Div" appears below the bar; if confirmed by high volume, it shows "Bull Div 🔥".
Bearish Divergence:
Occurs when price makes a higher high, but MACD makes a lower high.
A label "Bear Div" appears above the bar; if confirmed by high volume, it shows "Bear Div 📉".
Volume Confirmation:
The indicator checks whether the volume at the pivot bar is above the moving average of volume (customizable length).
This ensures that divergence signals are backed by strong market participation.
Inputs
MACD Fast/Slow/Signal Length – standard MACD parameters
Pivot Lookback Left/Right – defines the swing structure sensitivity
Volume MA Length – defines how volume strength is validated
Output
Labels:
🔹 Bull Div / Bull Div 🔥 → Bullish divergence (confirmed with volume)
🔹 Bear Div / Bear Div 📉 → Bearish divergence (confirmed with volume)
Tips
Works best on higher timeframes and trending markets.
Volume confirmation helps filter false divergences in low liquidity conditions.
Combine with trend or structure indicators for better trade setups.
----------------------------------------------------------------------------------------------
اندیکاتور شناسایی واگرایی MACD با تأیید حجم
این اندیکاتور بهصورت خودکار واگراییهای صعودی و نزولی بین قیمت و MACD را شناسایی کرده و با استفاده از تأیید حجم (Volume Confirmation) سیگنالهای ضعیف را فیلتر میکند.
🔹 منطق عملکرد
شناسایی پیوتها:
نقاط چرخش (سقف و کف) با استفاده از تعداد کندلهای قابل تنظیم در دو سمت شناسایی میشوند.
واگرایی صعودی (Bullish):
زمانی که قیمت کف پایینتر و MACD کف بالاتر میسازد.
برچسب "Bull Div" در زیر کندل نمایش داده میشود؛ اگر حجم بالا باشد، با علامت 🔥 مشخص میگردد.
واگرایی نزولی (Bearish):
زمانی که قیمت سقف بالاتر و MACD سقف پایینتر میسازد.
برچسب "Bear Div" در بالای کندل نمایش داده میشود؛ اگر حجم بالا باشد، با 📉 مشخص میگردد.
تأیید حجم:
اگر حجم در کندل پیوت بالاتر از میانگین متحرک حجم باشد، سیگنال معتبرتر در نظر گرفته میشود.
تنظیمات ورودی
تنظیمات MACD (Fast, Slow, Signal)
پارامترهای شناسایی پیوت (Left / Right)
طول میانگین متحرک حجم (Volume MA Length)
خروجیها
Bull Div 🔥 / Bear Div 📉 برای واگراییهای تأییدشده با حجم
Bull Div / Bear Div برای واگراییهای بدون تأیید حجم
نکات کاربردی
بهترین عملکرد در تایمفریمهای بالا و بازارهای دارای روند
تأیید حجم به حذف سیگنالهای اشتباه در شرایط حجم پایین کمک میکند
برای دقت بیشتر، آن را با اندیکاتورهای روند یا ساختار ترکیب کنید
⚠️ Disclaimer:
This script is provided for educational and informational purposes only.
It does not constitute financial advice, and the author is not responsible for any financial losses caused by its use.
Always confirm signals with your own analysis and other tools before making trading decisions.
⚠️ توجه:
این اسکریپت صرفاً جهت آموزش و اطلاعرسانی طراحی شده و توصیه مالی یا سرمایهگذاری محسوب نمیشود.
نویسنده مسئول هیچگونه ضرر یا زیان احتمالی ناشی از استفاده از آن نیست.
لطفاً پیش از هر تصمیم معاملاتی، تحلیل شخصی خود را انجام داده و از این ابزار در کنار سایر ابزارهای تحلیل و مدیریت ریسک استفاده کنید.
סטייה

Stochastic BTC OptimizedEnhanced Stochastic for Bitcoin (BTC) – Optimized for Daily Timeframe
This enhanced Stochastic oscillator is specifically fine-tuned for BTC/USD on the 1D timeframe, leveraging historical data from Bitstamp (2011–2025) to minimize false signals and maximize reliability in Bitcoin's volatile swings.
Unlike the classic Stochastic (14, 3, 3), this version uses optimized parameters:
- K Period = 21 – smoother reaction, better suited for BTC’s macro cycles
- D Period = 3, Smooth K = 3 – reduces noise while preserving responsiveness
- Overbought = 85, Oversold = 15 – accounts for BTC’s tendency to trend strongly within extreme zones without immediate reversal
✅ Smart Signal Logic:
Buy/sell signals appear only when %K crosses %D inside the oversold (≤15) or overbought (≥85) zones, and only the first signal is shown to avoid whipsaws.
Visual Enhancements:
- Thick lines when %K/%D are in overbought/oversold zones
- Green/red background highlights on valid signals
- Optional up/down arrows for clear entry visualization
- Customizable colors, line widths, and transparency
🔒 No alerts included – clean, focused on price action and momentum.
💡 Pro Tip: For even higher accuracy, use this indicator in combination with a long-term trend filter (e.g., EMA 200). The oscillator excels in ranging or retracement phases but should not be used alone in strong parabolic moves.
Based on Mozilla Public License v2.0 – feel free to use, modify, and share. Perfect for swing traders and long-term Bitcoin analysts seeking high-probability reversal zones.
перевод на русский
Улучшенный Stochastic для Bitcoin (BTC) — оптимизирован для дневного таймфрейма
Этот улучшенный осциллятор Stochastic специально настроен под BTC/USD на дневном графике, с учётом исторических данных Bitstamp (2011–2025), чтобы минимизировать ложные сигналы и повысить надёжность в условиях высокой волатильности биткоина.
В отличие от классического Stochastic (14, 3, 3), эта версия использует оптимизированные параметры:
- Период K = 21 — более плавная реакция, лучше соответствует макроциклам BTC
- Период D = 3, Сглаживание K = 3 — снижает шум, сохраняя отзывчивость
- Уровень перекупленности = 85, перепроданности = 15 — учитывает склонность BTC к сильным трендам в экстремальных зонах без немедленного разворота
✅ Интеллектуальная логика сигналов:
Покупка/продажа отображается только при пересечении %K и %D внутри зоны перепроданности (≤15) или перекупленности (≥85), и только первый сигнал фиксируется, чтобы избежать «хлыстов».
Улучшенная визуализация:
- Жирные линии, когда %K/%D находятся в экстремальных зонах
- Зелёный/красный фон при появлении сигналов
- Опциональные стрелки для чёткого отображения точек входа
- Настройка цветов, толщины линий и прозрачности
🔒 Без алертов — чистый инструмент, сфокусированный на цене и импульсе.
💡 Совет профессионала: для ещё большей точности используйте этот индикатор вместе с трендовым фильтром (например, EMA 200). Осциллятор лучше всего работает в фазах консолидации или отката, но не стоит применять его в одиночку во время сильных параболических движений.
На основе Mozilla Public License v2.0 — свободно используйте, модифицируйте и делитесь. Идеален для свинг-трейдеров и аналитиков Bitcoin, ищущих зоны с высокой вероятностью разворота.

Delta Hawk CVD DivergencesCustomized Cumulative Volume Delta indicator that automatically labels divergences over a set number of bars.

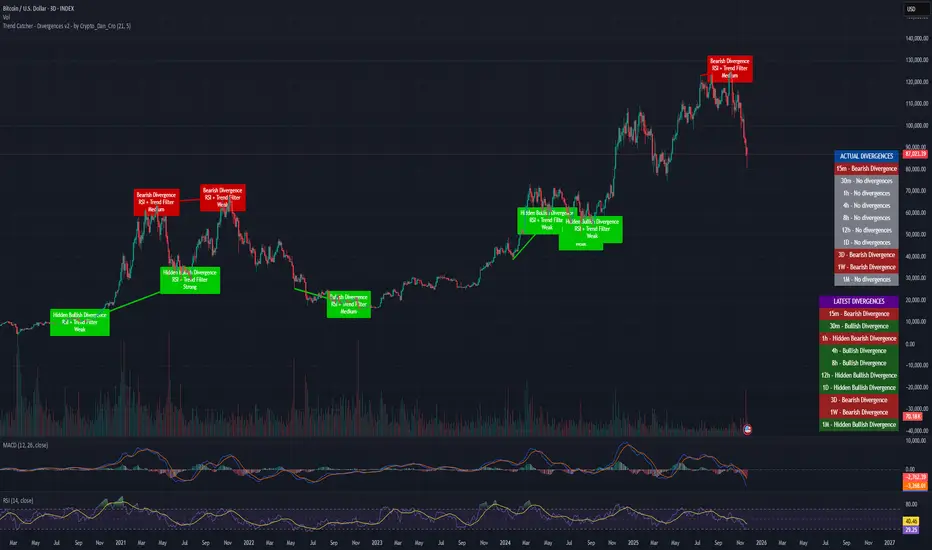
Trend Catcher - Divergences v2 - by Crypto_Dan_CroIf you want to get this indicator, contact me on
X handle: @crypto_dan_cro
What is Trend Catcher - Divergences v2?
It's advanced TradingView indicator designed to automatically detect and visualize divergences between price action and the RSI indicator, enhanced with smart filtering and visual strength analysis.
This tool helps traders identify potential trend reversals, continuation opportunities, and areas of weakening momentum with high clarity and precision.
Key Features
Automatic Detection of Divergences:
- Bullish divergence
- Bearish divergence
- Hidden bullish divergence
- Hidden bearish divergence
Overlap Prevention System
When bullish and bearish divergences occur in the same zone, the script intelligently prioritizes the stronger and more reliable signal to avoid confusion and clutter.
Visual Chart Rendering
Each divergence is displayed with:
- A line connecting key swing points
- A label showing: Divergence type, Active confirmation filter, Signal strength (Weak / Medium / Strong / Extreme)
Divergence Strength Heatmap
The indicator includes a Heatmap system that visually represents divergence strength using color intensity:
- Weak divergences appear lighter and more transparent
- Strong divergences appear bold and highly visible
Strength Classification Levels
Every divergence is categorized into one of four levels: Weak, Medium, Strong, Extreme
Confirmation Filters
- RSI + Trend Filter (recommended)
- RSI + MACD
- RSI + OBV
- MACD + Price Action
Multi-Timeframe Information Panels
ACTUAL DIVERGENCES
Displays currently active divergences across timeframes
LATEST DIVERGENCES
Shows the most recent divergence detected on each timeframe
Included timeframes:
15m, 30m, 1h, 4h, 8h, 12h, 1D, 3D, 1W, 1M
Ideal Use Cases
This indicator is perfect for:
- Swing trading
- Identifying reversal zones
- Momentum exhaustion detection
- Supporting price action strategies
- Trend confirmation and filtering
Trend Catcher – Divergences v2 provides a powerful yet clear approach to divergence trading by combining:
- Smart logic
- Visual clarity
- Strenght analysis
- Reliable filtering
It is built for traders who want precision, clarity, and confidence when trading divergences.
Crypto markets are volatile, if you choose to use this indicator for trading, you are doing it on your own. Crypto_dan_cro is not responsible for any profits or losses created by using this Indicator.
[CASH] Crypto And Stocks Helper (MultiPack w. Alerts)ATTENTION! I'm not a good scripter. I have just learned a little basics for this project, stolen code from other public scripts and modified it, and gotten help from AI LLM's.
If you want recognition from stolen code please tell me to give you the credit you deserve.
The script is not completely finished yet and contains alot of errors but my friends and family wants access so I made it public.
_________________________________________________________________________________
CASH has multiple indicators (a true all-in-one multipack), guides and alerts to help you make better trades/investments. It has:
- Bitcoin Bull Market Support Band
- Dollar Volume
- 5 SMA and 5 EMA
- HODL Trend (a.k.a SuperTrend) indicator
- RSI, Volume and Divergence indicators w. alerts
More to come as well, like Backburner and a POC line from Volume Profile.
Everything is fully customizable, appearance and off/on etc.
More information and explainations along with my guides you can find in settings under "Input" and "Style".

QT Previous Micro Cycle Range + SSMT [bilal]Previous Micro Cycle Range + SMTs - Indicator Description
📊 Overview
This indicator tracks 22.5-minute micro cycles within ICT's Quarterly Theory framework and automatically detects Smart Money Technique (SMT) divergences across correlated indices (NQ, ES, YM). It visualizes previous cycle ranges and identifies high-probability manipulation completions for precise intraday entries.
🎯 What It Does
Micro Cycle Tracking:
Divides each 90-minute session into four 22.5-minute micro quarters
Plots the previous micro cycle's High, Low, Equilibrium (EQ), and Quarter levels
Updates automatically as new micro cycles form
Works on any timeframe (recommended: 1-5 minute charts)
SMT Detection:
Compares current micro cycle vs previous micro cycle across NQ, ES, and YM
Detects Bearish SMT: Divergence at highs (signals distribution down)
Detects Bullish SMT: Divergence at lows (signals distribution up)
Draws visual SMT lines with directional arrows showing correlation/divergence
Optional SMT table showing all three indices' movements
💡 How To Use It
For Scalpers & Day Traders:
Wait for a new micro cycle to begin (lines will refresh every 22.5 minutes)
Watch for SMT formation in the current cycle
Bullish SMT = Buy signal (previous low is confirmed, expect move to previous high)
Bearish SMT = Sell signal (previous high is confirmed, expect move to previous low)
Key Concepts:
Minimum Target: Opposite extreme of previous cycle
SMT Confirmation: One or two indices sweep a level while the other(s) fail to sweep
Best Results: Trade with higher timeframe bias aligned
⚙️ Features
Customizable Display:
Toggle High/Low lines with multiple label styles (Timeframe, Label, %, Fib)
Optional Equilibrium (50%) level
Optional Quarter levels (25% / 75%)
Optional extended range projections (±50% to ±400%)
Adjustable line colors, widths, and label sizes
SMT Options:
Enable/disable SMT detection
Show/hide SMT text labels
Custom colors for bullish/bearish SMTs
Option to delete previous cycle SMTs (keeps chart clean)
Real-time SMT table showing all three indices
Comparison Assets:
Default: ES1! and YM1! (customize to your preference)
Set correlation type for each asset (correlated vs inverse)
Disable individual assets if needed
🔍 Understanding The Visuals
Lines:
Solid lines = Previous cycle High/Low (where price came from)
Dotted lines = EQ and Quarter levels (internal cycle structure)
Green lines = SMT divergence detected (buy/sell signal)
Labels:
▲ = Asset made higher high/low vs previous cycle
▼ = Asset made lower high/low vs previous cycle
🔺 = Inverse correlation (up when others down)
🔻 = Inverse correlation (down when others up)
SMT Logic:
If indices diverge (move opposite directions), SMT is confirmed
Bearish SMT = Highs diverge → Sell
Bullish SMT = Lows diverge → Buy
📈 Best Practices
Use on 1-5 minute charts for optimal micro cycle visualization
Combine with higher timeframe bias (Daily Cycle SSMT, session bias, etc.)
Wait for SMT confirmation before entering trades
Target previous cycle's opposite extreme as minimum profit target
Exit when opposing SMT forms or price reaches target
🛠️ Settings Guide
Essential Settings:
Comparison Symbols: Set to the indices you trade (default: ES1!, YM1!)
Show Cycle SMT: Toggle SMT detection on/off
Delete Previous Cycles SMTs: Keep chart clean by removing old SMTs
Visual Preferences:
Line Color/Width: Customize previous cycle lines
Label Style: Choose between Timeframe (22.5m), Label (descriptive), % (percentage), or Fib (0-1)
Show High/Low: Toggle previous cycle extremes
Show EQ/Quarters/Extended Ranges: Add more reference levels as needed
⚠️ Important Notes
This indicator shows previous cycle ranges, not predictive future levels
SMTs are confirmation signals for manipulation completion
Always use proper risk management and combine with your trading plan
Best results when aligned with higher timeframe directional bias
🎓 Based On ICT Concepts
This indicator implements concepts from Inner Circle Trader (ICT):
Quarterly Theory (fractal time structure)
Micro cycles (22.5-minute quarters)
Sequential SMT (mechanical divergence confirmation)
Smart Money accumulation, manipulation, distribution (AMD)
Perfect for: Scalpers, day traders, and anyone using ICT's Quarterly Theory and SMT concepts for precise intraday entries.
Note: This is a study indicator (overlay=true). It does not generate buy/sell signals automatically - you must interpret SMT formations based on your trading strategy.RéessayerGu should know it only works on the 30s chart btwPrevious Micro Cycle Range + SMTs - Indicator Description
📊 Overview
This indicator tracks 22.5-minute micro cycles within ICT's Quarterly Theory framework and automatically detects Smart Money Technique (SMT) divergences across correlated indices (NQ, ES, YM). It visualizes previous cycle ranges and identifies high-probability manipulation completions for precise intraday entries.
⚠️ IMPORTANT: This indicator is designed to work on the 30-second chart only. The micro cycle calculations are optimized for 30s timeframe data.
🎯 What It Does
Micro Cycle Tracking:
Divides each 90-minute session into four 22.5-minute micro quarters
Plots the previous micro cycle's High, Low, Equilibrium (EQ), and Quarter levels
Updates automatically as new micro cycles form every 22.5 minutes
Precise timing based on New York timezone session structure
SMT Detection:
Compares current micro cycle vs previous micro cycle across NQ, ES, and YM
Detects Bearish SMT: Divergence at highs (signals distribution down)
Detects Bullish SMT: Divergence at lows (signals distribution up)
Draws visual SMT lines with directional arrows showing correlation/divergence
Optional SMT table showing all three indices' movements in real-time
💡 How To Use It
Setup:
Switch to 30-second chart (required for accurate cycle timing)
Add indicator to your chart
Ensure you're viewing NQ, ES, or YM (or correlated futures)
For Scalpers & Day Traders:
Wait for a new micro cycle to begin (lines will refresh every 22.5 minutes)
Watch for SMT formation in the current cycle
Bullish SMT = Buy signal (previous low is confirmed, expect move to previous high)
Bearish SMT = Sell signal (previous high is confirmed, expect move to previous low)
Key Concepts:
Minimum Target: Opposite extreme of previous cycle
SMT Confirmation: One or two indices sweep a level while the other(s) fail to sweep
Best Results: Trade with higher timeframe bias aligned (Daily Cycle SSMT, session bias)
⚙️ Features
Customizable Display:
Toggle High/Low lines with multiple label styles (Timeframe, Label, %, Fib)
Optional Equilibrium (50%) level
Optional Quarter levels (25% / 75%)
Optional extended range projections (±50% to ±400%)
Adjustable line colors, widths, and label sizes
Line extension length (default: 15 bars ahead)
SMT Options:
Enable/disable SMT detection
Show/hide SMT text labels with ticker symbols and directional arrows
Custom colors for bullish/bearish SMT lines
Option to delete previous cycle SMTs (keeps chart clean)
Real-time SMT table showing all three indices' current status
Comparison Assets:
Default: ES1! and YM1! (customize to your preference)
Set correlation type for each asset (correlated vs inverse)
Disable individual assets if needed
Works with any correlated futures contracts
Debug Mode:
Toggle debug info to see current NY time, session, and micro cycle timing
Helpful for understanding cycle structure and troubleshooting
🔍 Understanding The Visuals
Lines:
Solid lines = Previous cycle High/Low (where price came from)
Dotted lines = EQ and Quarter levels (internal cycle structure)
Green lines (default) = SMT divergence detected (buy/sell signal)
Gray dotted lines = Extended range projections (if enabled)
Labels:
▲ = Asset made higher high/low vs previous cycle (correlated)
▼ = Asset made lower high/low vs previous cycle (correlated)
🔺 = Inverse correlation (up when others down)
🔻 = Inverse correlation (down when others up)
SMT Logic:
If indices diverge (move opposite directions), SMT is confirmed
Bearish SMT = Highs diverge → High is set, expect distribution down
Bullish SMT = Lows diverge → Low is set, expect distribution up
📈 Best Practices
Must use 30-second chart - indicator timing is calibrated for this timeframe
Combine with higher timeframe bias (Daily Cycle SSMT, 90-min SSMT, session bias)
Wait for SMT confirmation before entering trades (don't front-run)
Target previous cycle's opposite extreme as minimum profit target
Exit when opposing SMT forms or price reaches target
Best windows: Q2→Q3 or Q3→Q4 transitions within 90-minute sessions
Volatility injection times: Watch 09:30, 10:00, and 14:00 ET for strongest moves
🛠️ Settings Guide
Essential Settings:
Comparison Symbols: Set to the indices you monitor (default: ES1!, YM1!)
Correlation Type: Toggle "Correlated" on/off for each asset based on expected relationship
Show Cycle SMT: Enable/disable SMT detection
Show SMT Text: Toggle labels showing ticker divergence details
Delete Previous Cycles SMTs: Keep chart clean by removing old SMTs
Visual Preferences:
Line Color/Width: Customize previous cycle lines (default: black, width 1)
Label Style: Choose between:
Timeframe (shows "22.5m")
Label (descriptive: "previous micro cycle high/low")
% (shows "100%/0%")
Fib (shows "1/0")
Show High/Low: Toggle previous cycle extremes (recommended: ON)
Show EQ/Quarters/Extended Ranges: Add more reference levels as needed
SMT Customization:
SMT Colors: Customize bearish/bullish SMT line colors (default: green for both)
SMT Label Colors: Background and text color for SMT labels
SMT Table: Toggle real-time comparison table (bottom right)
⚠️ Important Notes
30-second chart required - will not work accurately on other timeframes
This indicator shows previous cycle ranges, not predictive future levels
SMTs are confirmation signals for manipulation completion, not entry triggers alone
Always use proper risk management and position sizing
Best results when aligned with higher timeframe directional bias
Monitor all three indices (NQ, ES, YM) for complete SMT picture
Micro cycles are part of a fractal structure - align with 90-min and Daily Cycle SMTs
🎓 Based On ICT Concepts
This indicator implements concepts from Inner Circle Trader (ICT):
Quarterly Theory (fractal time structure - 22.5 min micro quarters)
Micro cycles (four quarters within each 90-minute session)
Sequential SMT (mechanical divergence confirmation across correlated indices)
Smart Money AMD (Accumulation, Manipulation, Distribution pattern)
New York session timing (based on ICT's 6-hour daily cycles)
🕐 Micro Cycle Structure
Each 90-minute session divides into four 22.5-minute micro quarters:
Micro Q1: 00:00 - 22:30
Micro Q2: 22:30 - 45:00
Micro Q3: 45:00 - 67:30
Micro Q4: 67:30 - 90:00
This pattern repeats across all 16 daily 90-minute sessions (Q1.1 through Q4.4).
Perfect for: Scalpers and day traders using ICT's Quarterly Theory and SMT concepts for precise micro-level entries on 30-second charts.
Chart Requirement: 30-second timeframe only.
Note: This is a study indicator. It does not generate automatic buy/sell signals - you must interpret SMT formations based on your trading strategy and higher timeframe bias.

Stochastic Pro+ Suite📚 What Is the Stochastic Oscillator?
The stochastic oscillator is a momentum indicator comparing a security's closing price to its price range over a set number of periods. The %K line represents the raw stochastic value, while the %D line is a smoothed moving average of %K.
Stochastic helps identify:
Overbought and oversold conditions
Bullish and bearish crossovers
Momentum shifts before price reversals
It is widely used in both trending and ranging markets.
💡 What Makes This Suite Different?
This script supercharges the traditional stochastic with a multi-timeframe engine , divergence detection , and a highly customizable visual suite , including:
✅ Core Features:
- Multi-Timeframe (%K, %D, Spread): Pulls stochastic data from any higher timeframe for improved signal quality.
- Custom Overbought/Oversold Levels: Fully adjustable OB/OS thresholds (default: 80/20).
- %K-%D Spread Histogram: View the difference between %K and %D visually as a histogram.
- Color-coded Cross Highlights: Optional background shading for key crossover events in OB/OS zones (high probability reversal areas).
🔍 Divergence Detection (Optional):
- Bullish Divergence: Price makes lower lows while %K makes higher lows.
- Bearish Divergence: Price makes higher highs while %K makes lower highs.
- Customizable pivot lookbacks and range filters to control divergence strictness.
- Visual divergence labels plotted directly on the oscillator.
🎛️ Fully Toggleable Visuals:
Show/hide %K, %D, OB/OS lines, spread histogram, background highlight, and divergence — all via simple checkboxes.
🔔 Alerts:
Set alerts for both bullish and bearish divergences — ideal for swing, day, or trend reversal strategies.
⚙️ Use Cases
- Spot exhaustion in overbought/oversold zones
- Confirm or filter entries with divergence signals
- Monitor multiple timeframes without switching charts
- Use as a signal tool in confluence with price action or volume indicators
⚠️ Disclaimer
This tool is for educational and informational purposes only. It does not constitute financial advice, trading advice, or investment guidance. Always do your own research and consult a qualified financial advisor before making trading decisions.

NAMI Lite │ Zero-Repaint Momentum Wave + Reg Divergences (FREE)
NAMI Lite │ 100% Zero-Repaint Momentum Wave + Divergences (FREE)
The only zero-repaint, zero-lag momentum indicator that calls reversals hours early — even the free version beats all paid indicators.
No repainting on closed bars • Instant wave flips • Clean regular divergences • Money Flow confluence
Zero-Repaint Momentum Wave – CCI-based oscillator with real-time color flips (no lag, no lies)
Regular Bull/Bear Divergences – Faded lines on confirmed pivots only
Money Flow Oscillator – Volume-weighted filled areas for extra confirmation
This Lite version is intentionally limited — powerful enough to replace monthly subscriptions, but missing the pro features that make trading effortless.
Upgrade to Full NAMI Suite (One-Time Payment – Cancel Recurring Fees Forever):
Hidden Divergences with Divergence LABELS (catch 70% more massive moves)
200-Color Stochastic Heat Ribbon (gorgeous visual heatmaps)
True VWAP Oscillator + multi-source options
Buy/Sell Dots + Full Alerts (divergence, money flow, wave flips)
Full and Complete Customization (themes, lengths, colors)
Plus our other toolkits: TRAVIS, SMC Pro, and all future tools free
SEE IMAGE FOR COMPLETE NAMI VIEW
Over 800 traders already switched and saved thousands.

Range Oascilator + LessDivergences + MACD+StochRSIRange Oscillator + EMA Filter
Calculates a custom oscillator based on the highest high and lowest low over a chosen period.
Generates BUY signals when the oscillator crosses up from the oversold zone and price is above the EMA.
Generates SELL signals when the oscillator crosses down from the overbought zone and price is below the EMA.
MACD (3‑10‑16 EMA Settings)
Uses fast EMA = 3, slow EMA = 10, signal EMA = 16.
Detects bullish and bearish crossovers.
These crossovers only trigger a single unified buy/sell signal if they coincide with Stochastic RSI being in oversold (for buy) or overbought (for sell) zones.
Stochastic RSI
Standard calculation with %K and %D smoothing.
Defines oversold (<20) and overbought (>80) zones.
Used both for divergence detection and as a filter for MACD signals.
Divergence Detection
RSI Divergence: Price makes a lower low but RSI makes a higher low (bullish), or price makes a higher high but RSI makes a lower high (bearish).
MACD Histogram Divergence: Price makes a lower low but MACD histogram makes a higher low (bullish), or price makes a higher high but MACD histogram makes a lower high (bearish).
Stochastic RSI Divergence: Similar logic applied to %K line.
Divergences are flagged only once per pivot to avoid repetitive signals.
Visuals
EMA plotted on chart.
BUY/SELL signals shown as triangles above/below bars.
Divergences shown as labels (e.g., “RSI BullDiv”, “MACD BearDiv”).
Unified MACD+Stoch RSI signals shown in distinct colors (lime for buy, orange for sell).

Trendlines with Breaks Oscillator [LuxAlgo]The Trendlines with Breaks Oscillator is an oscillator based on the Trendlines with Breaks indicator, and tracks the maximum distance on price from bullish and bearish trendline breakouts.
The oscillator features divergences and trendline breakout detection.
🔶 USAGE
This tool is based on our Trendlines with Breaks indicator, which detects bullish and bearish trendlines and highlights the breaks on the chart. Now, we bring you this tool as an oscillator.
The oscillator calculates the maximum distance between the price and the break of each trendline, for both bullish and bearish cases, then calculates the delta between both.
When the oscillator is above 0, the market is in an uptrend; when it is below 0, it is in a downtrend. An ascending slope indicates positive momentum, and a descending slope indicates negative momentum.
Trendline breaks are displayed as green and red dots on the oscillator. A green dot corresponds to a bullish break of a descending trendline, and a red dot corresponds to a bearish break of an ascending trendline.
The oscillator calculation depends on two parameters from the settings panel: short and long alpha length. These parameters are used to calculate a synthetic EMA with a variable alpha for both bullish and bearish breaks. The final result is the difference between the two averages.
As shown in the image, using the same trend detection parameters but different alphas can produce very different results. The larger the alphas, the smoother the oscillator becomes, detecting bigger trends but making it less reactive.
This tool features the same trendline detection system as the Trendlines with Breaks indicator, which is based on three main parameters: swing length, slope, and calculation method.
As we can see in the image above, the data collected for the oscillator calculation will be different when using different parameters. A larger length detects larger trends. A larger slope or a different calculation method also impacts the final result.
🔹 Signal Line
The signal line is a smoothed version of the oscillator; traders can choose the smoothing method and length used from the settings panel.
In the image, the signal line crossings are displayed as vertical lines. As we can see, the market usually corrects downward after a bearish crossing and corrects upward after a bullish crossing.
Traders can choose among 10 different smoothing methods for the signal line. In the image, we can see how different methods and lengths give different outputs.
🔹 Divergences
The tool features a divergence detector that helps traders understand the strength behind price movements. Traders can adjust the detection length from the settings panel.
As shown in the image, a bearish divergence occurs when the price prints higher highs, but the momentum on the histogram prints lower highs. A bullish divergence occurs when the price prints lower lows, but the histogram prints higher lows.
By adjusting the length of the divergence detector, traders can filter out smaller divergences, allowing the tool to only detect more significant ones.
The image above depicts divergences detected with different lengths; the larger the length, the bigger the divergences are detected.
🔶 SETTINGS
🔹 Trendlines
Swing Detection Lookback: The size of the market structure used for trendline detection.
Slope: Slope steepness, a value of 0 gives horizontal levels, values larger than 1 give a steeper slope
Slope Calculation Method: Choose how the slope is calculated
🔹 Oscillator
Short Alpha Length: Synthetic EMA short period
Long Alpha Length: Synthetic EMA long period
Smoothing Signal: Choose the smoothing method and period
Divergences: Enable or disable divergences and select the detection length.
🔹 Style
Bullish: Select bullish color.
Bearish: Select bearish color.

Volume HeatMap Divergence [BigBeluga]🔵 OVERVIEW
The Volume HeatMap Divergence is a smart volume visualization tool that overlays normalized volume data directly on the chart. Using a color heatmap from aqua to red, it transforms raw volume into an intuitive scale — highlighting areas of weak to intense market participation. Additionally, it detects volume-based divergences from price to signal potential reversals or exhaustion zones. Combined with clear visual labeling, this tool empowers traders with actionable volume insights.
🔵 CONCEPTS
Normalized Volume Heatmap : Volume is normalized to a 0–100% scale and visually represented as candles below the chart.
float vol = volume / ta.percentile_nearest_rank(volume, 1000, 100) * 100
Bar Coloring : Price candles are dynamically colored based on volume intensity.
Volume Divergence Logic :
Bullish Divergence : Price forms a lower low, but volume forms a higher low.
Bearish Divergence : Price forms a higher high, but volume forms a lower high.
Dynamic Detection Range : Customizable range ensures divergence signals are meaningful and not random.
Volume Labels : Additional info on divergence bars shows both the actual volume and its normalized % score.
🔵 FEATURES
Volume Heatmap Plot : Normalized volume values colored using a smooth gradient from aqua (low) to red (high).
Price Bar Coloring : Candlesticks on the main chart adopt the same heatmap color based on volume.
Divergence Detection :
Bullish divergence with label and low marker
Bearish divergence with label and high marker
Dual Divergence Labels :
On the volume plot : Direction (Bull/Bear), raw volume, and normalized %
On the price chart : Shape labels showing "Bull" or "Bear" at local highs/lows
Custom Inputs :
Divergence range (min & max), pivot detection distance (left/right)
Toggle to show/hide divergence labels, volume, and % text
Clear Bull/Bear Coloring : Fully customizable label and line colors for both bullish and bearish signals.
🔵 HOW TO USE
Use the indicator as an overlay to monitor real-time volume strength using the heatmap color.
Watch for divergence markers:
Bullish divergence: Candle shows higher volume while price makes a new low
Bearish divergence: Candle shows lower volume while price makes a new high
Use the volume info labels to verify the context of divergence:
Actual volume at divergence candle
Normalized % of that volume compared to past 1000 bars
Adjust pivot sensitivity using "Pivot Left" and "Pivot Right" to tune signal frequency and lag with a right pivot length.
Use divergence zones as early warnings for potential reversals or trend shifts.
Disable or customize labels in settings depending on your charting preferences.
🔵 CONCLUSION
Volume HeatMap Divergence merges heatmap-style volume visualization with intelligent divergence detection — giving traders a clean yet powerful edge. By revealing hidden disconnections between price and participation, it helps users spot exhaustion moves or hidden accumulation zones before the market reacts. Whether you’re a scalper, swing trader, or intraday strategist, this tool offers real-time clarity on who’s in control behind the candles.

Transactional Rate of Change (TROC)TRANSACTIONAL RATE OF CHANGE (TROC) INDICATOR
Transaction Rate of Change (TROC) is an advanced momentum indicator that analyzes the rate of change in cumulative inferred buy/sell volume data to identify shifts in buying and selling acceleration and deceleration of transaction flow, providing early signals of potential trend changes, exhaustion/absorption, and momentum shifts. It builds further upon the official Volume Delta indicator released by TradingView.
If a stock price is a rocket climbing , then volume delta is the total fuel burned, and TROC is the fuel burn rate . A rocket can keep rising even after engines start throttling down (decelerating TROC), but it won't go much higher without more thrust. When TROC shows extreme positive readings, the engines are at maximum burn—expect explosive price movement. When TROC drops to zero while price is still high, the fuel is depleted and gravity (selling pressure) takes over. Are buyers pushing on the gas, or are they backing off? Are more buyers coming to the table, or are they losing interest or taking profits? Are excited retail buying highs while smart money close their positions using the excited retail liquidity?
KEY FEATURES
• Volume Delta Analysis - Approximates up and down volume from lower timeframe data to calculate true buying vs. selling pressure.
• Rate of Change Calculation - Measures the momentum of cumulative delta over a customizable period. Essentially, it displays the rate of change between buying and selling. How fast is it going, is it slowing, how excited are they?
• Momentum State Detection - Automatically identifies four distinct market states: accelerating up, decelerating up, accelerating down, and decelerating down
• Extreme Threshold Zones - Bands based on standard deviation to highlight unusually high or low transaction rates, helping to spot potential extreme values, blow offs, and capitulation.
• Z-Score Normalization - Optional standardization for comparing momentum across different timeframes and instruments.
• Momentum Strength Index (MSI) - Filters out weak signals by highlighting only bars with momentum exceeding a threshold.
• Flexible Reset Modes - Reset cumulative delta daily, weekly, monthly, or per session to prevent data drift, or leave it default for continual cumulative data.
APPLICATION
Trend Confirmation
When price makes a new high but TROC is decelerating (lighter colors), it suggests weakening buying pressure and potential exhaustion. Conversely, strong acceleration (darker colors) confirms robust trend continuation. Either buyers are supporting the move, or they aren't. Same goes for selling. It can also assist spotting short covering.
Divergence Trading
Use it similar to MACD divergence strategies. Is price movement confirmed by expansion in TROC, or is the TROC showing weakness while price is continuing it's trend?
Momentum Breakouts
When TROC crosses above the upper threshold zone with strong momentum (MSI activated), it signals institutional-level buying that often precedes significant price moves. Use this for breakout entries.
Mean Reversion
Extreme readings beyond the threshold zones often precede short-term reversals as transaction rates normalize. Consider taking profits or counter-trend positions when TROC reaches statistical extremes. Utilizing the extreme threshold bands can help you identify tops and bottoms.
Absorption Detection
Spot areas where buying or selling is being done, but price is hitting a wall or floor and not moving. This can indicate a hidden seller or a buyer reloading at price levels/zones.
SETTINGS
Timeframe for Volume Delta Calculation
Select the lower timeframe used to calculate buying and selling volume. Default: 1S (1 second)
• 1S or 5S - Maximum precision for scalping and intraday trading on liquid markets
• 1m or 5m - Balanced precision for swing trading and less liquid instruments
• Higher timeframes - Provide more historical data but reduce accuracy
Note: Higher frequency data yields more accurate delta calculations but may not be available for all symbols or historical periods. If you are using higher timeframes (Daily, Weekly) you will need to change this setting to a higher timeframe.
Rate of Change Period
Determines how many bars back to measure the momentum change. Default: 14
• Short periods (7-10) - More responsive, ideal for scalping and quick momentum shifts
• Medium periods (14-20) - Balanced sensitivity for day trading
• Long periods (25-50) - Smoother readings for swing trading and trend analysis
Shorter periods generate more signals but increase false positives; longer periods reduce noise but may lag significant changes.
Extreme Threshold Zones
Bands that highlight unusual transaction rate extremes based on standard deviation.
• Show Zones - Enable/disable the upper and lower threshold lines (Default: Enabled)
• Multiplier - Standard deviation multiplier for zone placement (Default: 2.0)
Values of 1.5-2.0 catch moderate extremes
Values of 2.5-3.0 identify only the most extreme readings
• Lookback Period - Number of bars used to calculate mean and standard deviation (Default: 100)
Shorter lookback (50-75) adapts faster to changing market conditions
Longer lookback (150-200) provides more stable, consistent zones
Smooth Cumulative Delta
Applies Adaptive Moving Average to reduce noise in the cumulative volume delta before calculating rate of change. Default: Enabled
• Smoothing Length - period (Default: 5)
Lower values (3-5) preserve responsiveness
Higher values (7-10) significantly reduce noise on choppy markets
Smoothing is particularly useful on volatile instruments or when using very short ROC periods.
Momentum Strength Index (MSI)
Filters the histogram to highlight only bars exceeding a specified momentum threshold, eliminating weak signals.
• Show MSI - Enable/disable momentum strength filtering (Default: Disabled)
• MSI Threshold - Minimum momentum strength multiplier (Default: 2.0)
Values of 1.5-2.0 show above-average momentum
Values of 2.5-3.5 isolate only exceptional momentum bars
When enabled, bars meeting the threshold display in the "Strong Up/Down" colors, while normal bars use standard momentum colors.
Display Settings
• Histogram Bar Width - Visual thickness of the columns (Default: 1, Range: 1-10)
• Use Z-Score Normalization - Standardizes TROC values for cross-asset comparison (Default: Disabled)
Enable when comparing multiple instruments or timeframes simultaneously
Z-Score converts values to standard deviations from the mean
• Z-Score Threshold - When using Z-Score Normalization mode, sets the extreme zone levels (Default: 2.0)
Represents standard deviations from mean (2.0 = ~95% confidence interval)
Cumulative Transaction Reset
Determines when the cumulative volume delta resets to zero, preventing infinite accumulation. Default: None
• None - Cumulative delta never resets (continues from symbol history start)
• Daily - Resets at the start of each new trading day
• Weekly - Resets at the start of each week
• Monthly - Resets at the start of each month
• On session change - Resets when market opens (useful for 24-hour markets)
Reset modes prevent cumulative drift that can distort ROC calculations over extended periods.
Color Customization Fully customizable color scheme.
-------------------------------------------------------------------
Note: This indicator requires volume data from your data vendor. It uses inferred buy/sell volume. To learn more, read the TradingView Volume Delta documentation. Optimal performance is achieved on liquid instruments with high-frequency data.

TPAmacd — Free by TPA OG💎 TPAmacd — Free by TPA OG
Professional Divergence Detection for Confident Technical Analysis
🧭 Overview
TPAmacd is an advanced divergence-analysis tool built for traders who value precision, adaptability, and clarity.
It automatically identifies bullish and bearish divergences on the MACD histogram, confirms momentum shifts, and provides a clean, customizable visual framework — helping you interpret market transitions with greater confidence.
⚙️ Key Features
- Auto-detected Bullish / Bearish Divergences — instantly highlights potential momentum shifts.
- Multi-Timeframe Compatibility — analyze divergences seamlessly across any chart period.
- Histogram Reversal Alerts — get notified as momentum changes direction.
- Customizable Settings — choose between EMA / SMA, set color themes, and adjust visual precision.
- Efficient, Lightweight Design — optimized for clarity and performance on all devices.
📈 Why Traders Choose TPAmacd
- Professional-grade divergence mapping
- Intuitive design — minimal clutter, maximum context
- Adaptable for scalping, swing, or long-term analysis
- Clear alerts and smooth integration with your workflow
⚠️ Important Disclaimer
This script is provided for educational and informational purposes only.
It does not constitute financial, investment, or trading advice.
No indicator, including TPAmacd or any related tools by TPA OG, can guarantee accuracy or profitability.
All trading involves risk, and past performance is not indicative of future results.
Always perform independent analysis and use appropriate risk-management practices before placing any trade.

Ultimate RSI Suite [BigBeluga]🔵 OVERVIEW
The Ultimate RSI Suite elevates the classic RSI into a full professional trading system.
It combines momentum analysis, advanced divergence detection, volatility-based RSI channels, multi-timeframe signals, deviation tracking, and reversal alerts into one powerful tool.
This is no ordinary RSI — it’s a complete momentum intelligence engine designed to identify trend strength, exhaustion, breakout conditions, and reliable reversal points with high precision.
⚠️ Note:
This suite enhances RSI with MTF dashboards, dynamic channels, deviation logic, and smart alerting — ideal for scalpers, swing traders, and institutional-style trend followers.
🔵 CONCEPTS
Measures market momentum to detect overbought/oversold zones and trend health
Tracks RSI behavior relative to dynamic channels (BB/Keltner/Donchian)
Identifies regular bullish & bearish divergences
Detects deviation moves after divergence to confirm trend continuation or exhaustion
Multi-timeframe RSI conditions reveal higher-timeframe confluence
Reversal triggers confirm early momentum shifts
Overbought/oversold gradients visually highlight exhaustion zones
🔵 FEATURES
Classic + Enhanced RSI with configurable lookback & price source
RSI-Channel System (Bollinger, Keltner, Donchian) for volatility-adaptive trend structure
RSI-Smoothing MA for trend direction filters
RSI Reversal Signals for early trend inflection detection
RSI Reversal Signals Deviation Levels +1 / +2 for advanced continuation confirmation
Overbought/Oversold Gradient Zones at 35/65 or user-defined levels
Divergence Engine for bullish & bearish momentum exhaustion signals
On-Chart Divergence & Signals (full overlay capability)
Divergence Engine Deviation Levels +1 / +2 for advanced continuation confirmation
Multi-Timeframe Dashboard (RSI OB/OS, signals, divergences, channel breaks)
• Hover your mouse over any signal cell to see how many bars ago it was triggered
• Signals automatically expire after 50 bars
Smart Alerts for divergence, reversals, channel breaks, and deviation triggers
🔵 HOW TO USE
Enter long when RSI reverses from oversold & prints bullish divergence or a ▲ signal
Enter short when RSI reverses from overbought & prints bearish divergence or ▼
Use channel breaks to confirm momentum expansions or trend shifts
Look for deviation crosses (+1 / +2) for strong confirmation after divergence
Track MTF table — more timeframe agreement = stronger conviction
Avoid trading against MTF RSI extremes (OB/OS stacked zones)
Combine with market structure or volume-based tools for maximum precision
🔵 ALERTS
Includes full automation suite:
Bullish / Bearish divergence
Reversal signals (▲ / ▼)
Channel breakouts (Up/Down)
Deviation +1 / +2 confirmation triggers
Extra RSI signal deviation alerts for precision continuation reads
Great for automated systems, confirmation models, and high-probability intraday/swing entries.
🔵 CONCLUSION
The Ultimate RSI Suite transforms RSI into a smart momentum-analysis system.
With multi-timeframe logic, dynamic channels, advanced divergence/deviation systems, and powerful visual cues, it offers institutional-grade trend, exhaustion, and reversal detection.
If you rely on RSI, this toolkit provides superior clarity, deeper context, and stronger execution timing — making it an elite upgrade for professional traders.
סקריפט בתשלום

Pivot Orderflow DeltaThis indicator analyzes order flow by calculating a continuous Cumulative Volume Profile Delta (CVPD). It plots this delta as a series of "delta candles" and identifies divergences and structural pivot levels.
Key Features:
Statistical Delta Engine: For each bar, the indicator builds a high-resolution volume profile on a lower 'Intra-Bar Timeframe'. It uses statistical models ('PDF' allocation) and advanced classifiers ('Dynamic' split) to determine the buy/sell pressure, which is then accumulated.
Cumulative Delta Candle Visualization: The indicator plots the continuous, accumulated delta as a series of candles, where for each bar:
Open: Is the cumulative delta value of the previous bar.
Close: Is the new total cumulative delta.
High/Low: Represent the peak/trough cumulative delta reached during that bar's formation.
Dynamic Pivot Baseline: The indicator plots a separate dynamic baseline ('Impulse Start') that adjusts when a new price pivot is confirmed.
When a price high forms, the baseline moves to the lower of its previous level or the peak delta (max of delta candle O/C) at the pivot.
When a price low forms, the baseline moves to the higher of its previous level or the trough delta (min of delta candle O/C) at the pivot.
Full Divergence Suite (Class A, B, C): A built-in divergence engine automatically detects and plots Regular (A), Hidden (B), and Exaggerated (C) divergences between price and the peak/trough of the delta candles (High/Low).
Detailed Pivot Confluence: The indicator plots distinct markers to differentiate between pivots occurring only on the price chart, only on the delta oscillator, or on both simultaneously.
Note on Confirmation (Lag): Divergence and pivot signals rely on a confirmation method. A pivot is only plotted after the Pivot Right Bars input has passed, which introduces an inherent lag.
Integrated Alerts: Includes 23 comprehensive alerts for:
The start and end of all 6 divergence types.
The detection of a new Impulse Start pivot.
Delta/volume agreement/disagreement.
Delta crossing the zero line.
The formation of price-only or delta-only pivots.
Caution: Real-Time Data Behavior (Intra-Bar Repainting) This indicator uses high-resolution intra-bar data. As a result, the values on the current, unclosed bar (the real-time bar) will update dynamically as new intra-bar data arrives. This behavior is normal and necessary for this type of analysis. Signals should only be considered final after the main chart bar has closed.
DISCLAIMER
For Informational/Educational Use Only: This indicator is provided for informational and educational purposes only. It does not constitute financial, investment, or trading advice, nor is it a recommendation to buy or sell any asset.
Use at Your Own Risk: All trading decisions you make based on the information or signals generated by this indicator are made solely at your own risk.
No Guarantee of Performance: Past performance is not an indicator of future results. The author makes no guarantee regarding the accuracy of the signals or future profitability.
No Liability: The author shall not be held liable for any financial losses or damages incurred directly or indirectly from the use of this indicator.
Signals Are Not Recommendations: The alerts and visual signals (e.g., crossovers) generated by this tool are not direct recommendations to buy or sell. They are technical observations for your own analysis and consideration.

Cumulative Volume Profile DeltaThis indicator calculates the Cumulative Volume Profile Delta (CVPD). It constructs a high-resolution volume profile for each bar using intra-bar data, then derives and accumulates the delta from that profile to show net buying/selling pressure.
Key Features:
Statistical Volume Profile Engine: For each bar, the indicator builds a high-resolution volume profile on a lower 'Intra-Bar Timeframe'. Instead of simple tick counting, it uses statistical models ('PDF' allocation) to distribute volume across price levels and advanced classifiers ('Dynamic' split) to determine the buy/sell pressure before accumulation.
Periodic Accumulation: The CVPD accumulation is anchored to a user-defined 'Anchor Timeframe' (e.g., daily, weekly). This cyclical reset allows to analyze the build-up of pressure within specific trading periods.
"Delta Candle" Visualization: The periodic CVPD is shown as a candle, where:
Open: The CVPD value at the start of the period (or zero).
High/Low: Represent the peak buying (CVD High) and selling (CVD Low) pressure within that period's profile.
Close: The final net delta value (CVD) for the period.
Dual CVD & Divergence Engine: The indicator calculates two CVPDs: a Periodic one (for plotting) and a Continuous one (non-resetting). The continuous line is used as a stable source for the built-in divergence engine (detecting Regular, Hidden, and Exaggerated).
Dynamic Divergence Plotting: Divergence markers are plotted relative to the periodic (candle) CVPD. They automatically adjust their vertical position after a reset to remain visually aligned with the plotted candles.
Note on Confirmation (Lag): Divergence signals rely on a pivot confirmation method to ensure they do not repaint.
The Start of a- divergence is only detected after the confirming pivot is fully formed (a delay based on Pivot Right Bars).
The End of a divergence is detected either instantly (if the signal is invalidated by price action) or with a delay (when a new, non-divergent pivot is confirmed).
Multi-Timeframe (MTF) Capability:
MTF Output: The entire analysis (Delta Candles, Divergences) can be calculated on a higher timeframe (using the Timeframe input), with standard options to handle gaps (Fill Gaps) and prevent repainting (Wait for...).
Limitation: The Divergence detection engine (pivDiv) is disabled if a Higher Timeframe (HTF) is selected.
Integrated Alerts: Includes 18 comprehensive alerts for:
The start and end of all 6 divergence types.
The periodic CVPD crossing the zero line.
Conditions of agreement or disagreement between the delta and the main bar's direction.
Caution: Real-Time Data Behavior (Intra-Bar Repainting) This indicator uses high-resolution intra-bar data. As a result, the values on the current, unclosed bar (the real-time bar) will update dynamically as new intra-bar data arrives. This behavior is normal and necessary for this type of analysis. Signals should only be considered final after the main chart bar has closed.
DISCLAIMER
For Informational/Educational Use Only: This indicator is provided for informational and educational purposes only. It does not constitute financial, investment, or trading advice, nor is it a recommendation to buy or sell any asset.
Use at Your Own Risk: All trading decisions you make based on the information or signals generated by this indicator are made solely at your own risk.
No Guarantee of Performance: Past performance is not an indicator of future results. The author makes no guarantee regarding the accuracy of the signals or future profitability.
No Liability: The author shall not be held liable for any financial losses or damages incurred directly or indirectly from the use of this indicator.
Signals Are Not Recommendations: The alerts and visual signals (e.Example: crossovers) generated by this tool are not direct recommendations to buy or sell. They are technical observations for your own analysis and consideration.

Cumulative Volume DeltaThis Cumulative Volume Delta (CVD) indicator analyzes intra-bar volume dynamics. It introduces a periodic reset mechanism, anchoring the accumulation to a user-defined timeframe (e.g., daily, weekly) for cyclical analysis.
Key Features:
Dual CVD Calculation: The indicator computes two CVD values simultaneously:
Periodic CVD: Resets on the user-defined 'Anchor Timeframe'. This is plotted as "Delta Candles".
Continuous CVD: Accumulates volume continuously (non-resetting) and is used as the source for divergence detection.
Intra-Bar Delta Analysis: Uses a lower timeframe ('Intra-Bar Timeframe') to calculate buy/sell pressure based on the direction of the intra-bar candles.
"Delta Candle" Visualization: The periodic CVD is shown as a candle, where:
Open: The CVD value at the start of the period (or zero).
High/Low: Represent the peak buying (CVD High) and selling (CVD Low) pressure within that period.
Close: The final net delta value for that period.
Full Divergence Suite (Class A, B, C): A built-in engine automatically detects and plots Regular (A), Hidden (B), and Exaggerated (C) divergences between price and the continuous CVD line.
Dynamic Divergence Plotting: Divergence markers are plotted relative to the periodic (candle) CVD. They automatically adjust their vertical position after a reset to remain visually aligned with the plotted candles.
Note on Confirmation (Lag): Divergence signals rely on a pivot confirmation method to ensure they do not repaint.
The Start of a- divergence is only detected after the confirming pivot is fully formed (a delay based on Pivot Right Bars).
The End of a divergence is detected either instantly (if the signal is invalidated by price action) or with a delay (when a new, non-divergent pivot is confirmed).
Multi-Timeframe (MTF) Capability:
MTF Output: The entire dual-CVD analysis can be run on a higher timeframe (using the Timeframe input), with standard options to handle gaps (Fill Gaps) and prevent repainting (Wait for...).
Limitation: The Divergence detection engine (pivDiv) is disabled if a Higher Timeframe (HTF) is selected.
Integrated Alerts: Includes 18 comprehensive alerts for:
The start and end of all 6 divergence types.
The periodic CVD crossing the zero line.
Conditions of agreement or disagreement between the delta and the main bar's direction.
Caution: Real-Time Data Behavior (Intra-Bar Repainting) This indicator uses high-resolution intra-bar data. As a result, the values on the current, unclosed bar (the real-time bar) will update dynamically as new intra-bar data arrives. This behavior is normal and necessary for this type of analysis. Signals should only be considered final after the main chart bar has closed.
DISCLAIMER
For Informational/Educational Use Only: This indicator is provided for informational and educational purposes only. It does not constitute financial, investment, or trading advice, nor is it a recommendation to buy or sell any asset.
Use at Your Own Risk: All trading decisions you make based on the information or signals generated by this indicator are made solely at your own risk.
No Guarantee of Performance: Past performance is not an indicator of future results. The author makes no guarantee regarding the accuracy of the signals or future profitability.
No Liability: The author shall not be held liable for any financial losses or damages incurred directly or indirectly from the use of this indicator.
Signals Are Not Recommendations: The alerts and visual signals (e.g., crossovers) generated by this tool are not direct recommendations to buy or sell. They are technical observations for your own analysis and consideration.

Volume Weighted Price OscillatorThis indicator calculates the Percentage Price Oscillator (PPO), a momentum oscillator similar to the MACD. It displays the distance between two moving averages as a percentage, making it comparable across different assets. This implementation enhances the PPO with optional volume weighting and a built-in divergence engine.
Key Features:
Customizable MA & Volume Weighting: Both the fast and slow moving averages (and the signal line) can be customized using different MA types (e.g., EMA, SMA, WMA). An option (Volume weighted) applies volume weighting to all three MAs.
MACD-Style Display: Provides the three core components: the PPO line (momentum), a signal line (trigger), and a histogram (momentum acceleration). The histogram is color-coded to show increasing or decreasing momentum.
Full Divergence Suite (Class A, B, C): A built-in divergence engine automatically detects and plots all three major divergence classes between price and the PPO line:
Regular (A): Signals potential trend reversals.
Hidden (B): Signals potential trend continuations.
Exaggerated (C): Signals weakness at double tops/bottoms.
Divergence Filtering and Visualization:
Price Tolerance Filter: Divergence detection is enhanced with a percentage-based price tolerance (pivPrcTol) to filter out insignificant market noise.
Persistent Visualization: Divergence markers are plotted for the entire duration of the signal and are visually anchored to the PPO level of the confirming pivot.
Note on Confirmation (Lag): Divergence signals rely on a pivot confirmation method to ensure they do not repaint.
The Start of a- divergence is only detected after the confirming pivot is fully formed (a delay based on Pivot Right Bars).
The End of a divergence is detected either instantly (if the signal is invalidated by price action) or with a delay (when a new, non-divergent pivot is confirmed).
Multi-Timeframe (MTF) Capability:
MTF PPO Lines: The PPO, signal line, and histogram can be calculated on a higher timeframe, with standard options to handle gaps (Fill Gaps) and prevent repainting (Wait for...).
Limitation: The Divergence detection engine (pivDiv) is disabled if a timeframe other than the chart's timeframe is selected. Divergences are only calculated on the active chart timeframe.
Integrated Alerts: Includes 18 comprehensive alerts for:
The start and end of all 6 divergence types.
The PPO line crossing its signal line.
The PPO line crossing the zero line.
The histogram changing direction (reverting).
DISCLAIMER
For Informational/Educational Use Only: This indicator is provided for informational and educational purposes only. It does not constitute financial, investment, or trading advice, nor is it a recommendation to buy or sell any asset.
Use at Your Own Risk: All trading decisions you make based on the information or signals generated by this indicator are made solely at your own risk.
No Guarantee of Performance: Past performance is not an indicator of future results. The author makes no guarantee regarding the accuracy of the signals or future profitability.
No Liability: The author shall not be held liable for any financial losses or damages incurred directly or indirectly from the use of this indicator.
Signals Are Not Recommendations: The alerts and visual signals (e.g., crossovers) generated by this tool are not direct recommendations to buy or sell. They are technical observations for your own analysis and consideration.

Volume Weighted Stochastic RSIThis indicator calculates the Stochastic RSI, enhanced with optional Volume Weighting (VWStochRSI). It measures the level of a (Volume-Weighted) RSI relative to its high-low range over a set period, providing a sensitive momentum oscillator.
Key Features:
Volume-Weighted Core: The indicator is built on a Relative Strength Index (RSI) that can be optionally volume-weighted (Volume weighted).
Customizable Smoothing: The %K and %D lines are smoothed using a customizable moving average. The MA type (Smooth Method) can be selected (e.g., EMA, SMA, WMA) and will also be volume-weighted if the main Volume weighted option is enabled.
Full Divergence Suite (Class A, B, C): The primary feature is the integrated divergence engine. It automatically detects and plots all three major types of divergences:
Regular (A): Signals potential trend reversals.
Hidden (B): Signals potential trend continuations.
Exaggerated (C): Signals weakness at double tops/bottoms.
Divergence Filtering and Visualization:
Price Tolerance Filter: Divergence detection is enhanced with a percentage-based price tolerance (pivPrcTol) to filter out insignificant market noise.
Persistent Visualization: Divergence markers are plotted for the entire duration of the signal and are visually anchored to the %K line level of the confirming pivot.
Note on Confirmation (Lag): Divergence signals rely on a pivot confirmation method to ensure they do not repaint.
The Start of a- divergence is only detected after the confirming pivot is fully formed (a delay based on Pivot Right Bars).
The End of a divergence is detected either instantly (if the signal is invalidated by price action) or with a delay (when a new, non-divergent pivot is confirmed).
Multi-Timeframe (MTF) Capability:
MTF VWStochRSI Lines: The %K and %D lines can be calculated on a higher timeframe, with standard options to handle gaps (Fill Gaps) and prevent repainting (Wait for...).
Limitation: The Divergence detection engine (pivDiv) is disabled if a timeframe other than the chart's timeframe is selected. Divergences are only calculated on the active chart timeframe.
Integrated Alerts: Includes 20 comprehensive alerts for:
The start and end of all 6 divergence types.
The %K line crossing the %D line.
The %K line crossing the Overbought, Oversold, or 50-level lines.
DISCLAIMER
For Informational/Educational Use Only: This indicator is provided for informational and educational purposes only. It does not constitute financial, investment, or trading advice, nor is it a recommendation to buy or sell any asset.
Use at Your Own Risk: All trading decisions you make based on the information or signals generated by this indicator are made solely at your own risk.
No Guarantee of Performance: Past performance is not an indicator of future results. The author makes no guarantee regarding the accuracy of the signals or future profitability.
No Liability: The author shall not be held liable for any financial losses or damages incurred directly or indirectly from the use of this indicator.
Signals Are Not Recommendations: The alerts and visual signals (e.g., crossovers) generated by this tool are not direct recommendations to buy or sell. They are technical observations for your own analysis and consideration.

Volume Weighted Relative Strength IndexThis indicator calculates the Relative Strength Index (RSI) and enhances it with optional volume weighting (VWRSI). It also includes a customizable signal line and a built-in divergence detection engine.
Key Features:
Volume-Weighted Calculation: An option (Volume weighted) allows for volume to be incorporated into the calculation of both the RSI itself and its moving average signal line, making the oscillator more sensitive to high-volume price changes.
Customizable Signal Line: Includes an optional moving average of the VWRSI, which serves as a signal line. The type of MA (Smooth Method) and its length can be customized.
Full Divergence Suite (Class A, B, C): The primary feature is the integrated divergence engine. It automatically detects and plots all three major types of divergences:
Regular (A): Signals potential trend reversals.
Hidden (B): Signals potential trend continuations.
Exaggerated (C): Signals weakness at double tops/bottoms.
Divergence Filtering and Visualization:
Price Tolerance Filter: Divergence detection is enhanced with a percentage-based price tolerance (pivPrcTol) to filter out insignificant market noise.
Persistent Visualization: Divergence markers are plotted for the entire duration of the signal and are visually anchored to the VWRSI level of the confirming pivot.
Note on Confirmation (Lag): Divergence signals rely on a pivot confirmation method to ensure they do not repaint.
The Start of a- divergence is only detected after the confirming pivot is fully formed (a delay based on Pivot Right Bars).
The End of a divergence is detected either instantly (if the signal is invalidated by price action) or with a delay (when a new, non-divergent pivot is confirmed).
Multi-Timeframe (MTF) Capability:
MTF VWRSI Line: The VWRSI and its signal line can be calculated on a higher timeframe, with standard options to handle gaps (Fill Gaps) and prevent repainting (Wait for...).
Limitation: The Divergence detection engine (pivDiv) is disabled if a timeframe other than the chart's timeframe is selected. Divergences are only calculated on the active chart timeframe.
Integrated Alerts: Includes 20 comprehensive alerts for:
The start and end of all 6 divergence types.
The VWRSI crossing its signal line.
The VWRSI crossing the Overbought, Oversold, or 50-level lines.
DISCLAIMER
For Informational/Educational Use Only: This indicator is provided for informational and educational purposes only. It does not constitute financial, investment, or trading advice, nor is it a recommendation to buy or sell any asset.
Use at Your Own Risk: All trading decisions you make based on the information or signals generated by this indicator are made solely at your own risk.
No Guarantee of Performance: Past performance is not an indicator of future results. The author makes no guarantee regarding the accuracy of the signals or future profitability.
No Liability: The author shall not be held liable for any financial losses or damages incurred directly or indirectly from the use of this indicator.
Signals Are Not Recommendations: The alerts and visual signals (e.g., crossovers) generated by this tool are not direct recommendations to buy or sell. They are technical observations for your own analysis and consideration.

Relative Distance to Moving AverageThis indicator calculates the Relative Distance to a Moving Average (RDMA), a momentum oscillator that measures how overextended a price is from its moving average baseline. It expresses this distance as a percentage, oscillating around a zero line. High positive values may indicate overbought conditions, while large negative values may suggest oversold conditions.
Key Features:
Customizable MA Baseline: The oscillator's baseline is a moving average. Users can select from a wide range of MA types (e.g., EMA, SMA, WMA) and apply volume weighting (Volume weighted) for enhanced responsiveness.
Normalization (Geometric Average): Includes an optional 'Normalize' mode. When enabled, the indicator uses a Geometric Moving Average (GMA) as its baseline and measures the percentage distance from this compound growth average, making it suitable for exponential markets.
Full Divergence Suite (Class A, B, C): The indicator's primary feature is its integrated divergence engine. It automatically detects and plots all three major divergence classes between price and the RDMA:
Regular (A): Signals potential trend exhaustion and reversals.
Hidden (B): Signals potential trend continuations during pullbacks.
Exaggerated (C): Signals weakness at double tops/bottoms.
Divergence Filtering and Visualization:
Price Tolerance Filter: Divergence detection is enhanced with a percentage-based price tolerance (pivPrcTol) to filter out insignificant market noise.
Persistent Visualization: Divergence markers are plotted for the entire duration of the signal and are visually anchored to the RDMA level of the confirming pivot.
Note on Confirmation (Lag): Divergence signals rely on a pivot confirmation method to ensure they do not repaint.
The Start of a- divergence is only detected after the confirming pivot is fully formed (a delay based on Pivot Right Bars).
The End of a divergence is detected either instantly (if the signal is invalidated by price action) or with a delay (when a new, non-divergent pivot is confirmed).
Multi-Timeframe (MTF) Capability:
MTF RDMA Line: The RDMA oscillator itself can be calculated on a higher timeframe, with standard options to handle gaps (Fill Gaps) and prevent repainting (Wait for...).
Limitation: The Divergence detection engine (pivDiv) is disabled if a timeframe other than the chart's timeframe is selected. Divergences are only calculated on the active chart timeframe.
Integrated Alerts: Includes 14 comprehensive alerts for:
The start and end of all 6 divergence types.
The RDMA oscillator crossing the zero line.
DISCLAIMER
For Informational/Educational Use Only: This indicator is provided for informational and educational purposes only. It does not constitute financial, investment, or trading advice, nor is it a recommendation to buy or sell any asset.
Use at Your Own Risk: All trading decisions you make based on the information or signals generated by this indicator are made solely at your own risk.
No Guarantee of Performance: Past performance is not an indicator of future results. The author makes no guarantee regarding the accuracy of the signals or future profitability.
No Liability: The author shall not be held liable for any financial losses or damages incurred directly or indirectly from the use of this indicator.
Signals Are Not Recommendations: The alerts and visual signals (e.g., crossovers) generated by this tool are not direct recommendations to buy or sell. They are technical observations for your own analysis and consideration.

Chaikin Money FlowThis indicator provides an implementation of the classic Chaikin Money Flow (CMF), a volume-weighted oscillator designed to measure money flow pressure. It is enhanced with a customizable signal line and a built-in divergence detection engine.
Key Features:
Full Divergence Suite (Class A, B, C): The primary feature is the integrated divergence engine. It automatically detects and plots all three major types of divergences:
Regular (A): Signals potential trend reversals.
Hidden (B): Signals potential trend continuations.
Exaggerated (C): Signals weakness at double tops/bottoms.
Divergence Filtering and Visualization:
Price Tolerance Filter: Divergence detection is enhanced with a percentage-based price tolerance (pivPrcTol) to filter out insignificant market noise, leading to more robust signals.
Persistent Visualization: Divergence markers are plotted for the entire duration of the signal and are visually anchored to the CMF level of the confirming pivot.
Customizable Signal Line: Includes an optional moving average of the CMF, which serves as a signal line. The type of MA (Signal Smoothing) and its length can be customized. This signal line can also be optionally volume-weighted (Volume weighted).
Note on Confirmation (Lag): Divergence signals rely on a pivot confirmation method to ensure they do not repaint.
The Start of a- divergence is only detected after the confirming pivot is fully formed (a delay based on Pivot Right Bars).
The End of a divergence is detected either instantly (if the signal is invalidated by price action) or with a delay (when a new, non-divergent pivot is confirmed).
Multi-Timeframe (MTF) Capability:
MTF CMF & Signal Lines: The CMF and its signal line can be calculated on a higher timeframe, with standard options to handle gaps (Fill Gaps) and prevent repainting (Wait for...).
Limitation: The Divergence detection engine (pivDiv) is disabled if a timeframe other than the chart's timeframe is selected. Divergences are only calculated on the active chart timeframe.
Integrated Alerts: Includes 16 comprehensive alerts for:
The start and end of all 6 divergence types.
The CMF crossing its signal line.
The CMF crossing the zero line.
DISCLAIMER
For Informational/Educational Use Only: This indicator is provided for informational and educational purposes only. It does not constitute financial, investment, or trading advice, nor is it a recommendation to buy or sell any asset.
Use at Your Own Risk: All trading decisions you make based on the information or signals generated by this indicator are made solely at your own risk.
No Guarantee of Performance: Past performance is not an indicator of future results. The author makes no guarantee regarding the accuracy of the signals or future profitability.
No Liability: The author shall not be liable for any financial losses or damages incurred directly or indirectly from the use of this indicator.
Signals Are Not Recommendations: The alerts and visual signals (e.g., crossovers) generated by this tool are not direct recommendations to buy or sell. They are technical observations for your own analysis and consideration.

Accumulation Distribution LineThis indicator provides an implementation of the classic Accumulation/Distribution Line (ADL). It enhances the standard indicator with a built-in divergence detection engine.
Key Features:
Full Divergence Suite (Class A, B, C): The primary feature is the integrated divergence engine. It automatically detects and plots all three major types of divergences:
Regular (A): Signals potential trend reversals.
Hidden (B): Signals potential trend continuations.
Exaggerated (C): Signals weakness at double tops/bottoms.
Divergence Filtering and Visualization:
Price Tolerance Filter: Divergence detection is enhanced with a percentage-based price tolerance (pivPrcTol) to filter out insignificant market noise, leading to more robust signals.
Persistent Visualization: Divergence markers are plotted for the entire duration of the signal and are visually anchored to the ADL level of the confirming pivot.
Note on Confirmation (Lag): Divergence signals rely on a pivot confirmation method to ensure they do not repaint.
The Start of a- divergence is only detected after the confirming pivot is fully formed (a delay based on Pivot Right Bars).
The End of a divergence is detected either instantly (if the signal is invalidated by price action) or with a delay (when a new, non-divergent pivot is confirmed).
Multi-Timeframe (MTF) Capability:
MTF ADL Line: The ADL line itself can be calculated on a higher timeframe, with standard options to handle gaps (Fill Gaps) and prevent repainting (Wait for...).
Limitation: The Divergence detection engine (pivDiv) is disabled if a timeframe other than the chart's timeframe is selected. Divergences are only calculated on the active chart timeframe.
Integrated Alerts: Includes 12 comprehensive alerts that trigger on the start and end of all 6 divergence types (e.g., "Regular Bullish Started", "Regular Bullish Ended").
DISCLAIMER
For Informational/Educational Use Only: This indicator is provided for informational and educational purposes only. It does not constitute financial, investment, or trading advice, nor is it a recommendation to buy or sell any asset.
Use at Your Own Risk: All trading decisions you make based on the information or signals generated by this indicator are made solely at your own risk.
No Guarantee of Performance: Past performance is not an indicator of future results. The author makes no guarantee regarding the accuracy of the signals or future profitability.
No Liability: The author shall not be held liable for any financial losses or damages incurred directly or indirectly from the use of this indicator.
Signals Are Not Recommendations: The alerts and visual signals (e.g., crossovers) generated by this tool are not direct recommendations to buy or sell. They are technical observations for your own analysis and consideration.
