Dynamic Trend-Based Fibonacci Extension💡 This indicator is a sophisticated, automated technical analysis tool designed to identify high-probability trend continuation setups using the principles of market structure and Fibonacci geometry. By algorithmically detecting "A-B-C" price structures (Pivot -> Impulse -> Retracement), it projects dynamic Fibonacci Extension levels to forecast potential price targets for the next impulsive move (Wave C to D). Unlike static drawing tools, this script adapts to market volatility and features an advanced invalidation engine to keep your charts clean and your risk managed.
✨ Originality and Utility
Traders often struggle with the subjectivity of drawing Fibonacci extensions manually. This script solves that by standardizing the identification of market structure using a proprietary ZigZag algorithm enhanced with Average True Range (ATR) for volatility-adjusted sensitivity.
Key unique features include:
Automated Structure Detection: Instantly spots Bullish (Higher High, Higher Low) and Bearish (Lower Low, Lower High) sequences without manual input.
Dynamic Invalidation: The script monitors price action in real-time. If price breaks the invalidation point (Point A), the structure is immediately "grayed out" or deleted, preventing you from trading based on broken setups.
Golden Zone Targeting: Highlights the high-probability reversal zone between the 1.5 and 1.618 extensions, often associated with the completion of a measured move.
JSON Alerting: Built-in support for algorithmic trading with structured JSON payloads (Entry, TP, SL) ready for webhook integration.
🔬 Methodology and Concepts
The core logic operates on a three-step algorithmic sequence:
1. Pivot Identification: The script uses a "ZigZag" approach to find significant swing highs and lows. It employs an ATR-based threshold (or fixed deviation) to filter out market noise, ensuring only significant structural points are considered.
2. Geometric Validation: It evaluates the last three pivot points (A, B, C) to confirm a valid trend structure.
Bullish Setup: Point C must be higher than Point A but lower than Point B (a valid retracement).
Bearish Setup: Point C must be lower than Point A but higher than Point B.
3. Projection Mathematics: Once a valid ABC structure is locked, the script calculates extension targets using the standard formula: Target = Price C + ((Price B - Price A) * Ratio) . It also supports Logarithmic Scale calculations for assets with exponential growth, such as cryptocurrencies, ensuring proportional accuracy over large price ranges.
🎨 Visual Guide
The indicator paints a clear, detailed roadmap on your chart. Here is how to interpret the visual elements:
● Structure Lines
Solid Line (A to B): Represents the initial "Impulse" leg of the move.
Dashed Line (B to C): Represents the "Retracement" or corrective leg.
Green Structures: Indicate Bullish setups (looking for long entries).
Red Structures: Indicate Bearish setups (looking for short entries).
Gray/Dimmed Structures: These are invalidated setups where the price has breached the Stop Loss level (Point A).
● Extension Levels (Targets)
The script projects the following key Fibonacci ratios extending from Point C:
0.618 (Wave 5): An early profit-taking level, often corresponding to a truncated 5th wave.
1.0 (Measured Move): Where the extension equals the length of the initial impulse (AB = CD pattern).
1.272 (Harmonic): A common extension level for corrective structures or deep pullbacks.
Golden Zone (1.5 - 1.618): A highlighted fill area. The 1.618 level (Solid Line) is the "Golden Ratio" and is statistically one of the most significant targets in trending markets, often labeled as "Wave 3".
● Labels
Points A, B, C: Clearly marks the swing points defining the structure.
Right-Side Labels: Display the Ratio (e.g., 1.618) and the exact Price Level for easy order placement.
📖 How to Use
This tool is best used as a trend-following system.
1. Trend Identification
Wait for a new Solid Colored Structure (Green or Red) to appear. This confirms that a valid ABC retracement has occurred.
2. Entry Strategy
The "Trigger" is generally the reversal from Point C. Aggressive traders enter near C, while conservative traders may wait for a breakout above B.
Stop Loss: Place your SL just beyond Point A . If price breaks A, the script will automatically gray out the structure, signaling invalidation.
3. Profit Taking
Use the projected extension lines as dynamic Take Profit (TP) zones:
TP1: 1.0 (The Measured Move).
TP2: The Golden Zone (1.5 to 1.618). This is often the strongest target for a Wave 3 impulsive move.
4. Automation
For automated traders, create an alert using the "Any alert() function call" option. The script outputs a JSON string containing the Action, Ticker, Entry Price, TP (1.618), and SL (Point A).
⚙️ Inputs and Settings
You can fully customize the script to fit your asset class and timeframe:
● ZigZag Detection
Pivot Lookback Depth: (Default: 5) Determines how many bars to check left/right for a pivot. Higher numbers find larger, more significant structures.
Use ATR-Based Threshold: (Default: True) Adapts the sensitivity to market volatility.
ATR Multiplier: (Default: 2.0) Adjusts how much price must reverse to form a new leg.
● Structure Invalidation
Enable Structure Invalidation: (Default: True) Toggles the logic that checks if Point A is breached.
Invalidation Action: Choose "Gray Out" to keep history visible but dimmed, or "Delete" to remove failed setups entirely.
● Fibonacci Settings
Use Logarithmic Scale: Essential for crypto or long-term timeframe analysis.
Show 0.618 / 1.0 / 1.272 / 1.618: Toggles individual levels on/off to declutter the chart.
Extend Lines Right: Extends the target lines into the future for better visibility.
● Display Settings
Keep Last N Structures: Controls how many historical structures remain on the chart to prevent visual clutter.
Show Elliott Wave Labels: Adds theoretical wave counts (e.g., "Wave 3") to the ratio labels.
🔍 Deconstruction of the Underlying Scientific and Academic Framework
This indicator is grounded in Fractal Market Geometry and Elliott Wave Theory .
1. The Golden Ratio (Phi - 1.618):
Mathematically derived from the Fibonacci sequence, the 1.618 ratio is omnipresent in natural growth patterns. In financial markets, it represents the psychological "tipping point" of crowd behavior during an impulsive trend. This script emphasizes the 1.618 extension as the primary target for a "Wave 3," which is academically cited as typically the longest and strongest wave in a 5-wave motive sequence.
2. Harmonic AB=CD Patterns:
The inclusion of the 1.0 extension validates the "Measured Move" concept. Statistically, markets often move in symmetrical legs where the secondary impulse (CD) equals the magnitude of the primary impulse (AB).
3. Volatility Normalization (ATR):
By utilizing the Average True Range (ATR) for pivot detection, the script adheres to statistical volatility normalization. This ensures that the structures identified are statistically significant relative to the asset's current volatility regime, rather than relying on arbitrary percentage moves which fail across different asset classes.
⚠️ Disclaimer
All provided scripts and indicators are strictly for educational exploration and must not be interpreted as financial advice or a recommendation to execute trades. I expressly disclaim all liability for any financial losses or damages that may result, directly or indirectly, from the reliance on or application of these tools. Market participation carries inherent risk where past performance never guarantees future returns, leaving all investment decisions and due diligence solely at your own discretion.
תיקון פיבונאצ'י

ZenAlgo - GridOverview and anchoring logic
This indicator constructs a price grid based on a dynamically or manually defined price swing. The entire calculation starts by defining two anchor points that represent a completed directional move. These anchors can be selected in two ways:
Manually, by specifying a start time and an end time, where the indicator uses the candle corresponding to those times and selects either wick highs or lows depending on direction.
Automatically, by detecting significant swing points derived from recent price extremes over a configurable historical window.
The chosen anchors form a reference segment between point A and point B. This segment defines both direction and magnitude of the move. All subsequent levels and zones are derived relative to this segment, ensuring the grid adapts to current market structure rather than using fixed price distances.
Difference from traditional grid and Fibonacci tools
Unlike fixed price grids or standard Fibonacci tools that require manual anchoring and remain static once drawn, this indicator continuously derives its grid from the most relevant completed price swing. Instead of treating levels as independent horizontal prices, all values are expressed as proportions of a single measured move, allowing the grid to automatically rescale and realign as market structure evolves.
Market structure detection and directional context
Before the grid itself is drawn, the script continuously evaluates price structure using swing detection over two different sensitivities. Larger swings establish the dominant structural direction, while smaller swings can optionally be shown for internal context.
Swing highs and swing lows are detected by comparing historical highs and lows over a rolling window.
When price crosses above or below the most recent structural level, the script classifies the event as either a continuation in the same direction or a change in direction.
This structural state determines whether the grid is treated as upward or downward and influences the visual orientation of labels and zones.
This step matters because retracement and extension levels only have meaning when referenced to a clearly defined directional move.
Primary range construction between anchors
Once the anchor points are established, the indicator measures the vertical price distance between them. This distance is treated as a normalized range rather than an absolute value. Every level drawn afterward is positioned as a proportional offset of this range.
If the second anchor is above the first, the grid is considered bullish.
If the second anchor is below the first, the grid is considered bearish.
Colors and label orientation adapt automatically to this direction.
By normalizing the range, the grid remains comparable across assets and timeframes.
Retracement and extension level placement
The indicator plots a predefined set of proportional levels between and beyond the anchor points. Each level represents a fraction or multiple of the original move.
Lower values correspond to deeper retracements toward the origin of the move.
Mid-range values represent partial pullbacks within the move.
Higher values extend beyond the move, projecting potential continuation zones.
Each level is drawn as a horizontal line extending into future bars, accompanied by a label. Labels can be shown either as descriptive names or as raw proportional values, depending on user preference.
Zone construction instead of single levels
Rather than relying only on precise price lines, the indicator groups selected proportions into zones. This reflects the observation that price interaction typically occurs across ranges rather than at exact prices.
A retracement zone highlights an area between two closely spaced proportional levels.
A projection zone marks a continuation region beyond the measured move.
These zones are drawn as shaded areas extending forward in time.
Visual reference points
The indicator explicitly marks the two anchor points on the chart.
Point A represents the origin of the measured move.
Point B represents the completion of that move.
This allows the user to visually verify which price swing the grid is derived from.
How to interpret the values
All plotted levels express proportional relationships to the measured move, not independent price predictions.
Lower proportional values indicate proximity to the start of the move.
Mid-range values represent partial retracements.
Higher values indicate projected continuation areas.
How to best use this indicator
This indicator serves as a structural reference tool rather than a signal generator.
Apply it after a clear directional swing has formed.
Use higher-timeframe context to validate anchor selection.
Combine the grid with price behavior and other contextual tools.
Limitations and disclaimers
This indicator is purely proportional and structure-based.
It does not incorporate volume, volatility regimes, or fundamental data.
Automatic anchoring may differ from subjective swing selection.
Levels and zones represent reference areas, not guaranteed reaction points.
The indicator describes price structure and proportional relationships only.

TrendFib Pro by [KhedrFX]TrendFib Pro by
Automatic Fibonacci + XABC Power Tool
TrendFib Pro by (TFPro KFX)
📈 Dominate Trends with Precision Fibonacci Automation
Elevate your trading with TrendFib Pro by the smart, fully automatic Fibonacci indicator designed for trend followers, pullback hunters, and harmonic/XABC enthusiasts.
It instantly detects the latest major swing high/low → plots crystal-clear Fibonacci retracement & extension levels → highlights high-probability zones with stylish backgrounds → and projects the powerful XABC formation with B retracement (0.382 or 0.5) + dashed C target.
Perfect for scalpers, day traders, swing traders — works on Crypto, Forex, Stocks, Gold, Indices and every timeframe.
🔹 Why TrendFib Pro Stands Out
Fully Automatic Detection — No manual drawing, ever. Real-time swing-based Fibs.
Complete Fibonacci Suite — 0 | 0.236 | 0.382 | 0.5 | 0.618 | 0.786 | 1 | 1.272 | 1.414 | 1.618 levels.
XABC Pattern Projection — Shows X-A-B-C structure + future C target (dashed line) for explosive moves.
Beautiful Background Zones Semi-transparent colored boxes for instant visual confluence.
Clean & Customizable One-color mode, line styles (solid/dashed/dotted), thickness, extend left/right, label positions.
Price & Level Labels Display values, percents, or both positioned left, middle, or right.
Info Table Quick XABC price overview on the last bar for fast decisions.
Non-Repainting Reliability Stable lines & projections once swings are confirmed.
🎯 Key Features at a Glance
Dynamic lookback (default 50 bars) for accurate swing detection
Golden Pocket (0.618) & 0.5 bounce highlights
Extension targets for trend continuations (1.272, 1.414, 1.618)
XABC validation — checks no breach of B level
Max performance: 500 lines/labels/boxes to keep charts smooth
Universal any market, any timeframe (1m to monthly)
💡 How to Use TrendFib Pro Across Timeframes – Master Any Style!
TrendFib Pro shines because it's fully automatic and adapts instantly to your chart timeframe. Just switch your chart and watch it redraw the latest swing-based Fibs + XABC projection no manual tweaks needed!
Here’s how top traders use it on different timeframes:
Scalping / Intraday (1m – 15m charts)
Great for fast entries in volatile markets like crypto or forex during London/NY sessions.
Use default lookback (50 bars) or lower it to 20–30 for quicker swing detection.
Focus on 0.382 / 0.5 / 0.618 retracements for quick pullback buys in uptrends (or sells in downtrends).
Watch XABC C-target for explosive 5–20 pip/minute scalps.
Tip: Enable background zones + right-side labels for clean, fast reads. Pair with volume or RSI for confirmation. Expect more signals but filter with higher-TF bias!
Day Trading / Short-Term Swings (30m – 4h charts)
The sweet spot for most users — balances noise and reliability.
Default 50-bar lookback works perfectly here.
Hunt Golden Pocket (0.618–0.65) bounces or 0.5 retests in strong trends.
XABC projections often nail intraday reversals or continuations — use the dashed C-target as your take-profit zone.
Pro move: Check if 4h Fib aligns with daily levels for ultra-high-probability trades.
Swing Trading (Daily – Weekly charts)
Ideal for position trades, crypto holds, or forex majors.
Increase lookback to 80–150 bars (via settings) to capture bigger swings.
Prioritize 0.236 / 0.382 shallow pullbacks in strong trends, or deep 0.786 reversals.
Extensions (1.272, 1.414, 1.618) become powerful targets for multi-day/week moves.
XABC shines here B retracement often marks major turning points. Use the info table for quick price checks.
Multi-Timeframe Power Tip
Always start on a higher timeframe (e.g., Daily/4h) to get the big-picture trend & key Fib zones → then drop to your trading timeframe (e.g., 1h/15m) for precise entries at confluences.
When Fib levels from multiple TFs cluster (e.g., daily 0.618 + 1h 0.5), that's your high-probability sweet spot — success rates jump dramatically!
🚀 Your Trading Edge
Spot pullbacks in strong trends, catch reversals at key Fib levels, or ride extensions after XABC completions. Combine with your favorite tools (RSI, volume, pivots) for killer confluence.
Trusted by traders hunting high-probability setups — built for consistency and clarity.
💡 Pro Tip
Pair TrendFib Pro with PivotTrend Pro by for ultimate reversal & trend confluence across all markets.
Suitable for all markets, including highly volatile markets such as BTC, ETH, EURUSD, XAUUSD, NAS100, SPX...
📩 DM on TradingView with your username and trading goals.
Or visit linktr.ee
for all contact options.
Access is typically granted within 24–48 hours for approved traders. Limited spots — secure yours today! 🚀
⚠️ Trade Responsibly
TrendFib Pro is a professional analysis tool not a "get rich quick" system. Always use proper risk and money management.
Made with passion by
Follow me for more powerful tools → @KhedrFX on TradingView

PK Scalper Pro Neon Cloud Killzone Dashboard 📌 Overview
PK Scalper Pro — Neon Cloud + Killzone Dashboard (JST) combines a Wilders ATR trail,
Fibonacci entry zones, session/killzone context, and a 7-factor environment score
to form a dynamic trend-following scalping strategy.
It adapts in real time to volatility, aiming for higher entry precision and optimized risk.
⚠️ For educational and research purposes only. Past performance does not guarantee future results.
🎯 Strategy Objectives
React quickly to sharp moves and reversals while using hysteresis (bar confirmation)
to suppress noise and deliver stable scalping signals.
✨ Key Features
Neon Cloud visualization (Full / Entry / Premium-Discount / Fib Bands / Upper / Middle / Lower modes)
7-factor scalping score (ATR compression / ADX / Volume / Candle range / Range compression / RSI / BB width)
— quantified 0–10 to measure environment suitability
Stable state machine combining Sensitivity × Stability (confirmation bars)
to determine start/end states reliably
📊 Trading Rules
Long Entry:
Trend = +1 and price <= f2 (78.6%), with is_scalping_time = true
Optimal zone: between f3 (88.6%) and l100 (trail); automatic “Fib Entry (Long)” label
Short Entry:
Trend = −1 and price >= f2 (78.6%), with is_scalping_time = true
Optimal zone: between f3 and l100; automatic “Fib Entry (Short)” label
Exit / Reversal:
Reverse or close on Trend crossover/crossunder
When is_scalping_time = false is confirmed, prioritize taking profit
💰 Risk Management Parameters
Recommended timeframes: 1–15m (FX / Indices / Crypto)
Example: Account $10,000 / Commission 0.02% / Slippage 1.0 pips / Risk 1% per trade
SL = ATR(14) × 1.5, TP = SL × Target R:R (default 2.0)
⚙️ Trading Parameters & Considerations
ATRPeriod = 200 / ATRFactor = 8 / trailType = "modified"
Sensitivity = "Medium" (entry ≈6, exit ≈4) / Stability = "Normal" (confirmation bars = 3)
Fibonacci: ex↔trail range → f1=61.8, f2=78.6, f3=88.6, eq=50, l100=trail
Killzone shown in JST; priority order NY > LDN > TKY, with remaining time countdown
🖼 Visual Support
Highlights optimal zone (f3→100%) and Premium/Discount areas; PRIME conditions shown with purple background
Dashboard displays direction 📈/📉, score, confirmation progress, Killzone (JST), TP/SL guidance, and Session info
🔧 Strategy Improvements & Uniqueness
Introduces a 7-factor score + hysteresis to quantify and stabilize “enter/stop” conditions
Defines precise deep pullback zone (88.6–100%) as optimal entry area
Neon multi-layer cloud + fixed-row dashboard for high visibility and live stability
✅ Summary
PK Scalper Pro integrates momentum (Trend), volatility adjustment (ATR), and multi-factor scoring
into a responsive scalping framework.
Its clear visuals and practical design improve reproducibility and decision confidence.
⚠️ No guarantee of future profits — always apply disciplined position sizing and risk management.

Prev-Week-Month with V-StopPrevious Week map: It automatically plots last week’s high/low and key Fibonacci levels (50%, 61.8%, 78.6), plus optional extensions, and can extend those lines into the current week with labels.
Previous Month “Golden Zones”: It shades the prior month’s two main retracement zones (61.8%–78.6% from the month’s range) as bullish/bearish areas, optionally adds boundary lines, and labels them.
Volatility Stop (V-Stop): It draws an ATR-based trailing stop that flips between uptrend/downtrend. You can run it on the chart timeframe or a higher timeframe, and it marks reversals and HTF breach/“limbo” events. **bits of code taken from TradingView script**

Range Indicator Golden Pocket, Liquidity, FairValueGapOverview
This indicator is a comprehensive institutional market structure toolkit. It is designed to identify high-probability reversal zones by merging three powerful technical analysis concepts: Fibonacci Golden Pockets (61.8% - 65%), Liquidity Pool Analysis (Swing Failure Patterns), and Fair Value Gaps (FVG). By automating the detection of price inefficiencies and "stop runs," it helps traders navigate complex price action with objective, rule-based confirmation.
What the Script Does
The script continuously monitors a user-defined lookback period to define a trading range. Within this range, it dynamically plots:
Golden Pockets: High-confluence retracement zones (calculated as 0.35 - 0.382 internal range levels).
Liquidity Zones: Highlighted regions at the absolute high and low (Top/Bottom 5%) where institutional orders and retail stops are typically concentrated.
Swing Failure Patterns (SFP): Real-time detection of liquidity grabs where price breaches a range extreme but fails to close outside, signaling a potential trap.
Fair Value Gaps (FVG): Visualizes 3-candle price imbalances, showing areas of aggressive buying or selling that often act as future magnets or support/resistance.
2-Candle Confirmation: A momentum-based filter requiring a candle-close confirmation before a reversal signal is generated.
For Whom is it?
Smart Money Concepts (SMC) & ICT Students: Traders looking for automated liquidity sweeps and market inefficiencies.
Fibonacci & Mean Reversion Traders: Those seeking a clean, professional visualization of the Golden Pocket across multiple timeframes.
Systematic Day Traders: Who require strict price-action confirmation (SFP and 2-candle rules) to remove emotional bias from their entries.
Functions and Input Options
1. Market Structure & Visuals
Lookback Period (Default: 100): Defines the window for calculating the range extremes.
Box Offset Right (Default: 50): Extends all zones into the future for better anticipatory trading.
Show Price Lines & Labels: Displays the exact price for every zone boundary on the right axis for precise execution.
2. Fair Value Gap (FVG) Settings
Show Fair Value Gaps: A toggle to enable/disable the plotting of price imbalances.
FVG Extension (Default: 10): Determines how many bars into the future the FVG box remains visible.
Custom Colors: Separate color inputs for Bullish (Gap Up) and Bearish (Gap Down) inefficiencies.
3. Professional Alert System
The script includes five specific alert conditions:
GP Touch: Early warning when price enters a Golden Pocket.
2-Candle Pattern: Confirmed momentum shift within a Golden Pocket.
SFP Long/Short: Alerts when a Liquidity Grab (Swing Failure) is confirmed at the range high or low.
Transparency and Compliance (Moderator Info)
Non-Repainting Logic: All signals (SFP, 2-Candle, and FVG) are calculated and triggered based on confirmed candle closes. Drawings use barstate.islast purely for visual efficiency without altering historical data integrity.
Educational Context: The script visualizes well-known market principles (Fibonacci, SFPs, and FVGs) to aid traders in their analysis; it does not provide automated financial advice or "black-box" buy/sell signals.
Resource Management: Optimized for Pine Script v5, using efficient array and box handling to ensure smooth performance even on lower timeframes.

15M Swing Structure & Retracement Algo (RB Trading)This script is an intraday structure analysis tool designed to map swing behavior retracement zones and projected extensions on the fifteen minute chart. It is purpose built for EUR/USD GBP/CAD and USD/CAD and is not intended for other markets or timeframes.
The tool highlights mathematically derived retracement areas after confirmed swing formations to help traders evaluate structure rather than predict direction.
Intended Use
✓ Timeframe fifteen minute only
✓ Markets EUR/USD GBP/CAD USD/CAD
✓ Style intraday swing structure analysis
✓ Best during London and New York sessions
✓ Not designed for Asia session conditions
Core Logic
✓ Swing highs and lows detected using a configurable lookback
✓ Trend context defined by 50 and 200 EMA relationship
✓ Swing range measured between most recent confirmed pivots
✓ Key retracement zone calculated between 50 and 61.8 percent
✓ Extension reference levels projected beyond the swing range
Visual Output
✓ Swing connection line marking the measured range
✓ Retracement zone shading when price enters the 50 to 61.8 area
✓ Extension reference levels at 161.8 200 and 261.8
✓ Color coding reflects structural context
• Green for bullish structure
• Red for bearish structure
Using RB Trading DeM Bars for Confirmation
For additional confirmation users can combine this script with the free RB Trading DeM Bars indicator.
✓ The DeM Bars appear as a histogram at the bottom of the chart
✓ Best used to assess pullback quality into the retracement zone
✓ Ideal confirmation occurs when momentum fades during the pullback
✓ Expansion in momentum as price exits the zone supports continuation
The DeM Bars are not a signal tool on their own. They are designed to confirm exhaustion or reacceleration as price interacts with the structural retracement area.
Why Fifteen Minute
The calculations are calibrated for intraday behavior on the fifteen minute chart. Higher timeframes develop structure too slowly for active evaluation. Lower timeframes introduce excess noise and reduce swing reliability.
Structure Interpretation
Bullish structure
✓ 50 EMA above 200 EMA
✓ Retracements measured from swing high
✓ Extensions projected higher
Bearish structure
✓ 50 EMA below 200 EMA
✓ Retracements measured from swing low
✓ Extensions projected lower
The script reflects current structure only. It does not determine trade direction or outcome.
Inputs
✓ EMA lengths adjustable
✓ Swing lookback sensitivity
✓ Optional display toggles for zones lines and labels
✓ Reference level buffer for spread or volatility awareness
Important Notes
This tool analyzes historical price structure only. It does not provide entry signals predictions or guarantees. All levels are mathematical projections based on past price action and may or may not be respected in future movement.
Educational use only. Proper risk management is required. Test thoroughly before live application.
RB Trading

eBacktesting - Learning: Fibonacci RetracementeBacktesting - Learning: Fibonacci Retracement helps you practice one of the most common “pullback” tools in trading: Fibonacci retracements.
It automatically finds the most recent swing and draws your chosen Fibonacci levels (for example 0.382, 0.5, 0.618, 0.786) so you can clearly see where price is pulling back into “discount/premium” areas. When price taps a level (or the Golden Zone), the indicator marks it so you can review what happened next and build pattern recognition.
These indicators are built to pair perfectly with the eBacktesting extension, where traders can practice these concepts step-by-step. Backtesting concepts visually like this is one of the fastest ways to learn, build confidence, and improve trading performance.
Educational use only. Not financial advice.

Automatic Fibonacci indicator based on swing pivots.It detects key market points and plots high-probability levels used by institutional and algorithmic traders. Useful for identifying golden zones, optimal pullbacks, re-entry spots, and projection targets. Works on any asset and timeframe.

Chaban Fibonacci Precision: BTC & ETH 5m Engine Chaban Fibonacci Precision: BTC & ETH 5m Engine
Chaban Fibonacci Precision is a professional-grade trading engine meticulously engineered for the high-velocity volatility of BTC & ETH 5-minute charts. This system goes beyond standard indicators by integrating Institutional Trend Anchoring with Proprietary Fibonacci Volatility Bands, filtering out market noise to capture reversals with surgical precision.
Trend Anchor: Defines the primary market bias, ensuring you trade in sync with the "Smart Money" (Institutional flow).
Fibonacci Precision Zones: Utilizes dynamic volatility thresholds based on Fibonacci sequences to pinpoint exact exhaustion points without manual drawing.
Structural Confirmation: Integrates cloud-based structural filters to verify trend stability before issuing any signal.
Professional Interface: Designed for maximum clarity, reducing chart clutter and allowing you to focus entirely on execution.
Trend Identification: The engine establishes a clear market bias, preventing users from making the mistake of trading against the major flow.
Precision Entry: Buy/Sell signals (Triangles) are generated exactly when the price reaches our proprietary Fibonacci boundaries, indicating market exhaustion.
Dynamic Rotation: The engine immediately adjusts its bias as market structures evolve, identifying new opportunities in real-time.
Leverage: It is strongly recommended to use leverage of 5x or lower.
Position Sizing: Always utilize a layered (scaled) entry approach.
Entry Strategy: Initiate trades based on the Trend-aligned Buy/Sell signals. For additional entries, add to your position near the band boundaries in the direction of the trend.
Example: In an Uptrend, only look for entries near the Lower Band. In a Downtrend, only look for entries near the Upper Band.
Take-Profit (TP) Strategy: Once in profit, use a scaled exit strategy:
Long Positions: Scale out near the Upper Band in the direction of the trend.
Short Positions: Scale out near the Lower Band in the direction of the trend.
By following the setup shown in the provided screenshots, you will receive three types of alerts: Trend Shift, Long Signal, and Short Signal.
Note: Long and Short alerts serve as "Preliminary Entry Alerts." Therefore, they may not always coincide exactly with the appearance of the triangle icons. Always use them as a preparation signal.
Dual-Asset Optimization: Specifically tuned for the unique liquidity and volatility of BTC and ETH.
Timeframe Focused: Engineered and tested for optimal performance on the 5-minute chart for scalpers and day traders.
Invite-Only Access: A premium tool designed for disciplined traders.
To request access to the Chaban Fibonacci Precision engine or for any setup inquiries, please send a Private Message (PM) on TradingView.

Auto Session Fib (Daily / Weekly)Session-Anchored Fibonacci (RTH Only)
Automatically tracks the Regular Trading Hours session (09:30–16:00).
Fibonacci levels are built only from session high and low, not overnight noise.
Levels dynamically update throughout the session and anchor precisely at 09:30.
Session levels plotted:
High / Low
50% retracement
61.8%, 78.6%, 88.6% (bullish and bearish interpretations)
These levels are intended for intraday execution, not bias.
2️⃣ Previous Week Fibonacci (Market Context)
Displays previous week High, Low, and Fibonacci retracements.
Lines are confined strictly to the prior week (no overlap into the current week).
Levels are shown in a faint gray to distinguish context from execution.
Each key fib level includes descriptive labels, not just numbers:
61.8% → Golden Zone anchor
78.6% → Deep pullback / last defense
88.6% → Trend failure / trap zone
These are decision-framing levels, designed to help identify where trends either hold or fail.
3️⃣ Previous Day Extension Zones (Expansion Targets)
Calculates previous day range and projects:
+1.618 / +1.786
−1.618 / −1.786
Draws filled zones (no borders) between:
1.618 ↔ 1.786
−1.618 ↔ −1.786
Boxes extend only across the current RTH session.
These zones represent expansion / exhaustion areas, not reversal signals by themselves.
4️⃣ RSI Turn Signals (Clean, Non-Repainting)
Uses a standard RSI, with:
Adjustable length
Adjustable overbought / oversold levels
Optional independent RSI timeframe (can differ from chart TF)
Signals trigger only on a turn, not while RSI remains extreme:
Buy: RSI crosses up through oversold
Sell: RSI crosses down through overbought
This indicator is built to answer three questions:
Where am I relative to important structure?
Is price extended or mean-reverting?
Is there a confirmed momentum turn?

Fibonacci 5 Candles Retracement
================================================================================
FIBONACCI 5 CANDLES RETRACEMENT - STRATEGY GUIDE
================================================================================
WHAT DOES THIS STRATEGY DO?
---------------------------
This strategy automatically identifies market trends and uses Fibonacci
retracements to find the best entry points. The idea is simple: when price
makes a strong movement (trend), it often pulls back before continuing in
the same direction. The strategy captures these "pullbacks" to enter at the
right moment.
HOW IT WORKS?
-------------
1. TREND DETECTION
The strategy looks for 5 consecutive candles of the same color:
- 5 red candles = BEARISH trend (price falls)
- 5 green candles = BULLISH trend (price rises)
2. CALCULATION OF START AND END POINTS
For a BEARISH trend (5 red candles):
- START: The highest point between the first red candle and the previous one
- END: The lowest point reached during the 5 candles (and beyond, if the
trend continues)
For a BULLISH trend (5 green candles):
- START: The lowest point between the first green candle and the previous one
- END: The highest point reached during the 5 candles (and beyond, if the
trend continues)
3. DYNAMIC UPDATE
The END point updates automatically if price continues to move in the
direction of the trend, creating new highs (for bullish trends) or new
lows (for bearish trends).
4. TREND END
Normal Mode:
- BEARISH trend ends when a candle closes above the previous candle's open
- BULLISH trend ends when a candle closes below the previous candle's open
"Extended Trend" mode (optional):
- The trend remains active until a candle closes beyond the dynamic 50%
retracement level
- When this happens, the END point "freezes" (stops updating), but the
trend can continue
5. FIBONACCI RETRACEMENT CALCULATION
Once START and END are identified, the strategy automatically calculates
Fibonacci levels. IMPORTANT: for retracements and pending orders, we
consider START as 100% and END as 0%, because we work on the part of the
trend that is recovered (the pullback).
The retracement levels are:
- 70% = level closest to START (smallest retracement)
- 60% = second level
- 50% = central level (often used for entry)
- 25% = level closest to END (largest retracement)
6. PENDING ORDER PLACEMENT
When a trend is identified and completed, the strategy automatically places
a pending order (limit order) at one of the selectable Fibonacci levels.
Available levels:
- 25%: closest to END
- 50%: central level (balanced)
- 60%: closest to START
- 70%: very close to START
The order direction depends on the trend:
- BEARISH trend → SHORT order (bet that price falls)
- BULLISH trend → LONG order (bet that price rises)
Stop Loss and Take Profit (for retracements):
- Stop Loss: always at START level
- Take Profit: always at END level
EXTENDED TAKE PROFIT:
If the order is executed (filled), the strategy can apply an "Extended
Take Profit" if configured. IMPORTANT: for the extended TP calculation,
we consider START as 0% and END as 100% (the original trend movement).
For example, if you set 3%, the Take Profit will be at 103% of the
original trend movement instead of 100%.
AVAILABLE FILTERS
-----------------
1. MINIMUM TREND (pips)
Filters trends that are too small. If a trend is below the set value:
- START and END labels become gray (instead of red/green)
- No pending order is placed
- The trend is still displayed on the chart
Useful for avoiding trading movements that are too small.
2. EMA FILTER
Uses two moving averages (EMA 50 and EMA 200) to filter direction:
- If active: places LONG orders only when EMA50 > EMA200 (uptrend)
- If active: places SHORT orders only when EMA50 < EMA200 (downtrend)
Useful for trading only in the direction of the main trend.
3. EXTENDED TREND
Modifies how the trend is considered "completed":
- If disabled: uses normal logic (opposite candle)
- If active: the trend remains in formation until a candle closes beyond
the dynamic 50%. When this happens, END freezes but the trend can continue.
Useful for capturing longer trends and extended movements.
VISUALIZATION
-------------
The strategy displays on the chart:
1. START AND END LABELS
- Red color for bearish trends
- Green color for bullish trends
- Gray color if the trend is not valid (too small)
- Remain visible even when new trends form
2. START AND END LINES
- Horizontal lines indicating the start (START) and end (END) points of the trend
- White color by default, customizable from the settings panel
- Update dynamically when the END point changes
- Can be shown or hidden via the "Show Start/End Lines" option
3. FIBONACCI LINES
The strategy shows horizontal lines at retracement levels:
- Line at 50% (yellow by default)
- Line at 25% (green by default)
- Line at 60% (azure by default)
- Line at 70% (red by default)
COLOR CUSTOMIZATION:
All line colors can be customized from the settings panel in the
"LINE COLORS" section:
- Start/End Line Color: customize the color of START and END lines
- 50% Line Color: customize the color of the 50% line
- 25% Line Color: customize the color of the 25% line
- 60% Line Color: customize the color of the 60% line
- 70% Line Color: customize the color of the 70% line
Lines update dynamically when the END point changes and can be shown or
hidden individually via options in the "VISUALIZATION" section.
4. PENDING ORDER LABELS
Show pending order information:
- Direction (LONG or SHORT)
- Entry price
- Stop Loss
- Take Profit
Positioned far from the chart to avoid cluttering the visualization.
ALERTS
------
If enabled, alerts send notifications when:
1. PENDING ORDER CREATED
When a new pending order is placed, with all information.
2. PENDING ORDER UPDATED
When the pending order is updated (for example, if the level changes or
if the END point moves).
3. ORDER OPENED
When the pending order is executed (filled) and the position is opened.
Alerts can be configured in TradingView to send notifications via email,
SMS, or other platforms.
RECOMMENDED SETTINGS
--------------------
To get started, you can use these settings:
VISUALIZATION:
- Show all lines and labels to see how it works
- Show Start/End Lines: true (to display lines at START and END points)
- Customize line colors in the "LINE COLORS" section according to your preferences
STRATEGY:
- Pending Order Level: 50% (balanced)
- Extended TP: 0% (use standard TP at 100%)
FILTERS:
- Minimum Trend: 0 pips (disabled initially)
- Use EMA Filter: false (disabled initially)
- Extended Trend: false (use normal logic)
ALERTS:
- Enable Alerts: true (if you want to receive notifications)
PRACTICAL EXAMPLE
-----------------
Scenario: Bearish Trend
1. Price forms 5 consecutive red candles
2. The strategy identifies:
- START = 1.2000 (highest point)
- END = 1.1900 (lowest point)
- Range = 100 pips
3. Calculates Fibonacci levels (for retracements: START = 100%, END = 0%):
- 100% = 1.2000 (START)
- 70% = 1.1930
- 60% = 1.1940
- 50% = 1.1950
- 25% = 1.1975
- 0% = 1.1900 (END)
4. If you set "Pending Order Level" to 50%:
- Places a SHORT pending order at 1.1950 (50% retracement)
- Stop Loss at 1.2000 (START = 100%)
- Take Profit at 1.1900 (END = 0%)
5. If price rises and touches 1.1950:
- The order is executed
- Opens a SHORT position
- If price falls to 1.1900 → Take Profit (profit)
- If price rises to 1.2000 → Stop Loss (loss)
IMPORTANT NOTE
--------------
This strategy is a technical analysis tool. Like all trading strategies,
it does not guarantee profits. Trading involves risks and you can lose money.
Always use appropriate risk management and test the strategy on historical
data before using it with real money.
LICENSE
-------
This code is open source and available for modification. You are free to
use, modify, and distribute this strategy. If you republish or share a
modified version, please kindly mention the original author.
================================================================================

Complete G4 | CG4 (DTD)This script was built with the intention of improving day trading capabilities for the Futures market, namely for NQ.
The novelty of the script are the Ghetto Fibonacci Opening Range Retracement (G4) levels themselves and HOW they are calculated, providing Fibonacci pivot projections after the first 1-minute candle of the day. It is believed and understood that some major algorithms establish their positions within the first 30 seconds, defining a traded range for the day. With the help of some familiar Fibonacci levels and some custom ones, we can identify strong potential areas of support and resistance throughout the session. This process is repeated at New York and Globex open to obtain the projected full daily candle range for a futures instrument.
To support trade location context, signal alerts are provided for candles that interact with the lines given certain criteria. Some of the criteria deals with previous data such as high, low, open, and close, relative to the last N candles. An ATR gate is included and adjustable to filter for candle significance as well. The intention is to turn the indicator into a strategy that is used for algorithmic trading.
To make this indicator more of a one-stop-shop, I've also added some other public scripts as optionable toggles, but extremely helpful to build context for trade bias. Both SHLFE ( ) and Order Block ( ) indicators were added, with the Order Block indicator getting a buff that allows users to pick a second timeframe to display recent order blocks.
I do recommend starting with just the G4 lines in the beginning to learn how to read price action around the lines, then adding in the context from the other two indicators:
There will be many updates to come that improves functionality and reliability of the trade signals with improved logic.
Access will be temporary until the end of Q1 2026.
'Then Jesus said, “Come to me, all of you who are weary and carry heavy burdens, and I will give you rest. Take my yoke upon you. Let me teach you, because I am humble and gentle at heart, and you will find rest for your souls. For my yoke is easy to bear, and the burden I give you is light.”'
Matthew 11:28-30

Golden Zone Structure [Kodexius]Golden Zone Structure is a ZigZag based market structure and Fibonacci tool designed to make swing context easier to read directly on the price chart. It detects meaningful pivot highs and lows, labels the evolving structure (HH, HL, LH, LL, including equal highs and lows), and automatically projects a Fibonacci map across the most recent completed swing.
Instead of forcing you to manually anchor Fib tools after every new leg, the script rebuilds levels each time a fresh pivot is confirmed. This makes it well suited for traders who focus on swing continuation, pullback depth, and reaction zones where liquidity and orderflow often concentrate.
A key emphasis is the Golden Zone highlight. The indicator shades the zone that is most relevant to the current swing context so you can quickly spot where a retracement is approaching a higher probability reaction area, without cluttering the chart with too many permanent objects.
The tool is intentionally visual and configurable. You can choose pivot source (High/Low or Close), adjust swing sensitivity via ZigZag period, switch color themes, and decide how much detail you want on screen (levels, zigzag lines, labels).
Optional trading markers can be enabled for users who want a lightweight “zone interaction” prompt. These markers are not intended as a standalone trading system. They are meant to complement your own confirmation rules (structure alignment, volume, higher timeframe bias, or price action triggers).
🔹Features
🔸 ZigZag Swing Engine
- Uses a configurable ZigZag period to filter noise and confirm swing points only when the lookback logic validates the move.
Supports different pivot sources (High/Low or Close) so you can choose between cleaner structure or more reactive behavior depending on the instrument.
Optional ZigZag leg drawing to visualize swing flow without clutter.
🔸 Market Structure Labels (HH, HL, LH, LL + Equals)
- Automatically labels each confirmed pivot based on how it compares to the prior pivot of the same type.
High side classification: H, HH, LH, EH.
Low side classification: L, HL, LL, EL.
Equal highs and lows help reveal potential liquidity pools and “magnet” areas where price often reacts or breaks with intent.
🔸 Auto Fibonacci Map on the Active Swing
- Rebuilds Fibonacci levels every time a new pivot is confirmed, keeping the projection aligned with the most recent completed leg.
Core retracement levels: 0.236, 0.382, 0.500, 0.618, 0.786.
Extension levels: 1.272 and 1.618 for expansion targeting and continuation mapping.
Optional price labels on each level, formatted to tick size so levels remain readable across markets.
🔸 Golden Zone Highlighting (Context Aware)
- Highlights the most relevant retracement band with a soft fill so you can spot “zone approach” moments at a glance.
The zone selection adapts to swing context, focusing on a different retracement region depending on whether the last confirmed pivot is a peak or a trough.
Adjustable transparency keeps the chart clean while preserving the key reaction area.
🔸 Visual Customization + Themes
- Multiple color themes (Neon, Ocean, Sunset, Monochrome) so the tool fits different chart styles and backgrounds.
Independent toggles for Fib levels, Golden Zone shading, ZigZag lines, and price labels.
Line width controls for better scaling across timeframes.
🔸 Optional Trading Markers + Alerts
- Optional BUY and SELL labels based on zone interaction logic with candle confirmation filters.
ATR based placement offset scaled by sensitivity so labels stay visually separated during volatility.
Built in alert conditions for new pivot highs and new pivot lows so you can monitor structure changes without watching every bar.
▶ Practical Usage Tip
• Use structure labels to define bias (HH + HL for bullish structure, LH + LL for bearish structure).
• Use the Golden Zone as a location filter, then wait for your own trigger (break of minor structure, rejection candle, volume shift, etc.).
• Treat extensions as “map points” not guaranteed targets. They work best when structure supports continuation.

Cosmic Crypto Golden ZoneCosmic Crypto Golden Zone
## Overview
**Cosmic Crypto Golden Zone** is an all-in-one swing trading indicator designed to identify high-probability retracement entries using Fibonacci levels, multi-timeframe confluence, and a simple Buy/Sell scoring system. The indicator removes the guesswork from trading pullbacks by combining structure analysis, momentum indicators, and volume confirmation into a single, easy-to-read signal.
**Best Used For:** Swing trading on 15m, 1H, and 4H timeframes in crypto, forex, and stocks.
---
## Key Features
### 🎯 Golden Zone Detection
Automatically identifies the optimal entry zone (0.5 - 0.786 Fibonacci retracement) where price is most likely to reverse and continue the trend.
### 📊 Buy/Sell Scoring (1-10)
A simplified signal table that scores setups from 1-10, telling you exactly when to buy or sell without needing to interpret multiple indicators.
### 📈 Multi-Timeframe Confluence
Filters trades to align with the higher timeframe trend (default: 4H), ensuring you only trade in the dominant direction.
### 🔍 Structure Detection (HH/HL/LH/LL)
Tracks market structure with Higher Highs, Higher Lows, Lower Highs, and Lower Lows to determine trend direction.
### 💧 Liquidity Sweep Detection
Identifies when price sweeps beyond the 0.886 level (stop-hunting zone) and reclaims the entry zone—a premium reversal signal.
### 📉 RSI Divergence Detection
Spots bullish and bearish divergences within the golden zone for additional confirmation.
### 🛡️ Dynamic Stop Loss
ATR-based stop loss that adjusts to current volatility, protecting you in both calm and volatile markets.
### 🎯 Smart Take Profit
Calculates TP based on your chosen entry point (FOMO, ENTRY, or Average) with customizable Risk:Reward targeting.
---
## How to Read the Signal Table
The table in the bottom-right corner gives you everything you need at a glance:
| Row | What It Shows |
|-----|---------------|
| **BUY/SELL + Score** | Direction and strength (1-10) |
| **Action** | 🚀 NOW (8+), ✓ READY (6-7), 👀 WATCH (4-5), ⏳ WAIT (<4) |
| **Zone** | Whether price is IN the golden zone or waiting |
| **Entry / TP / SL** | Your exact trade levels |
| **R:R** | Risk-to-Reward ratio with quality indicator |
### Score Breakdown
| Score | Meaning | Action |
|-------|---------|--------|
| **8-10** | High conviction setup | Enter on next candle close |
| **6-7** | Good setup | Enter with confirmation candle |
| **4-5** | Possible setup | Wait for more confluence |
| **1-3** | Weak/No setup | Skip this trade |
---
## How to Use: Step-by-Step
### Step 1: Check the Trend Direction
Look at the **Structure** in the info display:
- **BULLISH** (HH + HL pattern) → Only look for BUY signals
- **BEARISH** (LL + LH pattern) → Only look for SELL signals
### Step 2: Wait for Price to Enter the Golden Zone
The golden zone is highlighted between the **FOMO (0.618)** and **ENTRY (0.786)** levels. The table will show "✓ IN ZONE" when price reaches this area.
### Step 3: Check Your Score
Wait for the Buy/Sell score to reach **6 or higher** before considering an entry. Higher scores = higher probability.
### Step 4: Look for Confirmation
The best entries have multiple confirmations:
- ✅ Score 6+
- ✅ In Golden Zone
- ✅ Stochastic oversold/overbought
- ✅ RSI Divergence (DIV label)
- ✅ Liquidity Sweep (LIQ label) — *Premium signal*
- ✅ Bullish/Bearish candle pattern
### Step 5: Execute the Trade
Use the levels shown on the chart and in the table:
- **Entry:** FOMO (aggressive) or ENTRY (conservative)
- **Stop Loss:** Below/above the SL line (red)
- **Take Profit:** At the TP line (green)
---
## Chart Labels Explained
| Label | Color | Meaning |
|-------|-------|---------|
| **FOMO: ** | Green | 0.618 Fib - Aggressive entry level |
| **ENTRY: ** | Yellow (Bold) | 0.786 Fib - Conservative entry level |
| **LIQ: ** | Red | 0.886 Fib - Liquidity/stop-hunt zone |
| **TP: ** | Green | Take Profit target |
| **SL: ** | Red (Bold) | Stop Loss level |
| **R:R ** | Green/Orange | Risk-to-Reward ratio |
| **HH/HL/LH/LL** | Various | Structure swing labels |
| **DIV** | Lime/Pink | RSI Divergence detected |
| **LIQ** (arrow) | Lime/Red | Liquidity sweep signal |
| **AE** | Green/Red | Williams Vix Fix Aggressive Entry |
| **B/S** | Green/Red | Buy/Sell signal with score |
---
## Recommended Settings
### For Crypto (BTC, ETH, Altcoins)
- **Timeframe:** 1H or 4H
- **HTF:** 4H or Daily
- **Use Logarithmic Fibs:** ✅ ON
- **TP R:R Target:** 2.0 - 3.0
### For Forex
- **Timeframe:** 15m or 1H
- **HTF:** 4H
- **Use Logarithmic Fibs:** ❌ OFF
- **TP R:R Target:** 1.5 - 2.0
### For Stocks
- **Timeframe:** 1H or Daily
- **HTF:** Daily or Weekly
- **Use Logarithmic Fibs:** ✅ ON
- **TP R:R Target:** 2.0
---
## Settings Reference
### Structure (ZigZag)
- **Left Bars:** Lookback period for pivot detection (default: 10)
- **Right Bars:** Confirmation bars (default: 2)
- **Show Swing Labels:** Display HH/HL/LH/LL markers
### Multi-Timeframe Confluence
- **Enable MTF Filter:** Only trade when aligned with HTF trend
- **Higher Timeframe:** The timeframe to check trend (default: 4H)
### ADX Trend Strength
- **Enable ADX Filter:** Filter out choppy/ranging markets
- **ADX Threshold:** Minimum ADX value for trend confirmation (default: 20)
### Auto Fib Settings
- **Use Logarithmic Fibs:** Better for large % moves (crypto/stocks)
- **Fib Length:** How far the fib lines extend
### Split-Entry Trade Planner
- **Entry 1 Ratio:** FOMO level (default: 0.618)
- **Entry 2 Ratio:** ENTRY level (default: 0.786)
- **TP Calculation Mode:** Base TP on ENTRY, FOMO, or Average
- **TP R:R Target:** Your desired risk-to-reward ratio
- **Use ATR-Based Dynamic SL:** Volatility-adjusted stop loss
- **SL ATR Multiplier:** How many ATRs below entry for SL
### Williams Vix Fix
- **Show Bullish/Bearish AE:** Aggressive entry signals based on volatility extremes
- **Only Show in Golden Zone:** Filter VixFix signals to golden zone only
---
## Pro Tips
### 1. The Liquidity Sweep is Gold
When you see the **LIQ** arrow after price wicks below 0.886 and reclaims 0.786, this is often the best entry. Stops have been hunted, weak hands are out, and smart money is entering.
### 2. Don't Fight the HTF Trend
If the 4H is bearish, don't take long signals on the 15m just because the score is high. Always align with the bigger picture.
### 3. Wait for "IN ZONE"
Patience pays. The best setups come when price actually pulls back to the golden zone. Chasing breakouts leads to poor R:R.
### 4. Score 6+ is the Minimum
Scores of 4-5 can work, but your win rate will be significantly higher waiting for 6+. Scores of 8+ are rare but highly reliable.
### 5. Use Multiple Timeframes
Check the setup on your trading timeframe AND one timeframe higher. If both show bullish structure with good scores, confidence is higher.
### 6. Respect the Stop Loss
The SL is placed below the liquidity zone for a reason. If price closes below it, the setup is invalidated. Don't move your stop.
---
## Alerts Available
- **High Confluence Long/Short** — When score reaches your threshold
- **Bullish/Bearish Liquidity Sweep** — Premium reversal signal
- **RSI Divergence Detected** — Divergence in golden zone
- **Williams Vix Fix AE** — Aggressive entry signal
---
## Credits
Created by **Cosmic Crypto**
Combines concepts from:
- Fibonacci Retracement Trading
- Smart Money Concepts (Liquidity Sweeps)
- Williams Vix Fix
- Multi-Timeframe Analysis
- Stochastic RSI
- ADX Trend Strength
---
*Trade responsibly. Past performance does not guarantee future results. Always use proper risk management.*

Auto-Anchored Fibonacci Volume Profile [Custom Array Engine]Description:
1. The Theoretical Foundation: Structure vs. Participation In professional technical analysis, traders often struggle to reconcile two distinct datasets: Price Geometry (where price should go) and Market Participation (where money actually went).
Why Fibonacci? (The Structure) Fibonacci Retracements map the mathematical structure of a trend. They identify psychological and algorithmic "interest zones" (0.382, 0.5, 0.618) where a correction is statistically likely to terminate. However, Fibonacci levels are theoretical—they are "lines in the sand" that do not guarantee liquidity or reaction.
Why Volume Profile? (The Verification) Volume Profile maps the historical exchange of shares at specific price levels. It reveals "fair value" (High Volume Nodes) and "market imbalance" (Low Volume Nodes). It is the only tool that verifies if a specific price level was actually accepted by institutional participants.
2. Underlying Calculations (The Custom Engine) This script operates on a custom-built calculation engine that bypasses standard built-in functions entirely. It uses Pine Script Arrays to build a Volume Profile from scratch. Here is the breakdown of the proprietary code logic:
A. The "Smart-Fill" Distribution Algorithm (Solves Gapping)
The Problem: Standard volume scripts often assign a candle's entire volume to a single price row. In volatile markets or steep trends, this creates visual "gaps" or a "barcode" effect because price moved too fast to register on every row.
My Solution: I wrote a custom loop that calculates the vertical overlap of every candle against the profile grid.
The Math: Volume Per Bin = Total Candle Volume / Bins Touched.
The Result: If a single volatile candle spans 10 price rows (bins), the script mathematically divides that volume and distributes it equally into all 10 array indices. This generates a solid, continuous distribution curve that accurately reflects price action through the entire candle range, not just the close.
B. Dynamic Arrays & Split-Volume Logic The script initializes two separate floating-point arrays (buyVolArray and sellVolArray) sized to the user's resolution (up to 300 rows). It iterates through the specific time-window of the swing:
If Close >= Open, the calculated volume slice is injected into the Buy Array.
If Close < Open, it is injected into the Sell Array.
These arrays are then visually stacked to render the dual-color profile, allowing traders to see the "Delta" (Buyer vs. Seller aggression) at key structural levels.
C. Custom Garbage Collection (Performance) To enable the "Auto-Anchoring" feature without causing chart lag or visual artifacts ("ghosting"), the script includes a Garbage Collection System. Before drawing a new profile, the script iterates through a tracking array of all existing objects (box.delete, line.delete) and clears them from memory. This ensures the indicator remains lightweight and responsive even when dragging chart margins or switching timeframes.
3. The Synthesis: Why Combine Them? The core philosophy of this script is Confluence . A Fibonacci level without volume is merely a suggestion; a Fibonacci level backed by volume is a defensive wall. By algorithmically anchoring a Volume Profile to the exact coordinates of a Fibonacci swing, this tool allows traders to instantly answer critical questions:
"Is the Golden Pocket (0.618) supported by a High Volume Node (HVN), or is it a Low Volume Node (LVN) that price might slice through?"
"Is the Shallow Retracement (0.382) holding because of structural support, or just a lack of selling pressure?"
4. How to Read the Indicator
The Geometry: The script automatically detects the trend and draws standard Fib levels (0, 0.236, 0.382, 0.5, 0.618, 0.786, 1.0).
The Confluence Check: Look for the Point of Control (Red Line). If this High Volume Node aligns with a key Fib level (e.g., the 0.618), the probability of a reversal increases significantly.
The Imbalance Check: Look for "Valleys" in the profile (Low Volume Nodes). These gaps often act as "slippage zones" where price travels quickly between structural levels.
Buy/Sell Splits: The dual-color bars (Teal/Red) reveal the composition of the volume. A 0.618 level held up by dominant Buy Volume is a stronger bullish signal than one with mixed volume.
5. Settings & Customization
Lookback Length: Sensitivity of the swing detection (Default: 200 bars).
Resolution: Granularity of the profile rows (Default: 100). Higher values provide smoother definition.
Width (%): Responsive sizing that scales the profile relative to the trend's duration.
Extend Lines: Option to project structural levels infinitely to the right.
Disclaimer This script is an analytical tool for visualizing historical market data. It does not provide trade signals or financial advice.

GHOST Premium IndicatorGHOST Premium Indicator – Session ORB + True Day Open Levels
GHOST Premium is a full session-mapping tool built for futures traders who live off levels, not guesses. It automatically plots:
15-Minute ORB Zones for
Asia (19:00 NY)
London (03:00 NY)
New York (09:30 NY)
Each ORB is drawn as a dynamic box that tracks the high/low during the window, then locks in and projects high, low, and midline rays forward into the session so you can trade clean reaction levels.
Asia Session High/Low (19:00–00:00 NY)
Choose between Rays, Boxes, or Both.
Session high/low rays extend right across the chart.
Optional “extreme candle” boxes from a user-selected timeframe (1–15m) give you a visual anchor for key impulsive moves.
Labels for Asia High/Low stay pinned to the right edge of the chart using a configurable offset.
London Session High/Low (03:00–08:00 NY)
Same logic as Asia: live-updating session high/low, projected as rays or boxes.
Session objects persist until 16:50 NY, then auto-clean so your chart never gets cluttered.
Labels for London High/Low and their boxes also slide with price to the right side of the chart.
True Day Open (TDO)
Calculates calendar day open at 00:00 ET, even though the futures session starts at 18:00.
Draws a horizontal ray from TDO across the entire day.
Drops a “TDO” label on the level and keeps it pinned to the right edge with its own adjustable offset.
Fully customizable ray color, label color, and line width.
All key visuals are user-configurable: session toggles, colors, transparency, line widths, midline style, label offsets, and extreme-candle timeframes.
Use GHOST Premium to instantly see where Asia, London, NY, and the True Day Open are controlling order flow – so you can build your bias and executions around the same levels smart money respects.

Fibonacci Projection with Volume & Delta Profile (Zeiierman)█ Overview
Fibonacci Projection with Volume & Delta Profile (Zeiierman) blends classic Fibonacci swing analysis with modern volume-flow reading to create a unified, projection-based market framework. The indicator automatically detects the latest swing high and swing low, builds a complete Fibonacci structure, and then projects future extension targets with clear visual pathways.
What makes this tool unique is the integration of two volume-based systems directly into the Fibonacci structure. A Fib-aligned Volume Profile shows how bullish and bearish volume accumulated inside the swing range, while a separate Delta Profile reveals the imbalance of buy–sell pressure inside each Fibonacci interval. Together, these elements transform the standard Fibonacci tool into a multi-dimensional structural and volume-flow map.
█ How It Works
The indicator first detects the most recent swing high and swing low using the Period setting. That swing defines the Fibonacci range, from which the script draws retracement levels (0.236–0.786) and builds a forward projection path using the chosen Projection Level and a 1.272 extension.
Along this path, it draws projection lines, target boxes, and percentage labels that show how far each projected leg extends relative to the previous one.
Inside the same swing range, the script builds a Fib-based Volume Profile by splitting price into rows and assigning each bar’s volume as bullish (close > open) or bearish (close ≤ open). On top of that, it calculates a Volume Delta Profile between each pair of fib levels, showing whether buyers or sellers dominated that band and how strong that imbalance was.
█ How to Use
This tool helps traders quickly understand market structure and where the price may be heading next. The projection engine shows the most likely future targets, highlights strong or weak legs in the move, and updates automatically whenever a new swing forms. This ensures you always see the most relevant and up-to-date projection path.
The Fib Volume Profile shows where volume supported the move and where it did not. Thick bullish buckets reveal zones where buyers stepped in aggressively, often becoming retestable support. Thick bearish buckets highlight zones of resistance or rejection, particularly useful if projected levels align with prior liquidity.
The Delta Profile adds a second dimension to volume reading by showing where buy–sell pressure was truly imbalanced. A projected Fibonacci target that aligns with a strong bullish delta, for example, may suggest continuation. A projection into a band dominated by bearish delta may warn of reversal or hesitation.
█ Settings
Period – bars used to determine swing high/low
Projection Level – chosen Fib ratio for projection path
-----------------
Disclaimer
The content provided in my scripts, indicators, ideas, algorithms, and systems is for educational and informational purposes only. It does not constitute financial advice, investment recommendations, or a solicitation to buy or sell any financial instruments. I will not accept liability for any loss or damage, including without limitation any loss of profit, which may arise directly or indirectly from the use of or reliance on such information.
All investments involve risk, and the past performance of a security, industry, sector, market, financial product, trading strategy, backtest, or individual's trading does not guarantee future results or returns. Investors are fully responsible for any investment decisions they make. Such decisions should be based solely on an evaluation of their financial circumstances, investment objectives, risk tolerance, and liquidity needs.

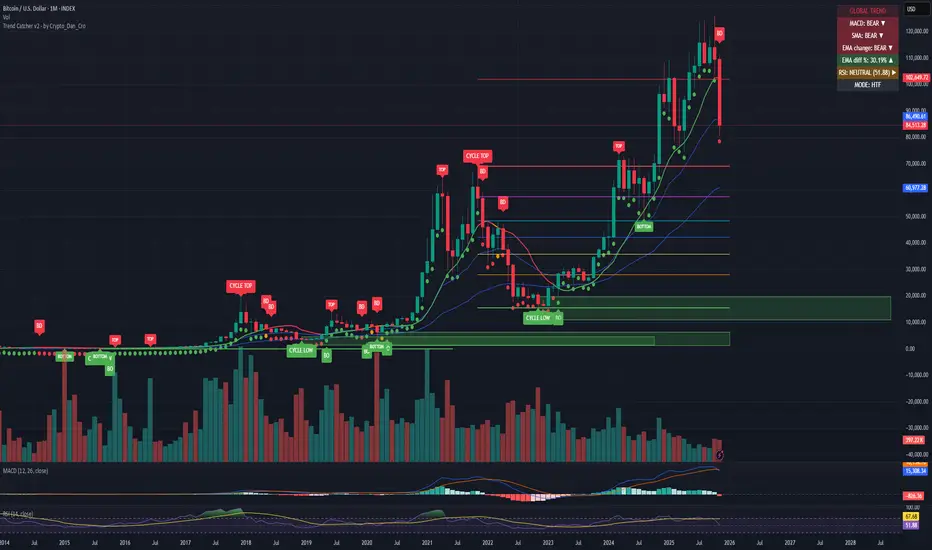
Trend Catcher - Alpha v2 - by Crypto_Dan_CroIf you want to get this indicator, contact me on
X handle: @crypto_dan_cro
What is Trend Catcher v2?
This is the only indicator you need ;)
This indicator is a proprietary market analysis system designed to identify high-probability trading zones by synchronizing multiple layers of market structure, momentum behaviour and cyclical dynamics.
It dynamically adapts to changing market conditions by evaluating:
- macro trend alignment
- structural price positioning
- momentum acceleration & deceleration
- volatility-based reaction zones
- cycle maturity levels
The system filters out low-quality setups and highlights only areas where multiple hidden conditions align, providing:
- trend continuation signals
- structural shift detection
- cycle-based expansion targets
- adaptive support & resistance mapping
Rather than reacting to price alone, the indicator anticipates areas where market psychology historically shifts, allowing traders to position themselves ahead of major moves.
Core philosophy:
This tool does not attempt to predict the market — it tracks the underlying pressure points where probability favours expansion or exhaustion.
It functions as:
- a trend alignment engine
- a cycle decoder
- a volatility interpreter
- a structure validation system
What it gives the user:
- Clear visual guidance without overloading the chart
- Objective market context independent of emotion
- Early trend recognition
- Cycle-aware price targeting
- Decision zones instead of random entries
Ideal for:
- traders who trade structure, not noise
- investors who respect market cycles
- strategists focused on probability over prediction
- disciplined entries & exits
In short:
It is a market interpretation framework built for traders who think two steps ahead.
Contains:
1. Higher Timeframe mode (Monthly / Weekly) on all timeframes
2. Current Chart Timeframe mode
3. Global Trend via BTC MACD
4. SMA
5. EMA
6. BO (Break Out), BD (Break Down) signals
7. TOP & BOTTOM Detection
8. Support & Resistance Zones
9. RSI confirmation
10. Smart Info Panel (Global trend, MACD, SMA, EMA, RSI statuses - Bull, Bear, Neutral)
11. Monthly timeframe (Fibbonaci Retracement levels)
12. Monthly timeframe (all Cycle tops, and Cycle bottoms)
Crypto markets are volatile, if you choose to use this indicator for trading, you are doing it on your own. Crypto_dan_cro is not responsible for any profits or losses created by using this Indicator.
Fibonacci Set-upThe indicator plots Fibonacci retracements based on recent lows and highs.
Additionally it calculates position size, max leverage, max drawdown and pricelevels.
fibonacci2Library "fibonacci2"
Useful methods to calculate and display fibonacci retracement
modelParamsNew(point_0, point_1)
Parameters:
point_0 (chart.point)
point_1 (chart.point)
modelParamsNew(this, point_0, point_1)
Parameters:
this (viewParams)
point_0 (chart.point)
point_1 (chart.point)
method toModelParams(this, point_0, point_1)
Namespace types: viewParams
Parameters:
this (viewParams)
point_0 (chart.point)
point_1 (chart.point)
method createModel(params)
Namespace types: modelParams
Parameters:
params (modelParams)
method createView(this, params)
Namespace types: model
Parameters:
this (model)
params (viewParams)
method delete(view)
Namespace types: view
Parameters:
view (view)
levelModelParams
Fields:
level (series float)
levelViewParams
Fields:
level (series float)
color (series color)
line_width (series int)
line_style (series lineStyleEnum enum from Hamster-Coder/drawing/1)
levelModel
Represents a Fibonacci retracement level
Fields:
level (series float) : The Fibonacci level ratio (e.g., 0.382, 0.5, 0.618)
value (series float) : The Y-coordinate on the chart corresponding to this level
modelParams
Represents the full parameter set for the Fibonacci retracement model
Fields:
point_1 (chart.point) : Coordinates of the anchor Point (1) of the model
point_0 (chart.point) : Coordinates of the anchor Point (0) of the model
levels (array) : List of levels to display for this model
model
Fields:
point_1 (chart.point)
point_0 (chart.point)
levels (array)
viewParams
Fields:
levels (array)
x1 (series int)
x2 (series int)
xloc (series string)
show_level_value (series bool)
value_format (series string)
force_overlay (series bool)
view
Fields:
model (model)
lines (array)
labels (array)

Auto Fib Retracement-custom lines📈 Auto Fib Retracement (with Custom Line Thickness)
This indicator provides an automatic application of Fibonacci Retracement and Extension levels based on key Pivot points on the chart. It uses advanced logic to identify relevant momentum based on user-defined parameters, ensuring dynamic and accurate level drawing without the need for manual measurement.
Key Features of the Indicator ✨
Automatic Drawing: Fibonacci levels are automatically drawn based on the last significant Pivot swing detected by the indicator.
Fibonacci Retracement and Extension: Displays classic retracement levels (such as 0.382, 0.5, 0.618) and extensions (such as 1.272, 1.618, 2.618, etc.), with the option to individually toggle the visibility of each level.
Custom Line Width (New Feature): This is the key added functionality! For every Fibonacci level, an option has been included to individually adjust the line thickness (width). This allows traders to visually highlight (bold) critical support/resistance levels (like 0, 0.618, 1, etc.) to make them more noticeable on the chart.
Pivot Customization: Control the sensitivity of Pivot detection using the "Deviation" and "Depth" parameters.
Line Extension: Options to extend the Fibonacci lines to the left, right, or both sides.
Detail Display: Ability to show/hide Fibonacci values (levels) and prices on the labels.
⚙️ Input Parameters
This indicator offers complete control over how the Fibonacci levels are displayed:
Deviation: A multiplier that affects how much the price must deviate from the previous pivot for a new pivot to be formed. Increasing the value makes the indicator less sensitive; decreasing it makes it more sensitive.
Depth: The minimum number of bars considered when calculating the pivots.
Reverse: Option to reverse the drawing direction (from top to bottom or vice-versa).
Extend Left/Right: Controls the extension of the Fibonacci lines.
Level Settings (0, 0.236, 0.382, 0.5, 0.618, etc.):
Checkbox: Turn the display of each individual Fibonacci level on or off.
Value: Customize the Fibonacci value (e.g., you can change 0.618 to 0.65).
Color: Adjust the line color.
Line Width: Crucial option! Allows you to set the line thickness from 1 to 5. Use this to emphasize the most important levels.
Background Transparency: Adjust the transparency of the background fill between the Fibonacci levels.
How to Use It 💡
This tool is ideal for traders who use Fibonacci Retracement to determine potential areas of support and resistance, profit targets (extensions), and entry zones. Use the Custom Line Width option to visually set apart the key levels you believe have the most significant impact on the market (e.g., 0, 0.5, 0.618, and 1).

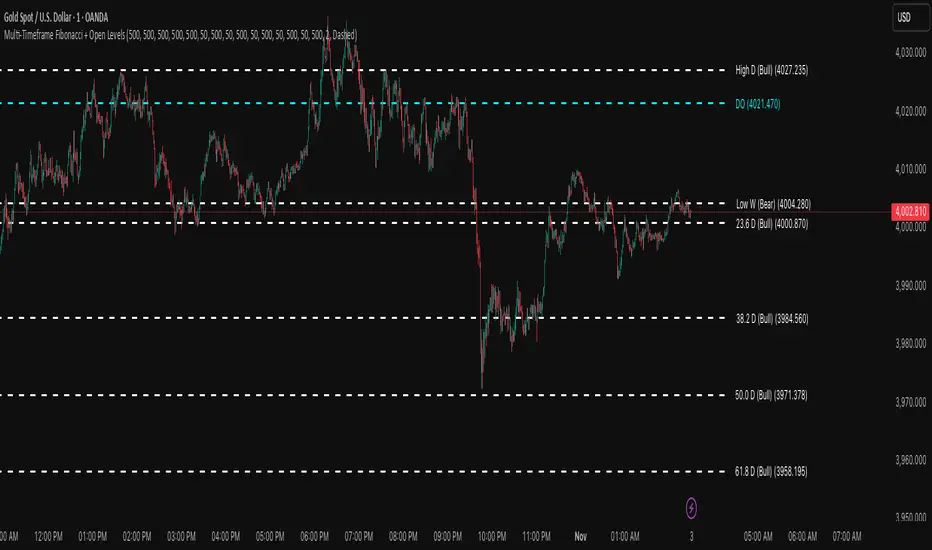
Multi-Timeframe Fibonacci + Open Levels🟣 Multi-Timeframe Fibonacci Levels + Open Levels | Trade Symmetry
This indicator automatically plots Fibonacci levels derived from higher timeframe candle ranges — all at once, directly on your current chart.
It helps you quickly visualize confluence zones and reaction levels where institutional traders are likely to participate.
⚙️ Features
✅ Multi-timeframe Fibonacci Levels — Daily, Weekly, Monthly, Quarterly & Yearly
✅ Automatic Bullish/Bearish detection based on previous candle
✅ Dynamic overlap detection (combines overlapping Fib levels into a single clean label)
✅ Configurable Fibonacci levels, colors, and styles
✅ Optional Open-Price Levels (Daily, Weekly, Monthly)
✅ Clean memory management to keep your chart lightweight
🧠 How to Use
• Add it to any timeframe — it will automatically overlay higher timeframe Fibs.
• Use overlapping or aligned Fib zones as confluence areas.
• Combine with structure or liquidity indicators for high-probability setups.
💡 Inspired by
The concept of higher-timeframe Fibonacci confluences used in Smart Money Concepts (SMC) and ICT-style analysis.