Forexsignals


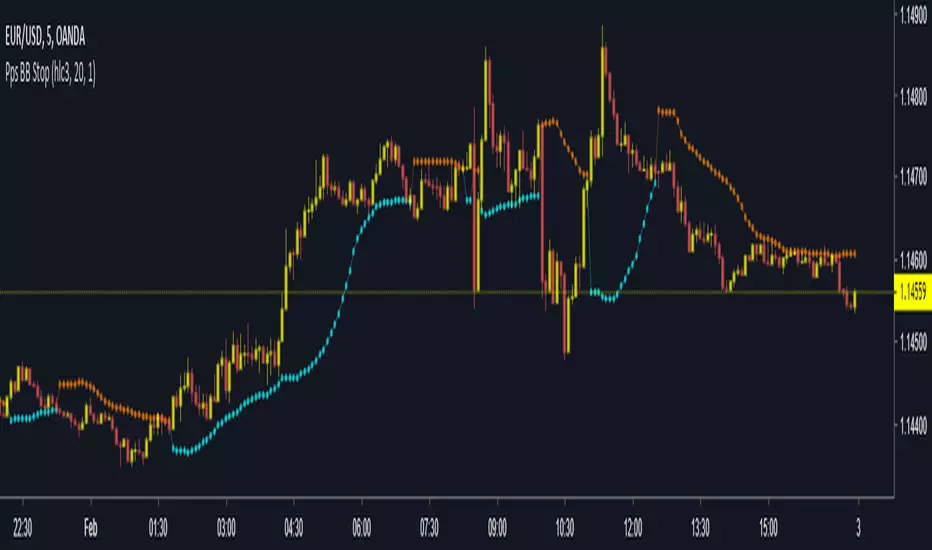
LetsTrendShortThis Special Indicator pairs great with kiki, and it is meant to let you know when a high probability short opportunity arises.
Only one rule to this indicator, Only enter a short trade when the signal candle is below the purple line.
Comments? Concerns? Post them in the comments below, really just looking for feedback from traders.
Happy Trading!
Bitcoin: 3M8cMjWXCbMBRbgMPS95wZGDZXXecL5q9v
Litecoin: MWd2E3T2BwZrPbS3DdYx2vvuapwoPQmvFo

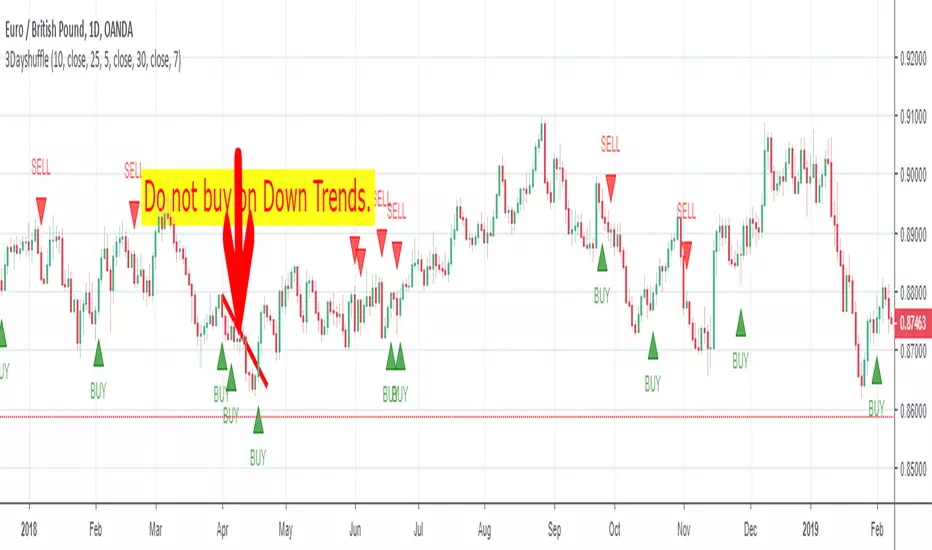
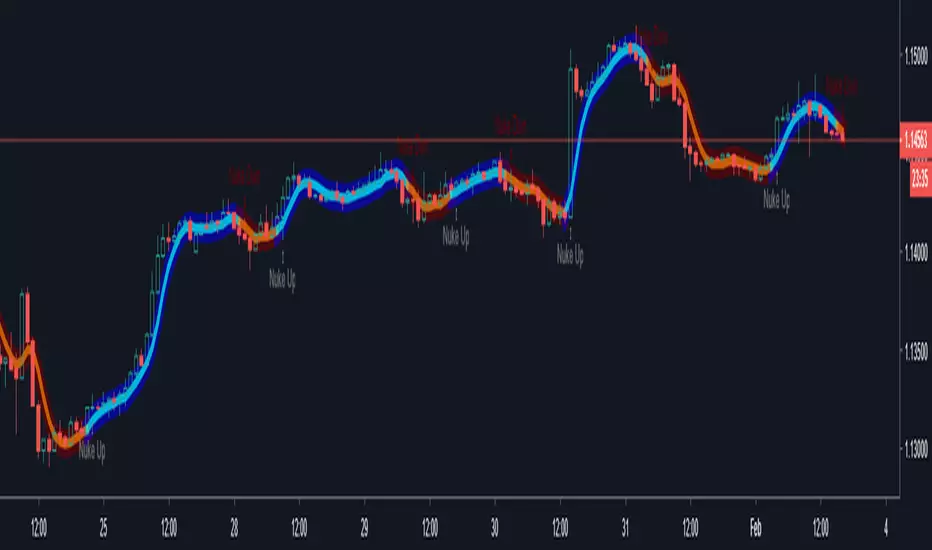
3DayshuffleThe 3 Day Shuffle Indicator indicates the best time to buy and sell based on a secret sauce. This is an Indicator not a strategy. Quick tip, keep the profits small(30-40pips) or Trail Stop it and keep the SL around 30-50 pips. Any comments Appreciated!
Any Tips are appreciated!
Bitcoin: 3M8cMjWXCbMBRbgMPS95wZGDZXXecL5q9v
Litecoin: MWd2E3T2BwZrPbS3DdYx2vvuapwoPQmvFo

PpSignal Inver Fisher WilliamsThe Inverse Fisher Transform (IFISH) was authored by John Ehlers. The IFISH applies some math functions and constants to a weighted moving average (wma) of the relative strength index (rsi) of the closing price to calculate its oscillator position. The user may change the input (close) and period lengths. This indicator’s definition is further expressed in the condensed code given in the calculation below.
www.motivewave.com

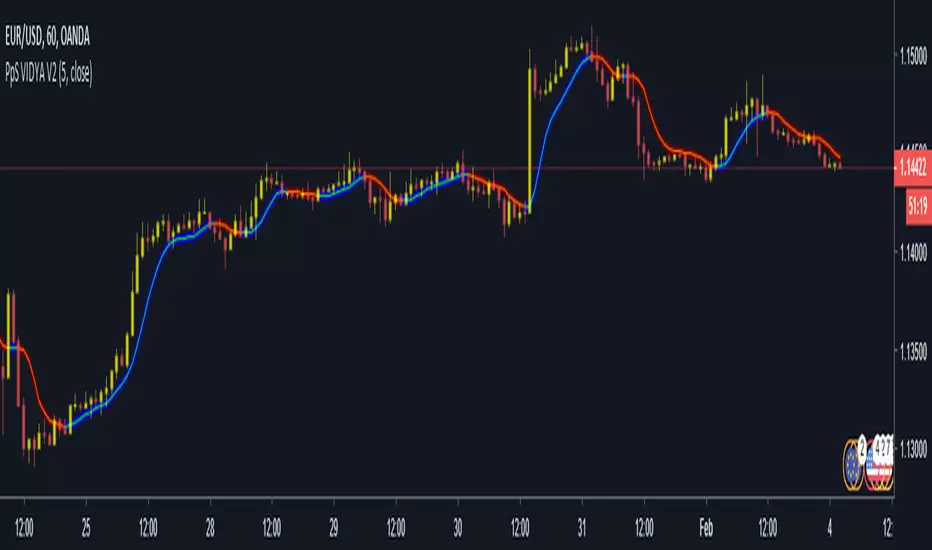
PpSignal Variable Index Dynamic Average V2The Moving Average is, perhaps, the most popular indicator in trading for a reason. Comparatively, the crossing average can tell you plenty about a trend, i.e. whether it’s broken or unbroken, changing or holding. But the Moving Average isn’t perfect; there is one area where it falls short and that is volatility. Even an Exponential Moving Average, which places more emphasis on the latest data, can miss the mark when it comes to a sudden change in volatility, rising or falling. Consequently, it can either give a fake signal or else generate a signal only when it is too late to trade on. Volatility is where the Variable Index Dynamic Average comes in, or VIDYA for short.
The Variable Index Dynamic Average or VIDYA was developed by Tushar Chande, and its focus is precisely on volatility. In other words, the VIDYA is an average that adjusts itself to changing volatility. When volatility is high, the VIDYA becomes more sensitive and when volatility is low, the VIDYA becomes less sensitive. That allows you to assess the trend according to current market conditions (and not irrelevant conditions that had earlier prevailed).
The VIDYA in Essence
The math behind the VIDYA formula is quite complicated, but the logic is not.
The VIDYA essentially has two components, the first being the Exponential Moving Average (aka EMA). The second indicator is in the “oscillator family” and it is known as the Chande Momentum Oscillator (aka CMO). Like most oscillators, the Chande Momentum Oscillator generates a signal of -100 and 100, with -100 being oversold and 100 overbought. The EMA is the anchor index, and the CMO’s job is to adjust the exponential average to volatility. The closer the CMO is to 100 or -100 the higher the volatility and the more sensitive our exponential average will turn. Conversely, the closer the CMO is to 0 the less sensitive our exponential average will turn. The final reading after the volatility adjustment is the VIDYA.
As you can see below, once you add the Variable Index Dynamic Average in MetaTrader you get a window with two parameters from which to choose: One is the Period CMO and the other is Period EMA. We can then decide which period the CMO will run on (and thus affect the sensitivity of our EMA) and which period the EMA will run on (to capture our trend). Usually, the best CMO to plug in is a third of the value of the EMA duration; this is to allow the latest change in volatility to impact to the greatest degree. If the CMO period is too long, it will likewise spread over the period too long and consequently fail to reflect current levels of volatility, thus defeating the VIDYA’s purpose.
VIDYA
Comparing the VIDA to the EMA
When we compare the two, we can see the clear advantages the VIDYA(Red) has over the EMA(Green). Both the VIDYA and the EMA run on a 30-week period, but the VIDYA is smoothed out by the Chande Momentum Oscillator running on a 10-week period (again, a third of the whole period). The VIDYA simply captures the trend much more accurately. We can see how, in Point A, when momentum weakens, the Variable Index Dynamic Average starts to flatten, while the EMA just moves across the price and fails to adjust.
This quality is especially beneficial when we want to get an indication if a trend has broken or not. The EMA, in this case, suggests the trend has, indeed, broken but when we look at the VIDYA we quickly get a more accurate picture. We can see that the downtrend has not been broken which allows us to prepare for another bearish round rather than mistakenly expect a rebound.
VIDYA
Of course, for every upside there is a downside and the downside of the VIDYA is that it becomes less effective on a very high duration, such as above 90. The Chande Momentum Oscillator cannot reflect sentiment very well when the duration ןד high and therefore it stops being effective at balancing the Exponential Moving Average within the Variable Index Dynamic Average. One way to tackle or mitigate this is to go higher in the intervals whenever possible, such as from days to weeks or weeks to months. Nonetheless, you should be cognizant of this in inherent weakness in the Variable Index Dynamic Average. Yet, despite that, the Variable Index Dynamic Average does a very effective job. If you are trading under volatile conditions and want to figure out if a trend is broken or set to continue, the Variable Index Dynamic Average could be the solution. When combined with other indicators of momentum, the VIDYA can give you the bigger, clearer picture.
www.onestepremoved.com

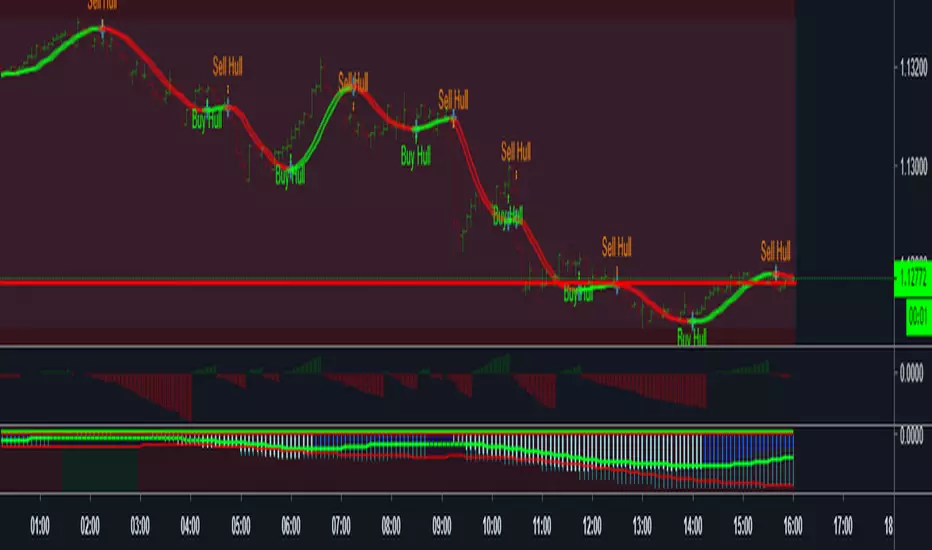
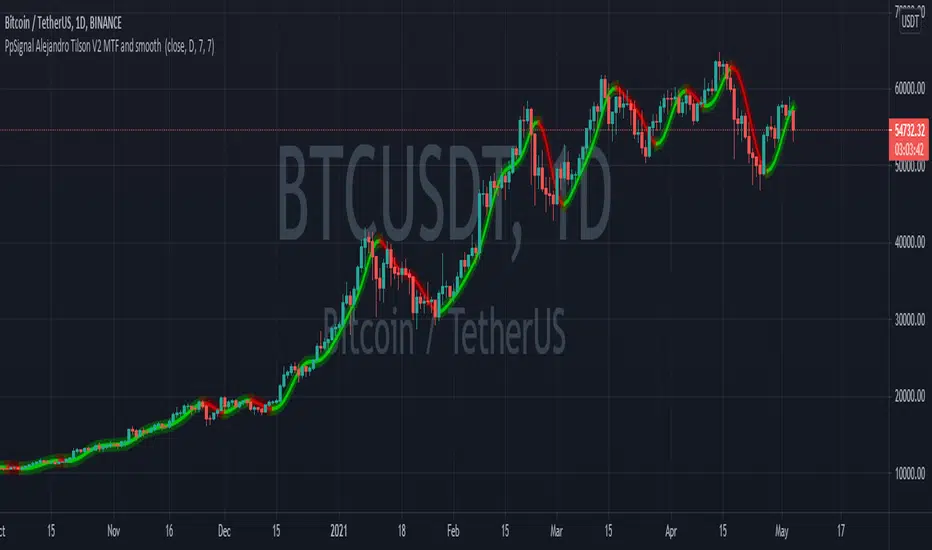
Alejandro Tilson T3 V2 MTFTilson Move average with John Ehlers smooth system adn buy or sell signal trade.
enjoy
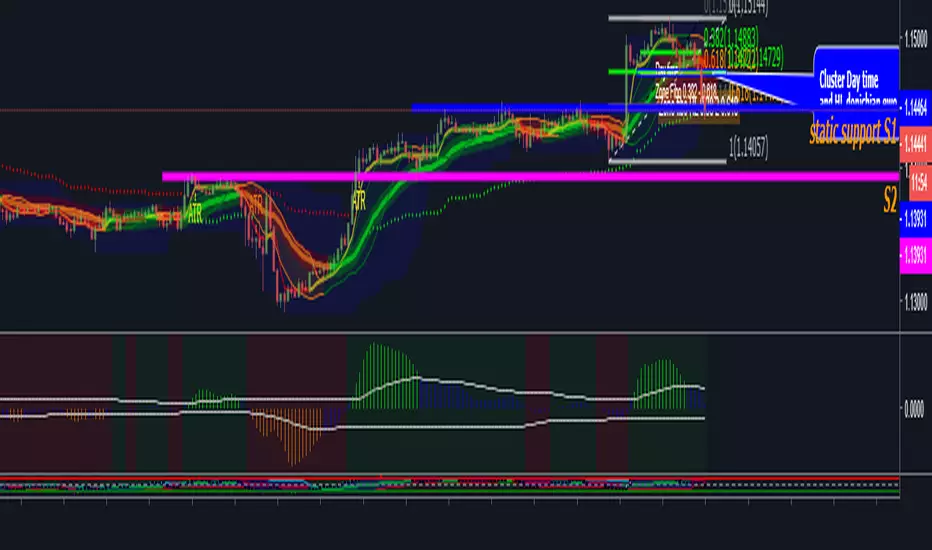
PpSignal Personal TemplateThis is my personal template strategy, I follow the tendency, with
-Donichian: I can se the high and low price.
-CFB: ha can see the trend short.
-Tigger MA: i can see the long trend.
-BB: I can see the short trend and the volatily.
-Ewo break band and Rsi Donicihan channel, the trend and oversold and overbought.
-PPSignal Scalper Double Cross Signal and EWO Smooth V4.0 for the background trend.
PpSignal Candle converter and psignal golden fibo zone.
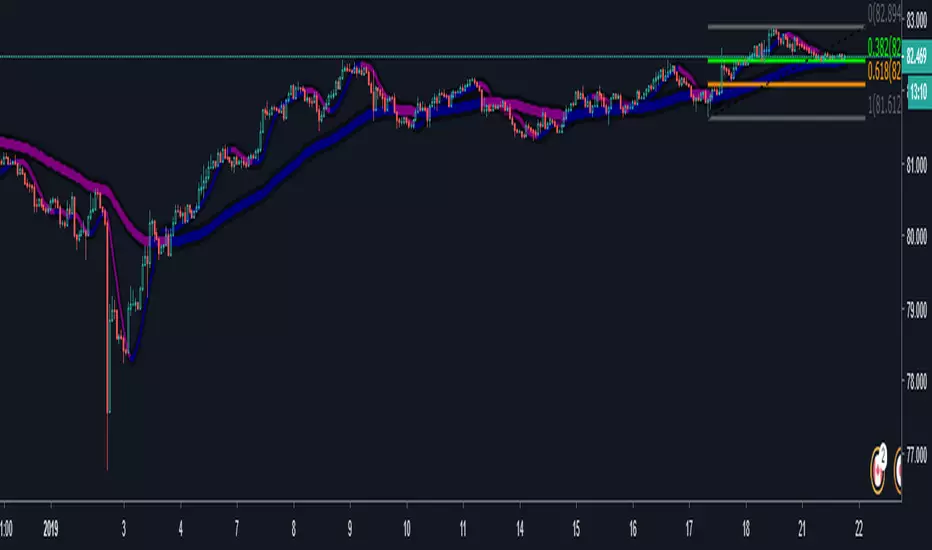
PpSignal Fibonacci Golden Zonefibonacci golden zone is a popular forex system for buy or sell fibo areas.
Buy in 38 fibo zone and sell in 61 fibo zone. when the fiboncci trend is up, the fill color between 28 and 61 is yellow, when the trend is down the fibonacci color is red.
a recommended use some move average with some oscillator for a find the trend.
Move average recommended serhttps://www.tradingview.com/script/guQUYY7J-PpSignal-Trend-Follow/
Oscillator see
Oscillator Based Scalping (Forex Majors)This is a scalping strategy based on oscillator divergences.
Tested on ForexICE market data.
Signal might appear and disappear during candle making since it is based on Moving Average and therefore acts on close, but since candle closed signal is final and does not repaint.
1M timeframes is recommended for bot trading. 5M-15M is more suitable for manual trading.
Full list of tested intraday timeframes below:
EUR-USD - 1M-5M-15M
USD-JPY - 1M-5M
GBP-USD - 1M
AUD-USD - 1M-5M-15M
USD-CHF - 1M-15M
NZD-USD - 1M-5M-15M
USD-CAD - 1M-5M
There is 2 more similar trading strategies that im finishing now, 1 for BITMEX ETHUSD and XBTUSD contracts, and 1 for bitmex alts. Should be ready in a day or two.
Additional notes on executing trades:
-Trade should be entered as close to sell signal as possible. You can enter at market at red circle candle or at limit at top of sell signal candle. In both cases your target is red Moving Average and entering at market just makes overall R/R for a trade is lower yet limit order might not always get filled.
-This strategy doesnt have a defined stop loss by itself, but your target is a moving average and 1-1 risk reward should be enough. Although the win rate is much higher than 50% so you can be less greedy if you feel like playing it safer.
-Strategy itself uses pyramiding, so i would recommend averaging up if you get 2-3 consecutive sell signals above moving average.
-It is assumed that you have OANDA spread rates or better.
-- Free trial for 24 hours. Contact me here or at twitter.com --

FX Scalping Indicators (Revised)This is an edit from: 1 minute 'Forex Scalping Strategy'
Added realistic Stop/Loss + Take Profit
Now works fluently with 1-15 Minute charts.
Adjusted EMA lengths
Tested on other majors and provides the same if not better results. (:
I'll be using this upon open and will update with live results.

Megalodon
Why Megalodon?
We believe that enlightening others is an incredible way to make this world a better place. That's why we created the tools you need to stop worrying about your investments and focus on what really matters in your life.
What is Megalodon?
Megalodon uses Artificial Intelligence that combines 574 back-tested indicators and 2674 back-tested setups, simultaneously.
Megalodon works with any kind of asset , market state and time frame .
What is the win rate?
Megalodon is extremely accurate and offers insane profits as long as the fundamental analysis is done right .
Backtesting results can be found on our social media or down below .
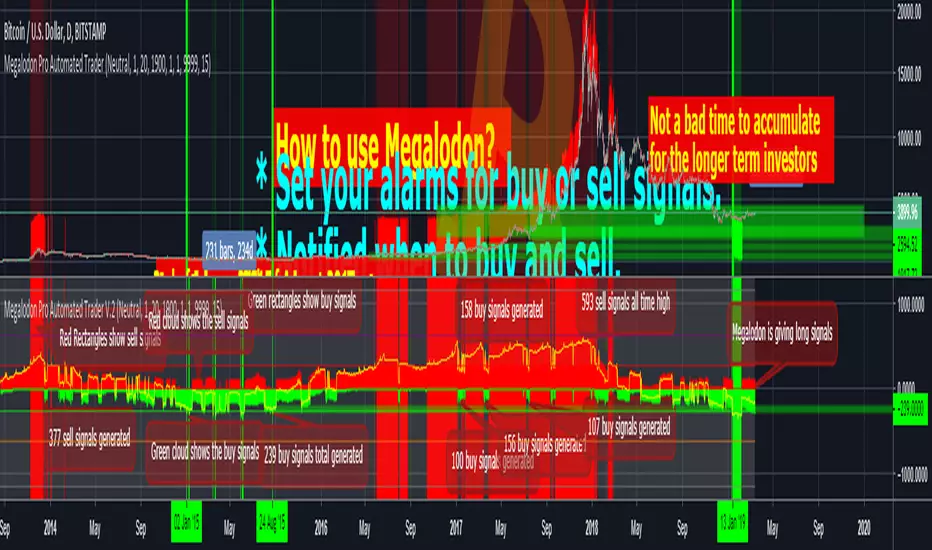
How to use Megalodon Pro Automated Trader?
Simply, orange rectangles are buy signals and purple rectangles are sell signals .
Green clouds show buy signals and red clouds show sell signals.
Yellow line shows the difference between buy and sell counts.
How to set alarms on Megalodon Pro Automated Trader?
Click on Alert, select Megalodon Pro Automated Trader and click on Buy-Signal or Sell-Signal. More details can be found on our social media.
You may also watch our Megalodon Investing Tutorials on Youtube for more information.
How to purchase?
Megalodon is totally FREE .
You may upgrade to Megalodon Pro for the most important features , including automizing your trading on any asset profitably, setting up alarms to get notified , joining to our VIP telegram channel to get daily updates and our VIP telegram group to interact with the community. Simply go to our website on our TradingView page for learning more and joining us for free.
Some of the backtesting results are:
BTC/USD for longer time frame trading in the bear market for the last year.
APPLE for longer time frame trading in the bull market for the last 10 years.
EURO/USD for day trading in the neutral market for the last month.
BTC/USD for day trading in the bull market for the last 15 days.
APPLE for day trading in the neutral market for the last 2 days and 6 hours.
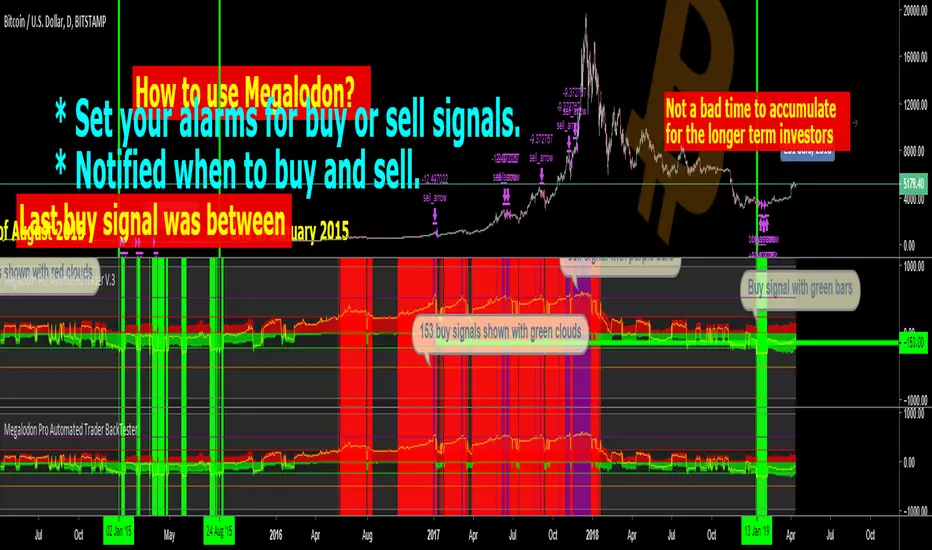
Megalodon Pro Automated Trader BackTester
Why Megalodon?
We believe that enlightening others is an incredible way to make this world a better place. That's why we created the tools you need to stop worrying about your investments and focus on what really matters in your life.
What is Megalodon?
Megalodon uses Artificial Intelligence that combines 574 back-tested indicators and 2674 back-tested setups, simultaneously.
Megalodon works with any kind of asset , market state and time frame .
What is the win rate?
Megalodon is extremely accurate and offers insane profits as long as the fundamental analysis is done right .
Backtesting results can be found on our social media or down below .
How to use Megalodon Pro Automated Trader?
Simply, orange rectangles are buy signals and purple rectangles are sell signals .
Green clouds show buy signals and red clouds show sell signals.
Yellow line shows the difference between buy and sell counts.
How to set alarms on Megalodon Pro Automated Trader?
Click on Alert, select Megalodon Pro Automated Trader and click on Buy-Signal or Sell-Signal. More details can be found on our social media.
You may also watch our Megalodon Investing Tutorials on Youtube for more information.
How to purchase?
Megalodon is totally FREE .
You may upgrade to Megalodon Pro for the most important features , including automizing your trading on any asset profitably, setting up alarms to get notified , joining to our VIP telegram channel to get daily updates and our VIP telegram group to interact with the community. Simply go to our website on our TradingView page for learning more and joining us for free.
Some of the backtesting results are:
BTC/USD for longer time frame trading in the bear market for the last year.
APPLE for longer time frame trading in the bull market for the last 10 years.
EURO/USD for day trading in the neutral market for the last month.
BTC/USD for day trading in the bull market for the last 15 days.
APPLE for day trading in the neutral market for the last 2 days and 6 hours.
CRYPTONYY TRADING MACHINEThia script will automatically gives you long and short signals.
WORKS ON ALL EXCHANGE.
SUITABLE FOR BITMEX TRADING.
FOR ALTCOINS TRADING GO FOR 30MIN OR ABOVE 30MIN TIMEFRAME.
AUTOMATIC STOP LOSS TRIGGER.
MORE NEW UPDATES COMING!!!

Top 10 Forex Swing Screener V 1.0
Top 10 Forex Swing Screener
Options:
Left-bars and Right-bars look back to find Top | Bottom point.
Set Alarm: After add script on your chart, click on add alarm and select the scrip name below your chart symbol, then select alarm you need and add.
Guide for colors and shapes:
Green: Price Cross Over high swing.
Red: Price Cross Under low swing.
Orange: Price Cross Over low swing or Price Cross Under high swing.
Green Triangle Up: pivot High in symbol.
Red Triangle Down: pivot Low in symbol.
Note: The script operates independently of the chart you in. for use this script, you can favorite it and then apply to any chart.

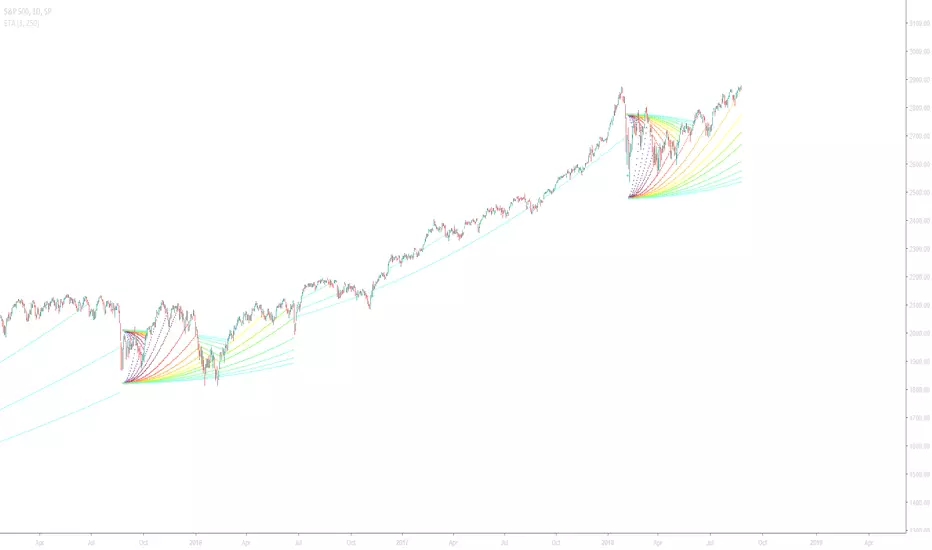
Extreme Trend Amplifier (ETA)Introduction
This indicator was created in V3 Pinescript and all projections will be displayed in real-time for active trading use.
This indicator has been designed so that it can be used across a range of securities such as equities, bonds, FX and cryptocurrencies.
All time-stamps are supported.
Comment and Like to try it out!
Understanding the Extreme Trend Amplifier
Extreme price changes are often result in a change of trend. This indicator not only allows you to identify the breakout, but to follow the direction of the change. Below is an example of the indicator using normal input values and the Dark TradingView Theme.
The Extreme Trend Amplifier is an indicator that measures the rate of change within a bar of the time stamp and plots a function when the user-defined threshold has been breached. The plot projects parabolic lines that squeeze towards the market price at an ever-increasing rate. The acceleration can also be defined in the indicator settings panel.
Indicator Utility
The first example below is the forex pair, AUD/USD using a rate threshold of 1% and an acceleration factor of three and the second using a rate threshold of 0.8% and an acceleration factor of nine.
We can observe that an increased rate threshold results in fewer instances and that a higher acceleration factor results in the instance projecting farther.
Notice that the acceleration factor is inversely related.
Input Values
Select the “ Format ”, button located next to the indicator label to adjust the input values and the style.
Rate of change (ROC) is the percentage rise/fall of the security within the time stamp. If ROC is set to 1, this is directly proportionate to 1%.
Securities such as cryptocurrencies are very volatile and will require an increased threshold.
Forex pairs will require a reduced threshold in order to produce an output as volatility is far less.
The line color, thickness and style can also be personalised to customise the strategy even further.
In this example, I have adjusted the projected instance that appears below the bars blue and above the bars red, indicating an uptrend or downtrend.
It is also possible to change specific bars in order to identify the extent to which a trend has continued as seen below.
If you would to find out more about this indicator, visit www.kenzing.com