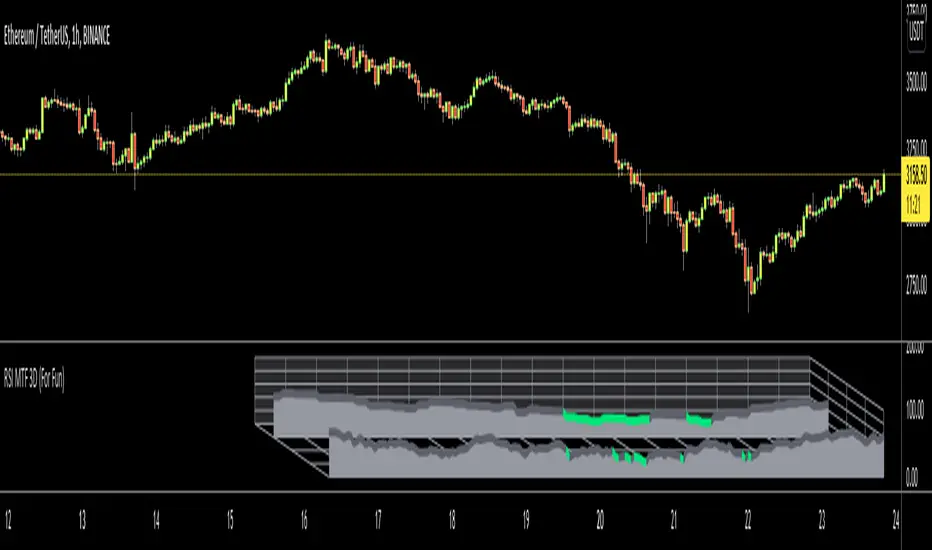
3D Isometric MFI (Christmas Edition) [Kodexius]3D Isometric MFI (Christmas Edition) is a visual-first interpretation of the classic Money Flow Index, rendered as a projected 3D-style ribbon using an isometric mapping. Instead of plotting a standard oscillator line, the script reconstructs recent MFI history as a depth-aware ribbon that moves from back to front, producing a layered perspective effect that helps you read momentum shifts, regime transitions, and relative strength changes as a continuous structure.
This Christmas Edition was also built for fun and as a creative seasonal experiment. The goal is to keep the underlying indicator logic familiar, while presenting it in a playful, “3D showroom” style that looks great in a separate oscillator panel.
The indicator is designed for presentation quality and chart readability. It uses controlled object management (lines, polylines, labels) and renders only the most recent portion of the MFI history (user-defined depth). A decorative snow background effect adds atmosphere.
🔹 Features 🎄
🔸 Isometric 3D Projection Engine
The ribbon is produced by projecting 3D points (time offset, MFI value, depth) into 2D chart coordinates.
- X represents bar offset into history
- Y represents the MFI value
- Z introduces depth and perspective
Angle controls the projection direction, and Vertical Zoom scales the perceived amplitude.
🔸 Depth-Limited Ribbon Rendering (Back to Front)
Only the most recent History Depth values are drawn to keep performance and readability stable.
- Each segment connects two consecutive MFI values
- A top edge, bottom edge, and filled face are drawn to simulate thickness
- Older segments fade into the background
🔸 Dynamic Gradient Coloring + Depth Fade
Ribbon color follows a value-based gradient:
- Lower values lean red (risk-off pressure)
- Higher values lean green (risk-on pressure)
- Mid values blend naturally
Transparency increases with depth so older history is less dominant but still readable.
🔸 Tip Label (Value + Candy Marker) 🍭🍬
The most recent ribbon tip displays current MFI value.
A candy symbol that switches based on the 50 midpoint
The label is offset so it does not cover the ribbon tip.
🔸 Projected Reference Grid (80, 50, 20)
A projected grid is drawn at classic MFI reference levels to improve orientation:
- 80 Overbought reference
- 50 Midpoint reference
- 20 Oversold reference
These grid lines use the same projection math, so they stay aligned at any angle or zoom.
🔸 Seasonal Snow Background Effect ❄️
Randomized snow is rendered behind the ribbon using lightweight labels. This is purely decorative and does not alter MFI values or logic.
🔸 Object Lifecycle Management
Because 3D-style drawing uses many objects, the script manages them explicitly by storing references in arrays, deleting old objects, and redrawing on the last bar. This helps prevent visual stacking artifacts and keeps the panel clean.
🔹 Calculations
1) Money Flow Index Computation
The script separates “positive” and “negative” money flow based on the direction of change in the selected source, then converts their ratio into the standard 0 to 100 oscillator. Classic MFI Calculations.
calc_mfi(int length, float source) =>
float upper = math.sum(volume * (ta.change(source) <= 0 ? 0 : source), length)
float lower = math.sum(volume * (ta.change(source) >= 0 ? 0 : source), length)
float mfi = 100.0
if lower != 0
float r = upper / lower
mfi := 100 - (100 / (1 + r))
mfi
Interpretation:
upper accumulates volume-weighted source values on up moves
lower accumulates volume-weighted source values on down moves
if lower is zero, MFI defaults to 100 to avoid division errors
otherwise, MFI is computed from the ratio transform
2) History Buffer Management
The current MFI value is pushed into the front of an array every bar. The array is trimmed to History Depth so rendering stays bounded.
array.unshift(ctx.history_val, mfi_curr)
if ctx.history_val.size() > depth
ctx.history_val.pop()
3) 3D Point Model and Ribbon Thickness
Each segment is built from four projected points to form a filled face (a simple quad). A small thickness is applied to create the “ribbon” look, and depth is used to simulate perspective.
4) Isometric Projection to Chart Coordinates
3D points are mapped into chart coordinates with an angle rotation and scaling for zoom and depth.
method project(Point3 p, int anchor_bar, float angle_rad, float zoom, float z_scale) =>
float x_world = -float(p.x) * 2.0
float z_val = p.z * z_scale
float screen_x_offset = (x_world * math.cos(angle_rad)) - (z_val * 1.0)
float screen_y_offset = (p.y * zoom) + (x_world * math.sin(angle_rad)) * 0.5
int final_x = anchor_bar + int(math.round(screen_x_offset))
float final_y = screen_y_offset
chart.point.from_index(final_x, final_y)
5) Gradient and Depth Transparency
Color is derived from MFI value via a gradient, and transparency increases with segment depth so recent data remains dominant while older context stays visible.
6) Projected Reference Grid Construction
The 80, 50, 20 levels are drawn as dotted segments across the same historical span, using the same projection and depth fade logic for consistent alignment.
🎆 Wishing you a great year ahead 🎄✨
May your charts be clear, your risk be controlled, and your next year be filled with health, peace, and good trades. Happy Holidays and Happy New Year.
FUN

Tic Tac Toe Game [TradeDots]Feeling bored with trading?
Time to inject some fun into your decision-making process with our Tic Tac Toe Indicator!
The Tic Tac Toe game transforms your chart into a competitive playground where trading pairs face off in a classic game of Tic Tac Toe.
HOW TO PLAY
Our Tic Tac Toe game invites you to pit one trading pair against another directly on your chart. Choose the competitors and watch as they battle it out in a traditional grid setup.
Navigate to settings and select your competitor pair.
Choose who kicks off the game.
After the close of each new bar, the algorithm will utilize the closing prices of both symbols. These numbers feed into a random number generator which alternates the turns for placing marks on the grid.
The game progresses until one pair aligns three consecutive symbols and wins, or the board fills up. After that, the game resets every three bars, offering continual engagement during active market hours.
MANUAL PLAYING MODE
Currently, due to PineScript's limitations, a fully interactive manual mode is not supported, as all previous data will be lost with each new user input, preventing the replication of existing game states.
However, users can input a sequence at the start, guiding the placement of symbols throughout the game.
Stay tuned for future updates!

Daily Chess Puzzles [LuxAlgo]Play Chess Puzzles right on your Chart!
Daily Chess Puzzles brings you a new 1-Move chess puzzle straight to your chart every day.
🔶 USAGE
Submit your answer to see if your solution is correct! For quick access to the settings, Double-Click on the Chess board to open the settings interface.
The current active color (Who's move it is) is represented by the color of the information bar, and the corner board squares.
This game uses long algebraic notation without pieces names for submitting moves.
This method for determining moves is perfect for simplicity and clarity, and is standard for the Universal Chess Interface (UCI).
🔹 How to Notate
Long algebraic notation (without pieces name) is simple to understand. This notation does not use capture symbols or check/checkmate symbols; it uses only the squares involved in the move and any promotion occurring.
{Starting Square}{Ending Square}{Promotion Piece(if needed)}
Locate the starting square and the ending square of the piece being moved, without mentioning the piece itself.
Identify the column letters (a-h) and row numbers (1-8) that align with your desired move.
If a pawn reaches the opposite end of the board the pawn gets promoted, add the letter representing the piece it is promoted to at the end of the move.
Put it all together and you've got your notation!
Piece Notations for Pawn Promotions:
'n' for Knight ('k' is reserved for the King in chess notation)
'b' for Bishop
'r' for Rook
'q' for Queen
Normal Move Example: Moving a piece from e2 to e4 is notated as "e2e4".
Pawn Promotion Example: Promoting a pawn to a queen is notated as "e7e8q".
🔶 DETAILS
Miss a day? Yesterday's puzzle can be re-played, check the box for 'View Yesterday's Puzzle' in the settings.
This indicator makes use of Tooltips! . Hover over a square to see that square's notation.
This script makes use of 5 libraries, each storing 2 years worth of daily chess puzzles amounting to 10 years of unique daily chess puzzles.
"timenow" is used to determine which day it is, so even on a closed ticker or weekend or holiday a new chess puzzle will be displayed.
Users have the option to choose from 5 different board themes.


Gamification IndicatorDo you want your charts to look like a video game? Look no further! Would you rather be an alien racing through a lava tube, a surfer with great white sharks, an airplane flying through the clouds, or some other custom emoji setup of your choice? Traders can choose their own custom player emoji, trend indicator, obstacle emoji, and celestial emoji. This indicator is just for fun and is not intended to be used when making trading decisions. Enjoy!
This indicator also contains a live sun/moon emoji that should accurately reflect day/night and can give information about the current moon phases.
Shoutout to @citlacom for the public Moon Ephemeris and calculations. Building this indicator was a useful & fun introduction to financial astrology in Pinescript.

Momentum Sparkler (MS)Introduction:
In this script, we will be creating an indicator called "Momentum Sparkler" that plots lines on the chart to visualize the momentum of the given source.
Explanation:
First, we define the input "Source" as the source for the data to be plotted, and the input "Length" as an integer determining the number of lines to plot.
We then create an array called "lines" to store the lines we will be plotting.
Using an if statement, we check if the current bar is the last bar in the chart. If it is, we use a for loop to iterate through the range of the "Length" input and add a line to the "lines" array for each iteration. The color of each line is determined by a color gradient, with the first line being the most red and the last line being the most green.
Next, we use another if statement to check if the current bar is confirmed. If it is, we use a for loop to iterate through the "lines" array and delete all the lines. This is to prevent the lines from being carried over to the next bar and potentially being plotted multiple times.
Conclusion:
This script can be useful for quickly visualizing the momentum of the given source and identifying potential trends or reversals. It can be helpful for making trading decisions or for adding an additional layer of analysis to a chart.

Color Palette OptionsA quick, easy way to swap out colour palettes. Simple cosmetic, but charts are allowed to be fun too!

X-Mas TreeLet's play a game!! Find your Christmas Tree and post it in the comments.
How to use the script?
Open any instrument which best describes the Christmas Tree (Preferably on hourly timeframe).
Apply X-Mas Tree script on the chart.
Enjoy the snowfall, changes in lightings and other animations. Animations only happen if the instrument is in trading session. So, stocks and indexes do not work on weekends and holidays. Use crypto as they are traded 24X7.
Unfortunately cannot post moving charts. But, snapshot of chart will do :)
Well, Please don't ask these questions for this script (Also thanks to @Bjorgum for contributing to this section) 😃
Can you please add alerts?
Does it repaint?
Can we use this for crypto/stock/forex bla bla?
Can you convert this to strategy?
How can I access this indicator?
Can you please give access or how much does it cost?
Can you make it available for MTF?
Indicator is broken. Getting so and so error message etc.
Wish you all MERRY X-MAS and HAPPY NEW YEAR!!

watermarkJust for fun... watermark graphics! The steps are:
1. Choose an image, probably no more than 20x20 pixels
2. Use an image library to convert each pixel into a table cell, as shown in the script.
I used they Python "pillow" library for step 2. This library allows you to iterate over each pixel, grab the RGB value, and generate table cells. You can use the width/height attributes of each cell to size the watermark.
Be careful, because Pinescript has a maximum character limit around 60,000 or so, and this script will reach that limit quickly. You also run into some limitation on table size, I think. That's why I suggest using no more than a 20x20 image.
Pictured in this chart is a legendary trader... message me if you would like to commission your own watermark.

watermark_asciiJust for fun... You can make an ascii watermark! The steps are:
1. Convert an image into ascii, e.g. using an online generator.
2. Split the ascii into strings that are no more than 4096 characters (pinescript limit).
3. Stack them together as cells on a table (as shown in the script).
I use code generation for step 2, by splitting the ascii file into chunks, then joining each line with a plus sign to make a large string concatenation statement, which I manually copy/paste into pine. Ideally, you could make this whole script into a template with a couple parameters.
Unfortunately, Pinescript doesn't use a monospaced font, so there will be some distortion. Feature request!

DEMO ASCII Encode/DecodeDemo
Encode a string to an ascii array and decode the ascii array to a string.
Reads ascii 32 to 126.
Takes a long time to execute. You may get the "Loop is too long (> 200 ms)" execution error.
You can change the loop to iterate fewer times thereby shorten the string length.
OR
you can limit the characters converted.
THIS IS AN ABSOLUTE KLUDGE.
Just showing how to do this.

Rate Pine ScriptWhat do you think of Pine Script?
Here's your chance to let off some steam if your frustrated with the limitations of Pine Script.
This script stores a text string in a array.
Unfortunately tradingview doesn't think anything useful can be done with strings.
This is merely a demo of storing a string in an array. There currently seems to be no way to get an input.string and parse it.
What do you think of Pine Script?
Here's your chance to let off some steam if your frustrated with the limitations of Pine Script.
RAINBARSJust take a hit of LSD and ride the trend. I was messing around with generating colors. I used a simple python script which helps with generating tradingview code blocks and loops.