Gann Octave Pro - Angles & Time Cycles 🎯 Gann Octave Pro - Angles & Time Cycles
## Complete Gann Trading System - Price, Angles & Time in One Indicator
A professional-grade Gann analysis tool combining **Octave Price Levels**, **Gann Angles (1x1, 2x1, 1x2)**, and **Advanced Time Cycle Projections**. Perfect for traders seeking precision market timing through geometric confluence.
---
## 🌟 Key Features
### 📐 Octave Price Levels
- **5 Key Levels**: 0%, 25%, 50%, 75%, 100%
- **Color-Coded**: Green (support) → Blue (50% pivot) → Red (resistance) → Black (boundaries)
- **Dynamic Updates**: Auto-adjusts to swing structure
- **Trading Edge**: 50% level is the most powerful reversal zone
### 📏 Gann Angles
- **1x1 Angle** (Black) - Natural 45° trend line
- **2x1 Angle** (Red) - Steep acceleration zone
- **1x2 Angle** (Red) - Gradual support/resistance
- **Customizable Extension**: Fixed bars or % of swing length
### ⏰ Advanced Time Cycles
**Three Calculation Methods:**
1. **Angle-Level Confluence** ⭐ (Recommended)
- Calculates intersections of Gann angles with octave levels
- Most sophisticated timing system
- Based on price-time geometry
2. **Swing Duration** - Uses actual swing bar length
3. **Harmonic (Swing/8)** - Classic Gann harmonic division
**Cycle Visualization:**
- **Full Cycles** (Purple, solid) - Major turning points, labeled "◆ FC1 (176 bars) "
- **Sub-Cycles** (Blue, dotted) - Minor pivots, labeled "S1 "
- **Mid-Cycles** (Orange, dashed) - Half-cycle inflection points
- **Past Display**: Shows 4 complete past cycles for validation
- **Future Projection**: Projects 8 future cycles for anticipation
---
## 🎯 How to Use
### Quick Start
1. Apply to chart (works all timeframes/instruments)
2. Select period: Default 44 bars (adjust based on timeframe)
3. Choose cycle method: "Angle-Level Confluence" for best results
4. Observe past cycles to validate timing accuracy
### Trading Strategies
**Triple Confluence Setup** (Highest Probability)
- Price at octave level (especially 50%)
- Price touches Gann angle (1x1 most reliable)
- Time cycle arrives (full cycle preferred)
- **Entry**: On confluence | **Stop**: Below/above octave level | **Target**: Next level
**Cycle Anticipation**
- Enter 1-2 bars before cycle line if price at octave level
- Exit at next cycle or target octave level
- **Edge**: Anticipate cycles instead of reacting
**Angle Breakout + Cycle**
- Price breaks 1x1 angle + next cycle within 20 bars
- Hold through cycle, exit at 2x1 angle or next major level
---
## ⚙️ Customization
### Period Selection (88-Based)
11 harmonic options: 3, 6, 11, 22, **44**, 88, 176, 352, 704, 1408, 2816 bars
- **Intraday** (15m-1h): Period 3-4
- **Swing Trading** (4h-Daily): Period 4-5
- **Position Trading** (Daily-Weekly): Period 5-6
### Visual Controls
- **Colors**: Independent for all elements
- **Line Widths**: Separate controls (1-5) for levels, angles, cycles
- **Label Size**: Tiny/Small/Normal/Large (unified)
- **Label Position**: Top/Middle/Bottom
- **Show/Hide**: Toggle any component
### Alerts
- 50% octave level breakouts
- Customizable messages
---
## 💡 Pro Tips
1. **Validate First**: Observe 2-3 past cycles before trading
2. **Adjust to Volatility**: High volatility = lower period (22-44), Low = higher (88-176)
3. **Multiple Timeframes**: Apply on different timeframes for confirmation
4. **Respect 50% Level**: Most powerful reversal zone in Gann theory
5. **Focus on Full Cycles**: Highest probability setups (◆ FC markers)
6. **Combine with Price Action**: Indicator shows WHERE/WHEN, price action shows HOW
---
## 🚀 What Makes It Unique
✅ **Intelligent Confluence Cycles** - Unique angle-level intersection calculation
✅ **Historical Validation** - See past cycles to trust future projections
✅ **Professional Design** - Color-coded hierarchy, clean labels, no clutter
✅ **Complete Automation** - Everything updates in real-time
✅ **Three-Dimensional Analysis** - Price + Angles + Time = complete picture
---
## 📊 Best Markets
- Stock indices (S&P 500, NASDAQ, Dow)
- Forex majors (EUR/USD, GBP/USD, USD/JPY)
- Commodities (Gold, Silver, Oil)
- Crypto (BTC, ETH)
- Liquid stocks
✅ Complete Gann system (price + angles + time)
✅ 3 time cycle methods
✅ Auto swing detection
✅ 4 past + 8 future cycle projections
✅ Professional visualization
✅ Extensive customization
✅ Real-time alerts
✅ Works all markets/timeframes
---
## ⚠️ Disclaimer
This indicator is for educational purposes and applies W.D. Gann methodology principles. Not financial advice. Always use proper risk management, position sizing, and stop losses. Practice on paper before live trading. Past performance doesn't guarantee future results.
---
**The market moves in patterns of price and time. This indicator helps you see them.**
Trade with geometry. Trade with time. Trade with confidence.
גאן

Gann Octave 8 Ver.2.0Gann Octave 8 Ver.2.0 - Complete Trading Guide
Overview
This indicator combines W.D. Gann's time-tested principles of market geometry with modern technical analysis. It identifies key market structures and projects precise support/resistance levels along with angular momentum lines to help traders identify high-probability trading opportunities.
________________________________________
Core Concepts
1. Gann's Octave Division (The Rule of 8)
W.D. Gann discovered that markets move in harmonic divisions based on the number 8. This indicator divides any swing movement into 8 equal parts (octaves):
• 0% - Swing extreme (High for bearish, Low for bullish)
• 12.5% - First octave
• 25% - Quarter level
• 37.5% - Three-eighths level
• 50% - Midpoint (most critical level)
• 62.5% - Five-eighths level
• 75% - Three-quarter level
• 87.5% - Seventh octave
• 100% - Swing extreme (opposite end)
Why 8? Gann believed natural market cycles follow mathematical harmonics. The octave division provides precise entry and exit points that frequently act as support/resistance zones.
2. Gann Angles (Price-Time Relationship)
Gann angles represent the relationship between price movement and time. Each angle shows different momentum levels:
• 1x1 (Black) - 45° angle, perfect balance between price and time. Most important Gann angle. Represents the natural trend line.
• 2x1 (Red) - Steeper angle, 2 units of price per 1 unit of time. Shows strong momentum.
• 1x2 (Red) - Flatter angle, 1 unit of price per 2 units of time. Shows weak momentum.
• 4x1 & 1x4 (Blue) - Even more extreme angles indicating very strong or very weak trends.
• 8x1 & 1x8 (Orange) - Most extreme angles, parabolic moves or complete consolidation.
Key Principle: When price is above the 1x1 angle = bullish. Below 1x1 = bearish. When price crosses from one angle to another, it signals a change in momentum.
________________________________________
How the Indicator Works
Structure Detection
The indicator automatically identifies market swings using pivot points:
1. Bullish Structure (Green): Detected when price makes a higher high
o Octave levels calculated from swing low (0%) to swing high (100%)
o Gann angles project upward from the swing low
2. Bearish Structure (Red): Detected when price makes a lower low
o Octave levels calculated from swing high (0%) to swing low (100%)
o Gann angles project downward from the swing high
Dynamic Updates
• Swing Tracker ON: Levels update continuously as the swing evolves
• Swing Tracker OFF: Levels lock at the initial swing detection (cleaner charts)
Historical Structures
The indicator maintains previous swing structures based on "Number of Swings to Show":
• Set to 1: Only current structure (cleanest)
• Set to 2-3: Current + recent history (recommended for context)
• Set to 4+: Multiple historical structures (may overlap but shows pattern)
________________________________________
Trading Strategy
Entry Signals
BUY SIGNALS (Green Triangle Up ▲)
Signal 1: Bounce from Support Levels
• Price drops to 0%, 50%, or 100% level and reverses
• Best when combined with bullish candlestick pattern (hammer, engulfing)
• Entry: On signal confirmation
• Stop Loss: Below the support level (0.5-1% below)
• Target: Next octave level up (12.5%, 25%, 50%)
Signal 2: Breakout Above Resistance
• Price breaks above 50% or 100% level with momentum
• Confirms trend continuation or reversal
• Entry: On close above the level
• Stop Loss: Below the breakout level
• Target: Previous swing high or next major level
Signal 3: Gann Angle Support
• Price bounces off 1x1 angle (black line)
• Indicates trend is intact
• Entry: When price respects the angle
• Stop Loss: Below the 1x1 angle
• Target: Next resistance level
SELL SIGNALS (Red Triangle Down ▼)
Signal 1: Rejection from Resistance Levels
• Price rallies to 0%, 50%, or 100% level and reverses
• Best when combined with bearish candlestick pattern (shooting star, bearish engulfing)
• Entry: On signal confirmation
• Stop Loss: Above the resistance level (0.5-1% above)
• Target: Next octave level down (87.5%, 75%, 50%)
Signal 2: Breakdown Below Support
• Price breaks below 50% or 0% level with momentum
• Confirms trend continuation or reversal
• Entry: On close below the level
• Stop Loss: Above the breakdown level
• Target: Previous swing low or next major level
Signal 3: Gann Angle Resistance
• Price fails at 1x1 angle (black line)
• Indicates trend weakness
• Entry: When price rejects the angle
• Stop Loss: Above the 1x1 angle
• Target: Next support level
________________________________________
Advanced Trading Techniques
1. The 50% Rule (Most Powerful)
The 50% octave level is the most critical in Gann theory:
• In Uptrend: Price should not break below 50% retracement. If it holds = trend intact, go long.
• In Downtrend: Price should not break above 50% retracement. If it holds = trend intact, go short.
• Reversal: Breaking and closing beyond 50% often signals trend reversal.
2. Gann Angle Confluence
When multiple Gann angles converge with octave levels = HIGH probability zone:
• Look for price to bounce or reverse at these zones
• Example: 1x2 angle meets 50% level = strong support/resistance
• These zones often become pivot points
3. Multiple Timeframe Analysis
• Use higher timeframe (daily) for major structure
• Use lower timeframe (5min, 15min) for precise entries
• Take trades when both timeframes align
4. Swing Failure Pattern
• Price breaks a key level (e.g., 50%) but quickly reverses back
• This "false breakout" often leads to strong move in opposite direction
• Wait for signal in the reversal direction
________________________________________
Settings Optimization
For Day Trading (Scalping)
• Structure Period: 0-2 (22 bars or less)
• Number of Swings: 1 (only current structure)
• Signal Sensitivity: High
• Swing Tracker: OFF (cleaner)
For Swing Trading
• Structure Period: 4-5 (44-88 bars)
• Number of Swings: 2-3
• Signal Sensitivity: Medium
• Swing Tracker: ON or OFF (preference)
For Position Trading
• Structure Period: 6-8 (176+ bars)
• Number of Swings: 3-5
• Signal Sensitivity: Low
• Swing Tracker: ON
________________________________________
Common Patterns to Watch
Bullish Reversal Setup
1. Price in bearish structure (red levels)
2. Price drops to 100% level (swing low)
3. Buy signal appears (green triangle)
4. Price breaks back above 50% level
5. Action: Go long with stop below 100%
Bearish Reversal Setup
1. Price in bullish structure (green levels)
2. Price rises to 100% level (swing high)
3. Sell signal appears (red triangle)
4. Price breaks back below 50% level
5. Action: Go short with stop above 100%
Trend Continuation
1. Price respects 1x1 Gann angle
2. Small pullback to 25% or 37.5% level
3. Buy/sell signal appears
4. Action: Enter in trend direction
________________________________________
________________________________________
Signal Sensitivity Guide
• Low: Conservative, only major breakouts (3-5 signals per day)
• Medium: Balanced, includes approaches (5-10 signals per day)
• High: Aggressive, includes bounces (10-20 signals per day)
Choose based on your trading style and risk tolerance
________________________________________
Final Words
This indicator is a powerful tool, but remember:
"The market is never wrong. Opinions are." - W.D. Gann
• No indicator is 100% accurate
• Always combine with price action and volume
• Backtest on your instrument and timeframe
• Keep learning and adapting your strategy
• Discipline and risk management are more important than the perfect setup
Happy Trading! 📈

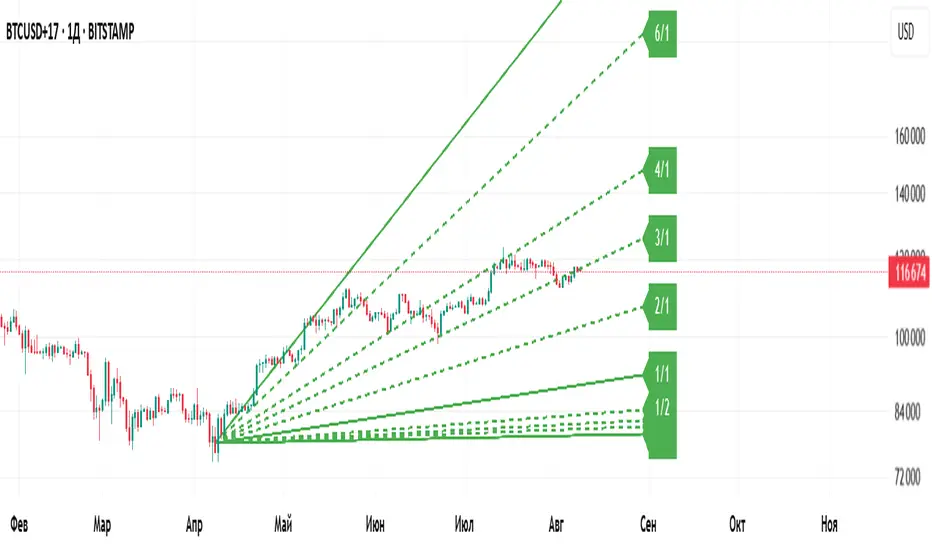
Gann ArchitectThe Gann Architect is a quantitative geometric engine designed to solve the primary limitation of standard Gann tools: Scaling.
Standard Gann Fans use fixed angles (e.g., 45 degrees for 1:1), which often fail when applied to volatile assets or different timeframes because they do not account for the specific price-to-time ratio of the asset. This indicator solves this by calculating a Dynamic Slope. It identifies the initial "Impulse Phase" (Anchor Low → First Major High) and mathematically "squares" the chart to fit that specific market structure.
Key Features
Dynamic Squaring: Automatically calculates the true 1:1 Master Line based on the asset's actual volatility, not an arbitrary angle.
Quantitative Alerts: Includes a built-in alert system. You can set alerts for "Crossed 1:1" (Trend Break), "Structural Fail 1:2" (Support Break), or "Impulse Breakout 2:1".
Real-Time Data Panel: A dashboard displays the exact price targets for the geometric levels, removing the need to eyeball the lines.
Efficiency: Uses a circular buffer memory system to ensure high performance ("100% potential") without slowing down your chart.
How to Use
This tool is designed as a Trend Following & Structure Map, not a reversal signal.
The 1:1 Line (Solid): This represents the "True Trend." In a strong bullish phase, price should respect this line as dynamic support. A confirmed close below this line often signals momentum loss.
The 1:2 Line (Bottom Support): This acts as the "Structural Floor." If price loses the 1:1 but holds the 1:2, it is considered a healthy correction. A break below the 1:2 typically invalidates the geometric structure of the current cycle.
The 2:1 Line (Top Resistance): This marks the "Impulse Zone." A break above this line suggests parabolic or over-extended behaviour.
Settings
Cycle Stiffness: Controls the sensitivity of the pivot detection. Increase this value (e.g., to 4 or 5) to filter out noise and focus on macro trends.
Anchor Pivot #: Allows you to select which historical cycle bottom to anchor the geometry to (1 = most recent confirmed bottom).
Slope Multiplier: Adjusts the aggressiveness of the fan. Default is 1.0 (Geometric Standard).
Technical Disclosure (Repainting & Lag)
This script utilises a Confirmed Pivot Detection system.
Signal Lag: To ensure reliability, the geometric fans anchor to confirmed pivots. A pivot is only confirmed after Right Length bars have passed. Therefore, the fans will appear on the chart with a slight delay relative to the absolute low.
Repainting: Once a pivot is confirmed and the fans are drawn, the lines for that specific cycle do not repaint history. However, if a new, lower low forms that invalidates the previous structure, the script will dynamically shift to the new anchor point to maintain geometric accuracy.
Disclaimer This script is for educational and experimental purposes only. Geometric analysis is a mapping tool, not a guarantee of future price action. Always use proper risk management. Past performance of geometric levels does not guarantee future results.

PyraTime Harmonic 369Concept and Methodology PyraTime Harmonic 369 is a quantitative time-projection tool designed to apply Modular Arithmetic to market analysis. Unlike linear time indicators, this tool projects non-linear integer sequences derived from Digital Root Summation (Base-9 Reduction).
The core logic utilizes the mathematical progression of the 3-6-9 constants. By anchoring to a user-defined "Origin Pivot," the script projects three distinct harmonic triads to identify potential Temporal Confluence—moments where mathematical time cycles align with price action.
Technical Features This script focuses on the Standard Scalar (1x) projection of the Digital Root sequence:
The Root-3 Triad (Red): Projects intervals of 174, 285, 396. (Mathematical Sum: 1+7+4=12→3)
The Root-6 Triad (Green): Projects intervals of 417, 528, 639. (Mathematical Sum: 4+1+7=12→3, inverted)
The Root-9 Triad (Blue): Projects intervals of 741, 852, 963. (Mathematical Sum: 7+4+1=12→3... completion to 9)
How to Use
Set Anchor: Input the time of a significant High or Low in the settings.
Select Resolution: This tool is optimized for 1-minute (Micro-Harmonics) and 15-minute (Intraday Harmonics) charts.
Analyze Clusters: The vertical lines represent calculated harmonic intervals. Traders look for "Clusters" where a Root-3 and Root-9 cycle land on adjacent bars, indicating a high-probability pivot.
System Architecture & Version Comparison This script represents the foundational layer of the PyraTime ecosystem.
This Script (PyraTime Harmonic 369):
Scalar: Standard 1x Multiplier only.
Focus: Intraday & Micro-structure (1m, 15m).
Engine: Core Digital Root Integers.
PyraTime Harmonic Matrix (Advanced Edition):
Scalar Engine: Unlocks Quad-Fractal (4x), Tri-Fractal (3x), and Bi-Fractal (2x) multipliers for institutional cycle analysis.
Apex Logic: Auto-detection of the "963" Completion Sequence (Gold Highlight).
Event Horizon: Includes a live Predictive Dashboard that calculates the time-delta to the next harmonic event across all scalar groups.
Disclaimer This tool is for the educational analysis of Number Theory in financial markets. It projects time intervals and does not predict price direction. Past performance does not guarantee future results.

PyraTime Intraday Cycles**Concept and Methodology**
PyraTime Intraday Cycles is a technical analysis tool designed to introduce the concept of **Temporal Cycle Projection**. While most indicators analyze price action (Y-axis), this tool focuses exclusively on the X-axis (Time).
By anchoring to a specific "Origin Pivot" (a user-defined High or Low), the script projects harmonic time intervals into the future. These vertical vectors serve as a grid, helping traders identify moments where time-based cycles may align with price structure.
**Technical Features**
This edition is optimized for **Multi-Timeframe Harmonic Flows**, utilizing a fixed algorithm for key intervals:
* **Anchor Point Logic:** The user manually selects a significant market pivot. The script calculates forward projections from this exact timestamp.
* **Standard Rhythms:** This version renders the **5-minute**, **15-minute**, **1-hour**, and **Daily** harmonic sequences. This allows for analysis across scalping, intraday, and swing trading structures.
* **Visual Confluence:** The indicator draws vertical lines to highlight potential zones of temporal exhaustion or acceleration.
**How to Use**
1. **Identify a Pivot:** Locate a significant High or Low on the chart.
2. **Set the Origin:** Open the settings and input the date/time of that pivot.
3. **Analyze Confluence:** Watch how price behaves when it approaches a vertical line. If price hits a key support/resistance level *at the same time* it hits a PyraTime vertical line, this is considered a high-probability "Time/Price" intersection.
**Version Comparison**
This script represents the foundational layer of the Great Pyramid system (PyraTime Apex).
* **PyraTime Intraday Cycles (This Script):** Focuses on Standard Timeframes (5m, 15m, 1h, Daily).
* **GPM Architecture (Advanced):** The full methodology extends these calculations to Esoteric Sequences (33, 144, 108), includes 3x Cycle Extensions, and features a Predictive Dashboard for complex multi-timeframe analysis.
**Disclaimer**
This tool is for educational and analytical purposes only. It identifies time cycles, not price direction. Past performance of a time cycle does not guarantee future results.

Gann Levels (Auto) by RRR📌 Gann Levels (Auto) — Intraday, Swing & Elliott Wave Precision Tool
Gann Levels (Auto) is a high-accuracy price-reaction indicator designed for intraday scalpers, swing traders, and Elliott Wave traders who want clean, auto-updating support and resistance levels without manually drawing anything.
The indicator automatically detects the latest swing high & swing low and plots the 8 Gann Octave Levels between them. These levels act as a complete price map—showing equilibrium, structure, trend continuation zones, and reversal points with extreme precision.
🔥 Why This Indicator Stands Out
✔ Fully automatic swing detection
Levels update as structure evolves — no manual adjustments.
✔ All Gann Octave levels
Plots 1/8 through 8/8 including the critical 4/8 midpoint.
✔ Intraday-optimized
Exceptional on 1m, 3m, 5m, and 15m charts.
✔ Ultra-clean support & resistance
Levels act as reliable barriers and breakout zones.
⭐ MOST IMPORTANT LEVELS FOR INTRADAY
4/8 – Midpoint (Major Decision Pivot)
Strongest Gann level.
Controls trend or reversal for the session.
Breakout → Trend Day
Rejection → Reversal Day
8/8 & 0/8 – Extreme Structure Edges
Most likely zones for intraday reversals.
Perfect for scalp entries when combined with volume exhaustion.
🎯 How to Trade ELLIOTT WAVE Using Gann Levels
This indicator is exceptionally powerful when combined with Elliott Wave Theory.
Here is how to use it wave-by-wave:
🔵 Wave 2 → Identify Bottom Using 0/8 or 1/8 Levels
Wave 2 typically retraces deep but remains above key structure.
Gann confirmation:
Price stops at 0/8 or 1/8 zone
Rejection wick + low volume breakdown attempt
Bullish intent starts forming
This gives a perfect Wave 3 entry zone.
🔴 Wave 3 → Breakout Above 4/8 Midpoint
Wave 3 is the strongest impulsive wave.
The 4/8 level works like a force-field.
Wave 3 confirmation:
Price breaks and retests 4/8
Strong volume
No deep pullbacks after break
This is one of the most reliable Elliott + Gann trades.
🟡 Wave 4 → Uses 3/8 or 5/8 as Support/Resistance
Wave 4 is corrective and shallow compared to Wave 2.
Gann alignment:
Wave 4 often consolidates between 3/8 and 5/8
Levels act like range boundaries
Avoid trading inside chop; wait for breakout
This gives perfect continuation entries for Wave 5.
🟣 Wave 5 → Ends Near 7/8 or 8/8 Extreme Zone
Wave 5 usually ends in overbought territory.
Gann confirmation:
Price hits 7/8 or 8/8
Momentum weakens
Divergence builds (RSI/MACD optional)
Last push = exhaustion
This is where reversals or major pullbacks begin.
💥 BONUS: Corrective Waves (A-B-C)
Wave A:
Often rejects from 4/8 or 5/8.
Wave B:
Typically trapped between 3/8–5/8.
Wave C:
Usually ends around 0/8 (for bullish trend)
or 8/8 (for bearish trend).
These zones give ultra-high confidence entries.
⚙️ Who This Indicator Is Perfect For
Elliott Wave traders
Intraday scalpers
Swing traders
Price action & structure traders
Traders who want automatic support-resistance levels
Traders who want clean, non-cluttered levels
⚠️ Disclaimer
This indicator is for educational purposes only.
Trading involves risk. Always use proper risk management.

Geometric Price-Time Triangle Calculator═══════════════════════════════════════════════════
GEOMETRIC PRICE-TIME TRIANGLE CALCULATOR
═══════════════════════════════════════════════════
Calculates Point C of a geometric triangle using different rotation angles from any selected price swing. Based on Bradley F. Cowan's Price-Time Vector (PTV) methods from "Four-Dimensional Stock Market Structures and Cycles."
📐 WHAT IT DOES
────────────────────────────────────────────────────
Select two points (A and B) on any swing, choose an angle, and the indicator calculates where Point C would be mathematically. It's just vector rotation applied to price charts.
This shows you where Point C lands in both price AND time based on pure geometry - not a prediction, just a calculation.
🎯 FEATURES
────────────────────────────────────────────────────
✓ 10 Different Angles
• Gann ratios: 18.435° (1x3), 26.565° (1x2), 45° (1x1), 63.435° (2x1), 71.565° (3x1)
• Other angles: 30°, 60°, 90°, 120°, 150°
✓ Visual Triangle
• Adjustable colors and opacity for points A, B, C
• Line styles: Solid, Dashed, Dotted
• Extend lines: None, Left, Right, Both
✓ Crosshair at Point C
• Shows where Point C is located
• Vertical line = bar position
• Horizontal line = price level
✓ Data Table
• Shows all calculations
• Price-to-Bar ratio
• Point C location (price and bars from A/B)
• Toggle on/off
🔧 HOW TO USE
────────────────────────────────────────────────────
1. Pick your swing start date (Point A)
2. Pick your swing end date (Point B) - make sure these dates capture the actual high/low of your swing
3. Choose an angle from the dropdown
4. Look at Point C - that's where the geometry puts it
Different angles = different Point C locations. Whether price actually goes there is up to the market.
📊 THE ANGLES
────────────────────────────────────────────────────
- 18.435° (1x3) - Shallow rotation
- 26.565° (1x2) - Moderate rotation
- 45° (1x1) - Gann's balanced ratio
- 60° - Equilateral triangle (default)
- 63.435° (2x1) - Steeper rotation
- 71.565° (3x1) - Very steep rotation
- 90° - Right angle
- 120°-150° - Obtuse angles
💡 PRACTICAL USE
────────────────────────────────────────────────────
→ See where geometric patterns would complete
→ Test if your market respects certain angles
→ Find where multiple angles converge
→ Compare projected Point C to actual price action
→ Use 90° to see symmetrical price/time relationships
→ Backtest historical swings to see what worked
⚙️ HOW IT WORKS
────────────────────────────────────────────────────
1. Takes your AB swing
2. Calculates the BA vector (reverse direction)
3. Normalizes price and time using Price-to-Bar ratio
4. Rotates the vector by your selected angle
5. Converts back to chart coordinates
Basic trigonometry. That's all it is.
📚 BACKGROUND
────────────────────────────────────────────────────
Based on Bradley F. Cowan's Price-Time Vector (PTV) concept from "Four-Dimensional Stock Market Structures and Cycles" and W.D. Gann's geometric angle analysis. Cowan observed that markets sometimes complete geometric patterns. This tool calculates where those patterns would complete mathematically. Whether price actually respects these geometric relationships is something you need to test yourself.
⚠️ IMPORTANT
────────────────────────────────────────────────────
- This is geometric calculation, not prediction
- Point C shows where the math puts it, not where price will go
- Some angles might work for your market, some won't
- Test it yourself on historical data
- Price-to-Bar Ratio stays constant regardless of angle
- Don't trade based on this alone
- Works on all timeframes and assets
🎨 CUSTOMIZATION
────────────────────────────────────────────────────
- Show/hide triangle
- Individual colors for A, B, C points
- Adjust opacity (0-100)
- Line styles for each triangle side
- Extend lines left/right/both/none
- Show/hide data table
- Crosshair color and width
- Customizable table colors
═══════════════════════════════════════════════════

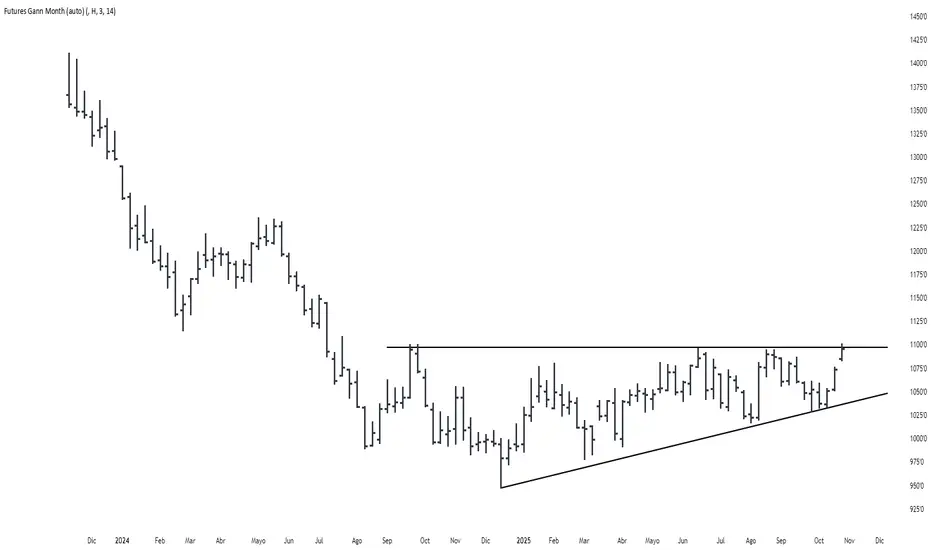
Futures Gann MonthBuilds a a continuous chart of the same month for a futures contract (e.g. ZSH2026).
This means such a chart consists of March '22, March '23, March '24, March '25, March '26...
The script goes back 20 years at most (depending on the current ticker selected in TradingView).
DCA Percent SignalOverview
The DCA Percent Signal Indicator generates buy and sell signals based on percentage drops from all-time highs and percentage gains from lowest lows since ATH. This indicator is designed for pyramiding strategies where each signal represents a configurable percentage of equity allocation.
Definitions
DCA (Dollar-Cost Averaging): An investment strategy where you invest a fixed amount at regular intervals, regardless of price fluctuations. This indicator generates signals for a DCA-style pyramiding approach.
Gann Bar Types: Classification system for price bars based on their relationship to the previous bar:
Up Bar: High > previous high AND low ≥ previous low
Down Bar: High ≤ previous high AND low < previous low
Inside Bar: High ≤ previous high AND low ≥ previous low
Outside Bar: High > previous high AND low < previous low
ATH (All-Time High): The highest price level reached during the entire chart period
ATL (All-Time Low): The lowest price level reached since the most recent ATH
Pyramiding: A trading strategy that adds to positions on favorable price movements
Look-Ahead Bias: Using future information that wouldn't be available in real-time trading
Default Properties
Signal Thresholds:
Buy Threshold: 10% (triggers every 10% drop from ATH)
Sell Threshold: 30% (triggers every 30% gain from lowest low since ATH)
Price Sources:
ATH Tracking: High (ATH detection)
ATL Tracking: Low (low detection)
Buy Signal Source: Low (buy signals)
Sell Signal Source: High (sell signals)
Filter Options:
Apply Gann Filter: False (disabled by default)
Buy Sets ATL: False (disabled by default)
Display Options:
Show Buy/Sell Signals: True
Show Reference Lines: True
Show Info Table: False
Show Bar Type: False
How It Works
Buy Signals: Trigger every 10% drop from the all-time highest price reached
Sell Signals: Trigger every 30% increase from the lowest low since the most recent all-time high
Smart Tracking: Uses configurable price sources for signal generation
Key Features
Configurable Thresholds: Adjustable buy/sell percentage thresholds (default: 10%/30%)
Separate Price Sources: Independent sources for ATH tracking, ATL tracking, and signal triggers
Configurable Signals: Uses low for buy signals and high for sell signals by default
Optional Gann Filter: Apply Gann bar analysis for additional signal filtering
Optional Buy Sets ATL: Option to set ATL reference point when buy signals occur
Visual Debug: Detailed labels showing signal parameters and values
Usage Instructions
Apply to Chart: Use on any timeframe (recommended: 1D or higher for better signal quality)
Risk Management: Adjust thresholds based on your risk tolerance and market volatility
Signal Analysis: Monitor debug labels for detailed signal information and validation
Signal Logic
Buy signals are blocked when ATH increases to prevent buying at peaks
Sell signals are blocked when ATL decreases to prevent selling at lows
This ensures signals only trigger on subsequent bars, not the same bar that establishes new reference points
Buy Signals:
Calculate drop percentage from ATH to buy signal source
Trigger when drop reaches threshold increments (10%, 20%, 30%, etc.)
Always blocked on ATH bars to prevent buying at peaks
Optional: Also blocked on up/outside bars when Gann filter enabled
Sell Signals:
Calculate gain percentage from lowest low to sell signal source
Trigger when gain reaches threshold increments (30%, 60%, 90%, etc.)
Always blocked when ATL decreases to prevent selling at lows
Optional: Also blocked on down bars when Gann filter enabled
Limitations
Designed for trending markets; may generate many signals in sideways/ranging markets
Requires sufficient price movement to be effective
Not suitable for scalping or very short timeframes
Implementation Notes
Signals use optimistic price sources (low for buys, high for sells), these can be configured to be more conservative
Gann filter provides additional signal filtering based on bar types
Debug information available in data window for real-time analysis
Detailed labels on each signal show ATH, lowest low, buy level, sell level, and drop/gain percentages


Gann Trading Strategy📈 Simple & Powerful Gann-Based Trading System
This indicator automatically calculates key Gann support and resistance levels based on W.D. Gann's mathematical principles. Simply input either the highest price (for bearish setups) or lowest price (for bullish setups), and the indicator automatically generates all trading levels.
🎯 Key Features:
Automatic Level Calculation - Just select High/Low price projection basis
Complete Trading Framework - Entry zone, 3 Take Profit levels, and Exit level
Visual Trading Zones - Color-coded zones around each level for better entry/exit timing
Smart Alerts - Get notified when price reaches key levels
Bullish & Bearish Setups - Works for both long and short trading strategies
Customizable Display - Show/hide levels, adjust colors, line styles, and zone widths
🚀 How to Use:
Select "Lowest Price" for bullish setup or "Highest Price" for bearish setup
Input the relevant high or low price from your analysis
The indicator automatically calculates and displays all trading levels
Use the green entry zone for entries, blue levels for take profits, red level for exits
📊 Perfect for:
Swing trading
Position sizing and risk management
Support/resistance analysis
Multi-timeframe analysis
Uses time-tested Gann principles to automatically find key price levels for trading.

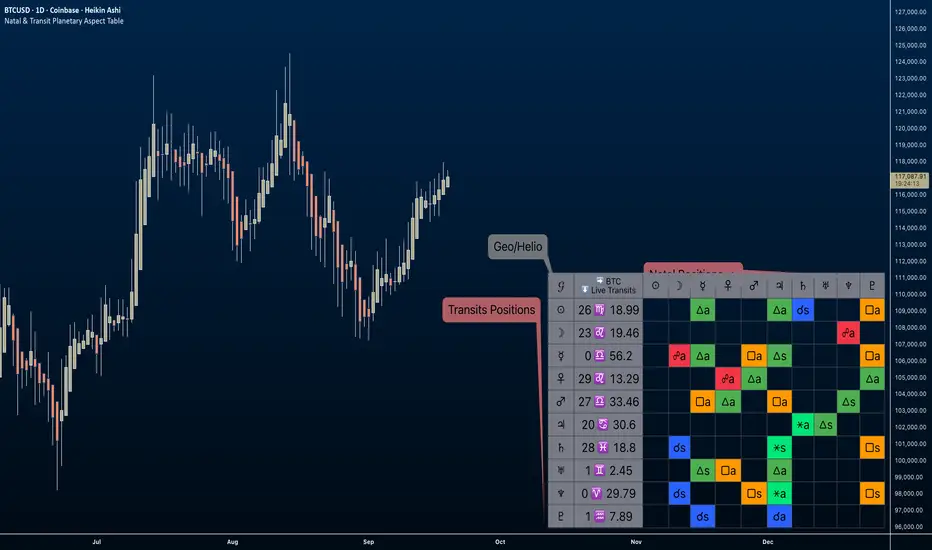
Natal & Transit Planetary Aspect Table📐 Natal & Transit Planetary Aspect Table
This open-source TradingView indicator displays a customizable table of astrological aspects between natal (first trade or custom date) planetary positions and current/live transits. Built in Pine Script v6, it leverages the AstroLib library for accurate geocentric or heliocentric longitude calculations, supporting a range of financial assets and historical events. Ideal for astro-finance enthusiasts, it highlights major and minor aspects with orbs, applying/separating status, and color-coded visuals. Supports 10 planetary bodies in geocentric mode (Sun, Moon, Mercury, Venus, Mars, Jupiter, Saturn, Uranus, Neptune, Pluto) or 11 in heliocentric mode (adds Earth).
Why Use This Indicator?
Astrology offers a unique lens for market analysis by examining planetary alignments relative to an asset's "birth" date (e.g., first trade), potentially revealing cycles, trends, and timing insights that complement technical and fundamental strategies. This tool empowers traders to integrate astro-finance principles, visualizing cosmic influences that may correlate with price movements, reversals, or volatility—backed by historical presets and customizable options for personalized research.
Key Features:
- 23 preset natal dates for assets like BTC, ETH, NYSE, and more (e.g., BTC genesis block on 2009-01-03), with credits to Susan Abbott Gidel for most of the first trade dates from her book " Trading In Sync With Commodities: Introducing Astrology To Your Technical Toolbox ."
- Manual natal and transit timestamp inputs for flexibility.
- Supports geocentric (default) or heliocentric views (displayed as 𝒢 or ℋ in the table), with adjustable observer location (latitude, longitude, timezone).
- Configurable aspects: Conjunction (☌), Opposition (☍), Trine (△), Square (□), Sextile (⚹), and minors like Semi-Sextile (⚺), Quincunx (⚻), etc., with user-defined orbs and colors.
- Applying (a) or separating (s) status is determined by comparing the orb on the current bar to the previous one—if decreasing, applying; if increasing, separating. This simplified approach may differ from traditional astrological methods that consider planetary speeds, directions (direct/retrograde), and which body is faster/slower.
- Table displays planet symbols or names, degrees/signs with tooltips showing exact longitude (e.g., hovering over a planet symbol reveals its precise degree), and aspect symbols/tags (e.g., ⚹a for applying sextile).
- Tooltip on the dates cell to view the exact transit and natal dates for easy tracking.
- Live mode updates with chart timeframe; test mode allows the user to move the transit date historically or to the future via a custom timestamp.
- Customizable table position, text size, colors, and visibility.
How to Use:
1. Add the indicator to your TradingView chart.
2. Select a preset or manual natal date in settings.
3. Choose live transits or test mode with a custom timestamp.
4. Enable/disable aspects and adjust orbs/colors as needed.
5. Hover over cells for detailed tooltips (e.g., exact orb and applying/separating status).
Powered by @BarefootJoey AstroLib for ephemeris data. For best accuracy, verify positions against external sources.
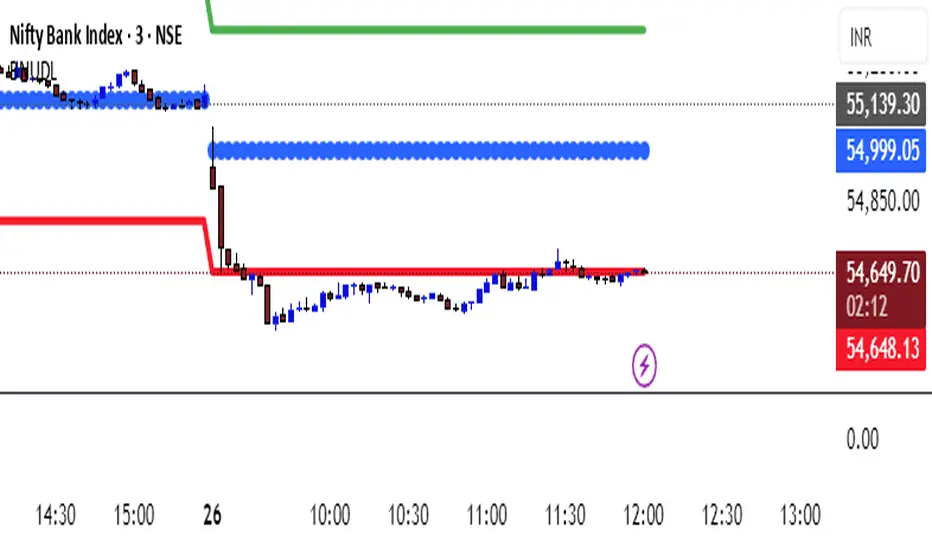
KATIK BankNifty Upside/Downside LevelsThe KATIK BankNifty Upside/Downside Levels (BNUDL) indicator plots key daily reference levels for BankNifty based on its opening price. Using a predefined daily move percentage, it calculates potential upside and downside levels from the open. The script displays:
Up Level (Green): Potential bullish threshold above the open
Down Level (Red): Potential bearish threshold below the open
Open Price (Blue Circles): Daily BankNifty opening level
This tool helps traders quickly identify intraday directional bias and potential support/resistance zones around the opening price.
Mikula's Master 360° Square of 12Mikula’s Master 360° Square of 12
An educational W. D. Gann study indicator for price and time. Anchor a compact Square of 12 table to a start point you choose. Begin from a bar’s High or Low (or set a manual start price). From that anchor you can progress or regress the table to study how price steps through cycles in either direction.
What you’re looking at :
Zodiac rail (far left): the twelve signs.
Degree rail: 24 rows in 15° steps from 15° up to 360°/0°.
Transit rail and Natal rail: track one planet per rail. Each planet is placed at its current row (℞ shown when retrograde). As longitude advances, the planet climbs bottom → top, then wraps to the bottom at the next sign; during retrograde it steps downward.
Hover a planet’s cell to see a tooltip with its exact longitude and sign (e.g., 152.4° ♌︎). The linked price cell in the grid moves with the planet’s row so you can follow a planet’s path through the zodiac as a path through price.
Price grid (right): the 12×24 Square of 12. Each column is a cycle; cells are stepped price levels from your start price using your increment.
Bottom rail: shows the current square number and labels the twelve columns in that square.
How the square is read
The square always begins at the bottom left. Read each column bottom → top. At the top, return to the bottom of the next column and read up again. One square contains twelve cycles. Because the anchor can be a High or a Low, you can progress the table upward from the anchor or regress it downward while keeping the same bottom-to-top reading order.
Iterate Square (shifting)
Iterate Square shifts the entire 12×24 grid to the next set of twelve cycles.
Square 1 shows cycles 1–12; Square 2 shows 13–24; Square 3 shows 25–36, etc.
Visibility rules
Pivot cells are table-bound. If you shift the square beyond those prices, their highlights won’t appear in the table.
A/B levels and Transit/Natal planetary lines are chart overlays and can remain visible on the table as you shift the square.
Quick use
Choose an anchor (date/time + High/Low) or enable a manual start price .
Set the increment. If you anchored with a Low and want the table to step downward from there, use a negative value.
Optional: pick Transit and Natal planets (one per rail), toggle their plots, and hover their cells for longitude/sign.
Optional: turn on A/B levels to display repeating bands from the start price.
Optional: enable swing pivots to tint matching cells after the anchor.
Use Iterate Square to shift to later squares of twelve cycles.
Examples
These are exploratory examples to spark ideas:
Overview layout (zodiac & degree rails, Transit/Natal rails, price grid)
A-levels plotted, pivots tinted on the table, real-time price highlighted
Drawing angles from the anchor using price & time read from the table
Using a TradingView Gann box along the A-levels to study reactions
Attribution & originality
This script is an original implementation (no external code copied). Conceptual credit to Patrick Mikula, whose discussion of the Master 360° Square of 12 inspired this study’s presentation.
Further reading (neutral pointers)
Patrick Mikula, Gann’s Scientific Methods Unveiled, Vol. 2, “W. D. Gann’s Use of the Circle Chart.”
W. D. Gann’s Original Commodity Course (as provided by WDGAN.com).
No affiliation implied.
License CC BY-NC-SA 4.0 (non-commercial; please attribute @Javonnii and link the original).
Dependency AstroLib by @BarefootJoey
Disclaimer Educational use only; not financial advice.

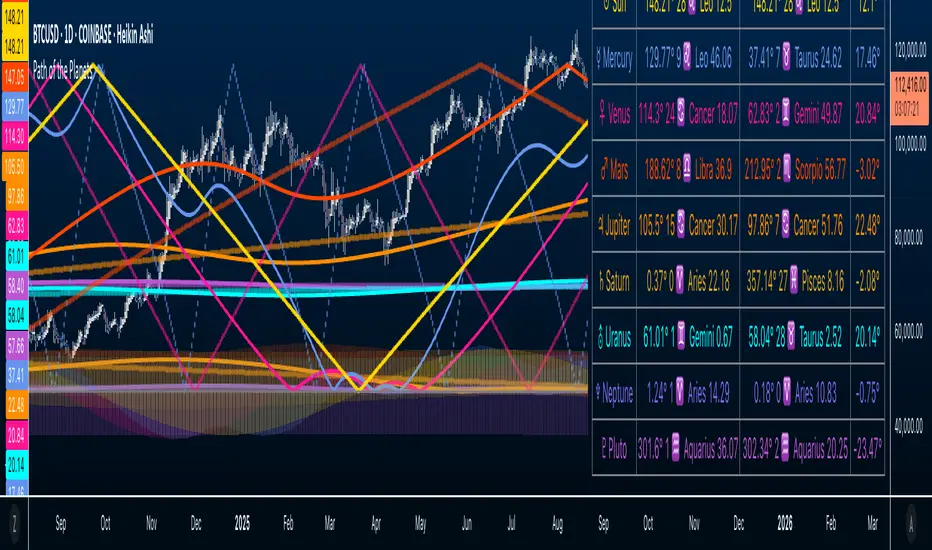
Path of the Planets🪐 Path of the Planets
Path of the Planets is an open-source Pine Script™ v6 indicator. It is inspired by W.D. Gann’s Path of Planets chart, specifically the Chart 5-9 artistic replica by Patrick Mikula "shown below". The script visualizes planetary positions so you can explore possible correlations with price. It overlays geocentric and heliocentric longitudes and declinations using the AstroLib library and includes an optional positions table that shows, at a glance, each body’s geocentric longitude, heliocentric longitude, and declination. This is an educational tool only and not trading advice.
Key Features
Start point: Choose a date and time to begin plotting so studies can align with market events.
Adjustments: Mirror longitudes and shift by 360° multiples to re-frame cycles.
Planets: Toggle geocentric and heliocentric longitudes and declinations for Sun, Mercury, Venus, Earth, Mars, Jupiter, Saturn, Uranus, Neptune, and Pluto. Moon declination is available.
Positions table: Optional color-coded table (bottom-right) with three columns labeled Geo, Helio, and Dec. Values show degrees with the zodiac sign for the longitudes and degrees for declinations.
Visualization: Solid lines for geocentric longitudes, circles for heliocentric longitudes, and columns for declinations. Includes a zero-declination reference line.
How It Works
Converts bar timestamps to Julian days via AstroLib.
Fetches positions with AstroLib types: geocentric (0), heliocentric (1), and declination (3).
Normalizes longitudes to the −180° to +180° range, applies optional mirroring and 360° shifts, and converts longitudes to zodiac sign labels for the table.
Plots and the table update only on and after the selected start time.
Usage Tips
Apply on daily or higher timeframes when studying broader cycles. For degrees, use the left scale.
Limitations at the moment: default latitude, longitude, and timezone are set to 0; aspects and retrogrades are not included; the focus is on raw paths.
License and Credits
Dependency: @BarefootJoey Astrolib
Contributions and observations are welcome.
Concentric Geometry – Invariant MetricsConcentric Geometry – Invariant Metrics
This indicator demonstrates the invariant concept of a concentric circle around a selected price range. By anchoring two points (A & B), it calculates a set of ratios and slopes that remain consistent under concentric scaling of price and time. These invariants include the raw slope (ΔP/N), concentric slope, π-adjusted ratios, and √2 offsets — all of which can be used to explore deeper geometric relationships in the market.
What has been demonstrated here is not an “out-of-the-box” trading system. Instead, the outputs provide the raw invariant metrics from which the trader must derive their own ratios and extensions. For example, price-to-bar ratio inputs are not fixed — they need to be derived from the invariants themselves, and experimenting with them is the key to uncovering harmonic alignments and scaling behaviors.
Key features include:
• Range & Bars Analysis – Price range (ΔP) and bar count (N) between anchors.
• Core Invariants – Midpoint, radius (price and bar units), upper/lower bounds.
• Linear Slope Metrics – ΔP/N and √2 concentric slope.
• π-Adjusted Price/Bar – Harmonic arc-length ratio.
• Circumference & Offsets – Circle circumference, √2 and 1/√2 offsets in price and bar units.
This tool is best suited for traders studying market geometry, W.D. Gann principles, harmonic ratios, or the geometric methods of Michael Jenkins. It does not generate buy/sell signals — instead, it equips the trader with building blocks for geometric exploration.
Key point: The trader must experiment with the ratios derived from these metrics. Playing with different price-to-bar relationships unlocks the true potential of concentric market geometry, whether applied to dynamic anchored VWAPs, concentric overlays, or Vesica Piscis structures.
Use it to:
• Compare slopes across swings
• Derive new ratios from invariant metrics
• Anchor dynamic anchored VWAPs to concentric nodes
• Explore concentric or Vesica Piscis overlays
• Support advanced geometric trading strategies

Gann Fan Master – Selectable Base Angle & Fibonacci AnglesGann Fan Master – Selectable Base Angle & Fibonacci Angles
This indicator plots a Gann Fan from point A1 through point B1, with full customization over:
Base angle selection (8/1, 1/1, 1/8)
Main angle set
Fibonacci-based angles
Up to 10 custom user-defined angles
Logarithmic or linear slope calculation
Custom fan color and extended line length
Perfect for manual chart analysis — you select A1 and B1, the script calculates and draws the fan with labeled angles.
How It Works
-Select A1 (time & price) and B1 (time & price).
-The script calculates the base slope depending on the selected base angle:
Linear scale: slope = (B1 − A1) / Δt / base_angle_value
Logarithmic scale: slope = (ln(B1) − ln(A1)) / Δt / base_angle_value
-Each enabled angle is drawn from A1, extended by the chosen number of bars, and labeled with its value.
-Fan color is determined automatically by direction (green for upward, red for downward) or can be overridden.
Quick Start
-Add the indicator to your chart.
-In settings:
A1 Time/Price — starting point.
B1 Time/Price — second point (defines slope).
Base Angle — choose 8/1, 1/1, or 1/8.
Extend Fan (Bars) — number of bars to extend lines into the future.
Logarithmic Fan Calculation — toggle for log-scale mode.
Enable desired angle sets: Main, Fibonacci, or Custom.
-Optionally, enable Use Custom Fan Color and set your own color.
Settings
Enable Fan — master switch.
A1 Time/A1 Price, B1 Time/B1 Price — anchor points.
Base Angle — 8/1, 1/1, 1/8.
Extend Fan (Bars) — extension length.
Use Custom Fan Color / Fan Color — manual color override.
Main Angles — 1/8, 1/4, 1/3, 1/2, 1/1, 2/1, 3/1, 4/1, 6/1, 8/1.
Fibonacci Angles — 0.214, 0.35, 0.382, 0.618, 0.786, 0.886, 0.9335, 1.118, 1.236, 1.382, 1.618.
Custom Angles — up to 10 values (dotted lines), labels from the exact value.
Usage Tips
-Choosing A1 and B1:
A1 — significant starting swing high or low.
B1 — next key swing to define slope.
-Logarithmic scale:
Ideal for long-term exponential trends (crypto, growth stocks).
Prices must be > 0.
-Watch how price reacts to different angles:
1/1 as median trend, fractional for support/resistance, multiples for acceleration/slowdown.
Disclaimer
This is a technical analysis tool. It is not financial advice. Trading decisions are made at your own risk.
Gann Fan Master – Selectable Base Angle & Fibonacci Angles
Индикатор строит веер Ганна от точки A1 через точку B1 с полной кастомизацией:
Выбор базового угла (8/1, 1/1, 1/8)
Набор основных углов
Углы Фибоначчи
До 10 пользовательских углов
Расчёт в логарифмической или линейной шкале
Цвет веера по направлению или заданный вручную
Настройка длины продления линий
Идеально подходит для ручного анализа графика — вы задаёте A1 и B1, а скрипт рассчитывает и строит веер с подписями углов.
Как это работает
-Задайте A1 (время и цена) и B1 (время и цена).
-Скрипт рассчитывает базовый наклон в зависимости от выбранного базового угла:
Линейная шкала: наклон = (B1 − A1) / Δt / base_angle_value
Логарифмическая шкала: наклон = (ln(B1) − ln(A1)) / Δt / base_angle_value
-Каждый включённый угол рисуется из точки A1, продлевается на заданное число баров и подписывается.
-Цвет линий определяется автоматически по направлению (зелёный — вверх, красный — вниз) или задаётся вручную.
Быстрый старт
1)Добавьте индикатор на график.
2)В настройках:
A1 Time/Price — начальная точка.
B1 Time/Price — вторая точка (задаёт наклон).
Base Angle — выберите 8/1, 1/1 или 1/8.
Extend Fan (Bars) — длина продления линий в барах.
Logarithmic Fan Calculation — переключатель логарифмического режима.
Включите нужные блоки углов: Main, Fibonacci, Custom.
3)При желании активируйте Use Custom Fan Color и задайте цвет веера.
Настройки
Enable Fan — общий выключатель.
A1 Time/A1 Price, B1 Time/B1 Price — опорные точки.
Base Angle — 8/1, 1/1, 1/8.
Extend Fan (Bars) — продление линий.
Use Custom Fan Color / Fan Color — цвет вручную.
Main Angles — 1/8, 1/4, 1/3, 1/2, 1/1, 2/1, 3/1, 4/1, 6/1, 8/1.
Fibonacci Angles — 0.214, 0.35, 0.382, 0.618, 0.786, 0.886, 0.9335, 1.118, 1.236, 1.382, 1.618.
Custom Angles — до 10 значений (точечные линии) с подписями.
Советы по применению
Выбор A1 и B1:
A1 — значимый экстремум начала движения.
B1 — следующий важный экстремум для задания наклона.
Логарифмическая шкала:
Подходит для долгосрочных экспоненциальных трендов (крипто, акции роста).
Цена должна быть > 0.
Следите, как цена реагирует на разные углы:
1/1 — медианный тренд.
Дробные углы — потенциальная поддержка/сопротивление.
Кратные — ускорение/замедление движения.
Дисклеймер
Это инструмент технического анализа и не является инвестиционной рекомендацией. Торговые решения вы принимаете на свой страх и риск.
Gann Single Square Swing Trading System with Gann AnglesGann Single Square Swing Trading System
This script automatically detects "squares" - geometric patterns where price movement equals time movement. When price moves the same distance as the number of bars (time), it creates powerful support/resistance levels based on Gann theory.
Key Visual Elements
• Box: The detected square pattern
• Dark Blue Line (50%): Most important trading level
• Green Lines: Profit target levels (125%, 150%)
• Red Lines: Stop loss levels (-25%, -50%)
• Colored Angle Lines: Gann angles for trend direction
• Quality Score: Blue label showing setup strength (aim for 70%+)
Simple Trading Rules
LONG Trades (Green 🟢 Square)
1. Entry: Buy when price touches the dark blue 50% line from above
2. Stop Loss: Place below the red -25% line
3. Take Profit: Exit at green 125% line (first target) or 150% line (second target)
SHORT Trades (Red 🔴 Square)
1. Entry: Sell when price touches the dark blue 50% line from below
2. Stop Loss: Place above the red -25% line
3. Take Profit: Exit at green 125% line (first target) or 150% line (second target)
Entry Checklist
✅ Square quality score > 70%
✅ Price touches 50% level (dark blue line)
✅ Volume above average (if volume filter enabled)
✅ Clear square formation visible
Alerts
The script generates automatic alerts when price reaches the 50% trading level. Enable alerts in TradingView to get notified of setups.
Bottom Line: Wait for the alert → Check quality score → Enter at 50% level → Set stop at red line → Take profit at green line.

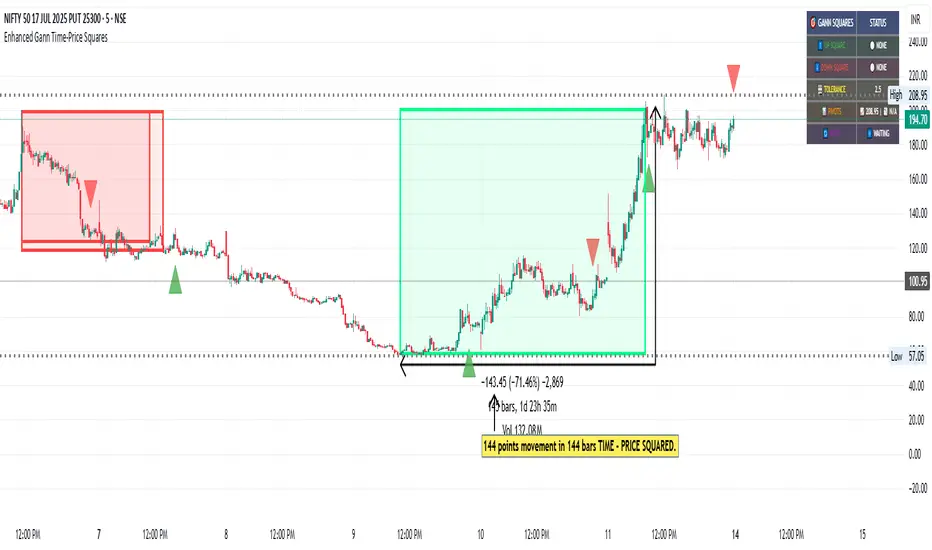
Angled Gann Time-Price Squares with S/RThis is a Pine Script indicator that implements Angled Gann Time-Price Squares based on W.D. Gann's trading theory. Here's what it does:
Core Functionality
Detects pivot highs and lows using a configurable lookback period
Creates angled squares by connecting pivot points to current price action when specific geometric conditions are met
Validates square formation by checking if the price movement follows proper Gann angles (typically 45°, 135°, etc.) within a tolerance range
Key Features
Real-time square tracking: Shows both completed squares and forming squares in progress
Support/Resistance levels: Automatically generates S/R lines from:
Square edge extensions
Diagonal extensions (pivot centers)
Quarter/half levels within squares (25%, 50%, 75%)
Visual feedback: Color-coded squares (green for up, red for down, orange for forming)
Projection lines: Predicts where squares might complete based on Gann angle theory
Gann Theory Application
The indicator follows Gann's principle that time and price move in geometric harmony. It looks for price movements that form perfect squares when plotted on a chart, where the diagonal of the square represents the natural flow of price and time at specific angles.
The generated support/resistance levels are particularly valuable because they're based on completed geometric patterns rather than just horizontal price levels, making them potentially more significant according to Gann methodology.

Gann Octave 8 - Professional V 1.0Gann Octave 8 Indicator:
Core Concept: This indicator divides the price range between highest high and lowest low into 8 equal parts (octaves), creating support/resistance levels based on W.D. Gann's trading principles.
Key Components:
1. Price Range Calculation:
o Finds highest high and lowest low over a lookback period (default 50 bars)
o Divides this range into 8 equal segments (12.5% each)
2. 8 Octave Levels:
o 0% (Low Support) - Strongest support
o 12.5%, 25%, 37.5% - Minor levels
o 50% (CRITICAL) - Most important level
o 62.5%, 75%, 87.5% - Minor levels
o 100% (High Resistance) - Strongest resistance
3. Gann Angles: Projects trend lines from high/low points at various angles (1x1, 2x1, 1x2, etc.)
4. Visual Features:
o Color-coded levels
o Information table showing current position
o Background highlighting when near critical levels
o Trend analysis (bullish/bearish zones)
Trading Strategy
Entry Signals:
BULLISH TRADES:
• Price crosses above 50% level → Strong buy signal
• Price bounces from 25% or 37.5% levels → Support bounce
• Price in upper zone (above 50%) → Bullish bias
BEARISH TRADES:
• Price crosses below 50% level → Strong sell signal
• Price rejects at 75% or 87.5% levels → Resistance rejection
• Price in lower zone (below 50%) → Bearish bias
Key Trading Rules:
1. 50% Level is Critical: Most important for trend direction
2. Zone Trading:
o Above 50% = Bullish zone (look for longs)
o Below 50% = Bearish zone (look for shorts)
3. Strength Levels:
o Above 75% or below 25% = Strong moves
o Near 100% (high) or 0% (low) = Extreme levels
Risk Management:
• Stop Loss: Place below previous octave level
• Take Profit: Target next octave level
• Position Size: Reduce size near extreme levels (0%, 100%)
Example Trade:
If price breaks above 50% level:
• Entry: Long position
• Stop: Below 37.5% level
• Target: 75% level
• Risk: Monitor for rejection at resistance levels
The indicator works best in trending markets and helps identify high-probability reversal zones.
Works for both Stocks & Derivatives. Experiment with code and share your feedback in comments..

Enhanced Gann Time-Price SquaresEnhanced Gann Time-Price Squares Indicator
A comprehensive Pine Script indicator that identifies and visualizes W.D. Gann's time-price square formations on your charts. This tool helps traders spot potential market turning points where time and price movements align according to Gann's legendary market theories.
Key Features:
Automatic Square Detection - Identifies completed squares where price movement equals time movement
Future Projections - Shows forming squares with projected completion points
Pivot Integration - Automatically detects pivot highs/lows as square starting points
Visual Clarity - Clean box outlines with customizable colors and styles
Smart Filtering - Prevents overlapping squares and includes minimum move thresholds
Real-time Status - Information table showing current square formations
How to Use:
The indicator draws boxes when price moves from pivot points equal the time elapsed (number of bars). Green squares indicate upward movements, red squares show downward movements. Dashed lines show forming squares, while dotted lines project where they might complete.
Settings:
Adjust pivot sensitivity and minimum price moves
Customize tolerance for time-price matching
Toggle projections, labels, and visual elements
Fine-tune colors and line styles
Perfect for Gann theory practitioners and traders looking for time-based market analysis. The squares often coincide with significant support/resistance levels and potential reversal points.
Compatible with all timeframes and instruments.
More updates to follow
Gann Swing PointsIndicator Logic
This is a GANN-style swing indicator that classifies bars based on their high/low structure relative to the previous bar.
I strongly encourage you to replay bars on Tradingview using this indicator to get a sense of how it creates pivot (or swing) points
Bar Classification:
Up-Bar (direction: 'up'): Higher High and Higher Low (HH/HL)
Down-Bar (direction: 'down'): Lower High and Lower Low (LH/LL)
Outside-Bar (generates 2 directions):
Green: 'down' then 'up'
Red: 'up' then 'down'
Inside-Bar: No direction generated (HL/LH)
Swing Line Logic
The swing line continues in the current direction until n opposite directions are detected.
n is the "n-direction" parameter (commonly set to 2, so 2 consecutive opposite direction is needed to turn the swing)
When n opposing directions occur, the swing turns, creating a pivot point
Inside bar is ignored, so e.g up-bar -> inside-bar -> up-bar generates "up", "up" direction
A top pivot is formed when the swing turns down
A bottom pivot is formed when it turns up
Note: This swing logic is inherently lagging — it only confirms tops/bottoms after the fact
This swing structure gives the system a clear and noise-resistant way to identify pivot points (swing-points)

Yearly History Calendar-Aligned Price up to 10 Years)Overview
This indicator helps traders compare historical price patterns from the past 10 calendar years with the current price action. It overlays translucent lines (polylines) for each year’s price data on the same calendar dates, providing a visual reference for recurring trends. A dynamic table at the top of the chart summarizes the active years, their price sources, and history retention settings.
Key Features
Historical Projections
Displays price data from the last 10 years (e.g., January 5, 2023 vs. January 5, 2024).
Price Source Selection
Choose from Open, Low, High, Close, or HL2 ((High + Low)/2) for historical alignment.
The selected source is shown in the legend table.
Bulk Control Toggles
Show All Years : Display all 10 years simultaneously.
Keep History for All : Preserve historical lines on year transitions.
Hide History for All : Automatically delete old lines to update with current data.
Individual Year Settings
Toggle visibility for each year (-1 to -10) independently.
Customize color and line width for each year.
Control whether to keep or delete historical lines for specific years.
Visual Alignment Aids
Vertical lines mark yearly transitions for reference.
Polylines are semi-transparent for clarity.
Dynamic Legend Table
Shows active years, their price sources, and history status (On/Off).
Updates automatically when settings change.
How to Use
Configure Settings
Projection Years : Select how many years to display (1–10).
Price Source : Choose Open, Low, High, Close, or HL2 for historical alignment.
History Precision : Set granularity (Daily, 60m, or 15m).
Daily (D) is recommended for long-term analysis (covers 10 years).
60m/15m provides finer precision but may only cover 1–3 years due to data limits.
Adjust Visibility & History
Show Year -X : Enable/disable specific years for comparison.
Keep History for Year -X : Choose whether to retain historical lines or delete them on new year transitions.
Bulk Controls
Show All Years : Display all 10 years at once (overrides individual toggles).
Keep History for All / Hide History for All : Globally enable/disable history retention for all years.
Customize Appearance
Line Width : Adjust polyline thickness for better visibility.
Colors : Assign unique colors to each year for easy identification.
Interpret the Legend Table
The table shows:
Year : Label (e.g., "Year -1").
Source : The selected price type (e.g., "Close", "HL2").
Keep History : Indicates whether lines are preserved (On) or deleted (Off).
Tips for Optimal Use
Use Daily Timeframes for Long-Term Analysis :
Daily (1D) allows 10+ years of data. Smaller timeframes (60m/15m) may have limited historical coverage.
Compare Recurring Patterns :
Look for overlaps between historical polylines and current price to identify potential support/resistance levels.
Customize Colors & Widths :
Use contrasting colors for years you want to highlight. Adjust line widths to avoid clutter.
Leverage Global Toggles :
Enable Show All Years for a quick overview. Use Keep History for All to maintain continuity across transitions.
Example Workflow
Set Up :
Select Projection Years = 5.
Choose Price Source = Close.
Set History Precision = 1D for long-term data.
Customize :
Enable Show Year -1 to Show Year -5.
Assign distinct colors to each year.
Disable Keep History for All to ensure lines update on year transitions.
Analyze :
Observe how the 2023 close prices align with 2024’s price action.
Use vertical lines to identify yearly boundaries.
Common Questions
Why are some years missing?
Ensure the chart has sufficient historical data (e.g., daily charts cover 10 years, 60m/15m may only cover 1–3 years).
How do I update the data?
Adjust the Price Source or toggle years/history settings. The legend table updates automatically.
