CANDLE FILTER Todays scripts is based on my Pullback And Rally Candles with other meaningful candles such as Hammers and Dojis.
You can choose which Candles to show on the cart and if you want to candles to appear above or below a moving average.
If you follow my work, you may recognise some of these candles which I'm about to show you however these candles are 1) more refined and 2) has moving average filters.
Ive included a D,6H,1H Candle in this script as on different timeframes - each swing low on average has a different amount of bars within the swing low / swing high so the DPB and RD will only work on the Daily
//Pullback candle
This candle is very powerful when used with simple Price Action such as Market Structure//Demand zones and support zones. (((((WORKS BEST IN UPTRENDS AND BOTTOM OF RANGES)))))
Ive included a D,6H,1H Pullback Candle in this script as on different timeframes - each swing low on average has a different amount of bars within the swing low so the DPB will only work on the Daily
//DAILY PULLBACK (Swing Traders)
snapshot
//4H PULLBACK (Swing Traders)
snapshot
- this signal will produce more signals due to the swing low filter on the 4H
//1H PULLBACK
snapshot
- this signal has been refined due to too many candle displaying in weak areas
!!!IF YOU DONT WANT TO USE PULLBACKS DURING DOWNTRENDS THEN USE THE EMA FILTER TO TURN OFF THE PULLBACKS WHEN PRICE IS BELOW THE MOVING AVERAGE!!!
//Rally candle (My personal Favourite) (((((WORKS BEST IN DOWNTRENDS AND TOP OF RANGES)))))
This candle is very powerful when used with simple Price Action such as Market Structure//Supply zones and Resistance zones.
//DAILY RALLY(Swing Traders)
snapshot
//4H RALLY(Swing Traders)
snapshot
- this signal will produce more signals due to the swing high filter on the 4H
!!!IF YOU DONT WANT TO USE RALLIES DURING UPTRENDSTHEN USE THE EMA FILTER TO TURN OFF THE RALLIES WHEN PRICE IS ABOVE THE MOVING AVERAGE!!!
//POWERFUL DOJIS (INDECISION)
snapshot
We look for indecision in key areas to see if momentum is shifting. When combined with Pullbacks or Rallys - this will enhance the odds of a probably area.
//HAMMERS
snapshot
//MOVING AVERAGES
snapshot
Short EMA = 50
Long EMA = 200
This filter can be used when the market is trending - look out for rejections off the moving averages
Also you can chance the Short And Long EMA to choose which MA cross you want to use
snapshot
ALSO ALL THE CANDLES HAVE A ALERT CONDITIONS WHICH YOU CAN ACCESS - THIS WILL ALERT ANY CANDLE YOU CHOOSE
Please leave a like/comment on this post as this is much appreciated....
פטיש

Hammers & Stars Candle [2022]Hammer and Shooting Star Candle analysis >)
“The home crowd have been right behind their team and there are boos for the officials as they walk off at half-time. Elanga was unfortunate not to win the free-kick, although the clearer foul on him had come before the final tumble. He is entitled to think the ref would bring that back. Instead, United are a goal down.

Smarter Pullback + Candlestick Pattern (Steven Hart)Built with love "Smarter Pullback + Candlestick Pattern"
This indiator will help you to find a Pullback + Candlestick Pattern, inspirated by Steven Hart
You can combine with your own strategy, or use this purely
DISCLAIMER :
Measure the risk first before use it in real market
Backtest The Strategy was very important, so you know the probability
Fundamentally Logical :
Pullback (Some Previous candle is Red for Bull Pullback vice versa)
the Entry candle must be a Candlestick Pattern
Features :
1. Engulfing
2. Hammer & Shooting Star
3. Doji
How to use it :
1. Adjust the Pullback Period
2. Check and Uncheck the Pattern you want to see
3. Adjust the style to your favourite
Regards,
Hanabil

The Strat Numbers & CombosThis indicator is an all-in-one " The Strat " script. This script displays the following:
The Strat candle numbers (1's, 2's, & 3's)
The Strat Combo labels along with trigger line
Pivot Machine Gun ( PMG ) dynamic labels
Hammer & Shooter candle labels
The Strat Candle Numbers label each candle, on any timeframe, either a 1, 2, or 3. 1's are inside bars of the previous candles. 2's take out only one side of the previous candle. And 3's go outside both sides of the previous candle.
The Strat Combo labels (which are made of the 1's, 2's, 3's outlined above) display labels when a Strat Combo occurs. The script displays a label, direction arrow, and trigger line for each Strat Combo. This indicator finds the following Strat Combos:
2-1-2 bullish reversal (BLR)
2-1-2 bullish continuation (BLC)
3-1-2 BLR
3-2-2 BLR
1-2-2 rev strat BLR
2-2 BLR
2-1-2 bearish reversal (BRR)
2-1-2 bearish continuation (BRC)
3-1-2 BRR
3-2-2 BRR
1-2-2 rev strat BRR
2-2 BRR
Double inside candles
The Pivot Machine Gun (PMG) labels any 5 or more consecutive candles that make higher lows or 5 or more consecutive candles that make lower highs. A PMG can continue going in its direction or it can reverse and come back through the range. The logic in this indicator dynamically finds each level in a PMG and draws a line for easy identification.
The script also identifies if the candle type is a Hammer, Inverted Hammer, Shooting Star, or Hanging Man. These candle types are highly likely reversal points in price action.The indicator will plot a shape with a color coded icon identifying the candle. The distance between the shape and the candles can be manually adjusted in the inputs section.
This indicator has many style options . The user can independently toggle on/off the Strat numbers, boxes around the Strat Combos, and Hammer and Shooter shapes. Also all of the colors used in this script can be changed from the inputs section, so a user can easily change colors to match their current color scheme.

Hammer / Shooting Star ScannerAlways missing hammer and shooting star candlestick pattern?
This script will help you to alert hammer shooting star candlestick.
Please leave your comments for improving this script.

Favorite Signals w/EMA FilterThe script combines my favorite signals then filters them with three EMAs.
Via the Style tab, you can choose to either have the signals color the bar and/or plot a shape above/below.
All signals can be turned off via the Inputs tab, which will remove the bar color and/or shape (if not already off in the Style tab) as well as remove the pattern from the alerts function.
Remember when using TV alerts, if you change the script settngs, you must create a new alert if you wish to be alerted for the changes you've made.
LONG/SHORT SIGNALS INCLUDED FOR:
- TD8s
- TD9s
- Hammer
- Shooting Star
- Bullish Harami
- Bearish Harami
- RSI Divergences
EMA FILTER LOGIC LONGS:
- Price < Fast EMA & Med EMA > Slow EMA = Possible Long Entry
- Price > Fast EMA & Med EMA > Slow EMA = Possible Reversal, Tighten Stop or Reduce Position
EMA FILTER LOGIC SHORTS:
- Price > Fast EMA & Med EMA < Slow EMA = Possible Short Entry
- Price < Fast EMA & Med EMA < Slow EMA = Possible Reversal, Tighten Stop/Reduce Position
Big up to @spdoinkal, @HPotter, @LonesomeTheBlue, for writing the originals scripts for the signals above.
Enjoy!
Higher Time Frame Chart OverlayHello All,
This script gets OHLC values from any security and Higher/Same time frame you set, then creates the chart including last 10 candles. it shows Symbol name, Time Frame, Highest/Lowest level of last 10 candles and Close Price at the right side of the chart as well. Closing price text color changes by the real-time candle of the related symbol and time frame. The all this was made using the Tables in Pine and the chart location doesn't change even if you change the size of main chart window.
Almost everything can be change as you want. You can change/set:
- Colors of Body and Top/Bottom Wicks separately
- The Height of each Cell
- The Width of Body and Wicks
- The Background and Frame color
- Enable/disable Status Panel (if you disable Status Panel then only candle chart is shown)
- Location of Status Panel
- Text color and Text size
- The Background color of Status Panel
Some examples:
The info shown in Status Panel:
You can change The Height of each Cell and The Width of Body and Wicks
You can change colors:
You can change location of the chart:
If you add the script more than once then you can see the charts for different symbols and time frames: (This may slow down your chart)
If you right-click on the script and choose "Visual Order" => "Bring to front" then it will be better visually:
P.S. Using this script may slow down your chart, especially if you add it more than once
Enjoy!

MTF Candlestick Patterns Screening [tanayroy]This script displays all candle patterns found in multi-time frames for a given lookback period. Candle pattern screening logic is taken from TradingView’s built-in script. The script works with 5m, 15m, 30m, 1HR, 2HR, 4HR, D, W, M timeframe. Works best with 5m chart.
Options available for trend detection, lookback period, and selecting candle pattern.
Please like, comment, and follow.

HammersPlots an arrow above a hammer candle or candle with big lower wick. Yellow signifies a candle with higher than average volume. Blue is a lower than average volume candle. Hammers/Lower Wick candles are best after a drop in price or near bottoms.

RSI Signals by HBRELATIVE STRENGTH INDEX (RSI)
This is a tool that is widely used
Especially for Overbought and Oversold systems, but I have made some changes in this indicator,
How to use it...!
I have set it as the default setting
- RSI Length: 7
- Overbought: 70
- Oversold: 30
What is unique about this tool?
we can see 3 conditions:
1) RSI Overbought / Oversold with Bullish Engulfing / Bearish Engulfing
2) RSI Overbought / Oversold with Hammer and Shooting Star
3) RSI Overbought / Oversold with 2 Bullish Bars / 2 Bearish Bars
4) RSI Overbought / Oversold with All Patterns at the same time
When the RSI reaches its Oversold line, the code will wait for Bullish Engulfing pattren , when oversold and Bullish engulfing matched, This indicator will generate a buy signal when the condition is met,
and same as for Bear market, When the RSI reaches its Overbought line, the code will wait for Bearish Engulfing pattren , This indicator will generate a sell/exit signal when the condition is met,
2nd condition is that a Hammer candle will be waited for when RSI touches the Overbought line, for Bullish Move
and Shooting Star candle will be waited for when RSI touches the Overbought line, for Bullish Move, for Bearish Move
3rd Condition is also the same as Condition 1 and Condition 2,
When the RSI reaches its Oversold line, the code will wait for 2 Bullish Bars , when oversold and 2 Bullish Bars matched then this indicator will generate a buy signal, and same as for Bear market,
When the RSI reaches its Overbought line, the code will wait for 2 Bearish Bars , when overbought and 2 Bearish Bars matched then this indicator will generate a Sell signal,
4th Condition is that we can use All Conditions at the same time,
- Bullish Engulfing / Bearish Engulfing
- Hammer and Shooting Star
- 2 Bullish Bars / 2 Bearish Bars

Pivot Point CandlesIndicator that highlights Hammer, Inverted Hammer, Engulfing, and Harami candlestick patterns. Great for those looking for a quick way to show the most popular reversal patterns on the charts.
Options will allow you to select to show Hammers, Engulfing or Harami patterns only. You choose the combinations that you want. Great tool to learn and training your eyes to the patterns.
You also have an option to select "Super" versions of the Engulfing and the Harami patterns, the Supers only shows if the pattern engulfs the body and the wick of the smaller candle in the pattern.
The indicator will show Bullish opportunities and Bearish opportunities on the chart for each of the patterns. The inverted hammer will show at the top indicating a Bear move, and the Hammer will show below price indicating a Bullish move.
Use this indicator in conjunction with other Support & Resistance such as the simple moving averages, trend lines, flat lines, or even Bollinger bands. When these patterns show at or around these points on the chart they will indicate a reversal is pending. Wait for the next candle as confirmation that the move will actually take place in the direction indicated and you will have your pivot point on the chart and create a higher probability of success. Leverage Stochastic, RSI, or CCI indicators to help confirm the reversal as well. Look out for resistance above or support below to determine your targets for the reversal.
Happy trading!

Hammers & Stars StrategyOverview
This script trades basic hammer and shooting star candlestick patterns.
It's an extremely simple strategy with minimal filters, and according to my personal manual backtesting and automated trading results, performs best on the Daily chart on certain forex pairs.
It is intended to be traded on the forex markets but theoretically should work on all markets (especially if you optimize the settings).
The script also comes with complete AutoView automation for Oanda.
Make sure you've connected AutoView to TradingView and Oanda, then simply set an alert using the "alert() function calls only" condition and it will automatically execute trades based on whatever settings you've selected (only recommended for experienced traders - use at your own risk!)
If you're not sure how to set up AutoView, search "The Art of Trading AutoView Guide" on YouTube to find my detailed video guide.
Check out my website and YouTube channel for more information, scripts, resources and free Pine Script & trading lessons (link in my profile).
Best of luck with your trading!
- Matt / The Art of Trading
Settings Menu
Tooltips are included explaining what the various settings do, but here's a quick summary:
Strategy Settings
>= ATR Filter: Minimum size of entry candle compared to ATR
<= ATR Filter: Maximum size of entry candle compared to ATR
Stop Loss ATR: Stop loss multiplier (x ATR)
R:R: Risk:Reward profile
Fib Level: Used to calculate upper/lower third of candle. (For example, setting it to 0.5 will mean hammers must close >= 50% mark of the total candle size)
Start Date Filter: Date & time to begin trading from
End Date Filter: Date & time to stop trading
AutoView Oanda Settings
Use Oanda Demo: If turned on then oandapractice broker prefix will be used for AutoView alerts (demo account). If turned off then live account will be used
Use Limit Order: If turned on then AutoView will use limit orders. If turned off then market orders will be used (recommended to use limit order to mitigate spread issues)
Days To Leave Limit Order: This is your GTD setting (good til day)
Account Balance: Your account balance (used for calculating position size)
Account Currency: Your account balance currency (used for calculating position size)
Risk Per Trade %: Your risk per trade as a % of your account balance

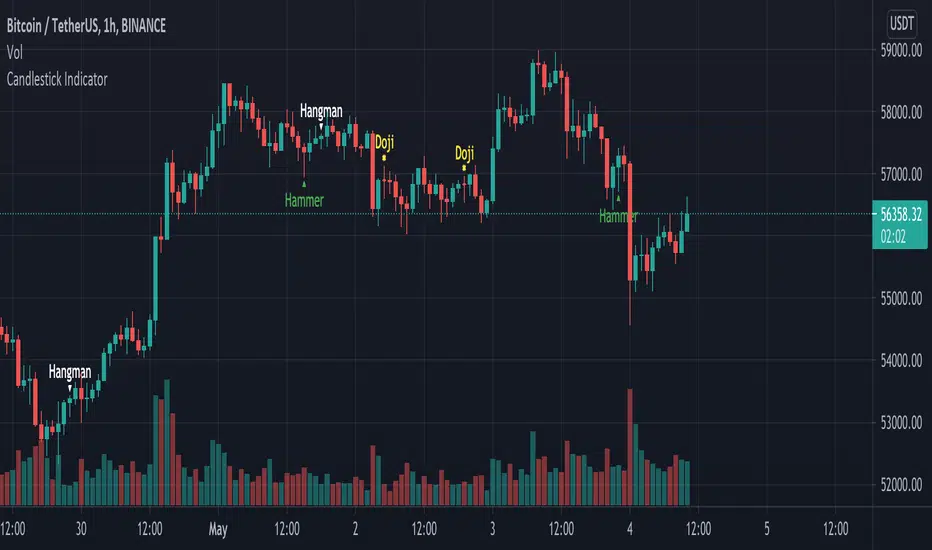
Candlestick Indicator by Crypto_AdhyetaA script to identify possible trend reversal based on Candlesticks. The correct candlestick type is identified by the relative position to Exponential Moving Average.
It detects:
- Hammer - if emerges during a downtrend (close below EMA(5)), the downtrend should end.
- Hanging Man - if comes after a advance (close above EMA(5)), the uptrend should end.
Confirmation:
- for aHammer not required
- a Hanging Man should be confirmed by lower close by the next candle
LepikkokynttiläSimple indicator highlighting Lepikkokynttilä.
You can tweak wick sizes, body size relative to candle size and colors.

Japanese Candle Patterns Detector in Potential price zoneThis script would find the 8 famous "Japanese Candle Stick Patterns" in your chart.
Please be aware it find patterns in "Potential price zones" only, which help you to avoid none-important patterns during a price trend.
I used RSI and ATR in my codes to find best candle forms and price conditions.
Bellow patterns are detecting:
Hammer | ShootingStar | Engulfing Candle | Doji | Tweezers Top/Buttom | Three White Soldiers/Three Black Crows | Marubozu | Harami
* You can select your preferred patterns from indicator setting.
* Pattern names are abbreviated for better view on chart.
I hope it helps you to improve your trading.

Hammer & Shooting Star Candle DetectorHi guys
This script will help you to find Hammer candles and also Shooting star candles.
These candle patterns indicate price reversal probability and should evaluate in bigger price context before using as a signal.
I hope you find it helpful and enjoy it.
Please leave your comments for improving this script.

CSPDMost Advanced & Accurate CandleStick Pattern Detector
Looking All Over of All Markets for All Important Powerful Reversal | Corrective Patterns (25 type)
Filtering the Results with Optional Features like Oscillator, Bollinger Bands, Volume Confirmation, Prior and Following Candles Confirmation which are Fully Customizable.
With this you can detect:
Hammer | Shooting star
Inverted Hammer | Hanging
Long legged Doji | Dragonfly Doji | Gravestone Doji
Bullish tweezers | Bearish tweezers
Bullish inside bar | Bearish inside bar
Bullish three line strike | Bearish three line strike
Bullish engulfing | Bearish engulfing
Piercing line | Dark cloud cover
Bullish abandoned baby | Bearish abandoned baby
Morning star | Evening star
Three white soldiers | Three black crows
*Bullish kayo | *Bearish kayo
Features:
Prior and Following candles Confirmation
You can set prior and following candle as basic prerequisites for marking candles as pattern to make sure you are at the top or bottom of the trend.
Volume confirmation
You can active volume increasing confirmation for some of pattern with adjustable increase % relative to prior candle | candles.
Oscillator Confirmation
Active oscillator confirmation. Select your approved oscillator from list (Stochastic, RSI, StochRSI, MFI, StochMFI) then enter desired value for marking candles as bullish | bearish pattern.
Bollinger Bands Confirmation
Active BB confirmation. Configure your Bollinger Bands. Now only see the patterns which reached or crossed from Bands. Also you can enable BB clod to have your BB indicator at the same time.
Adjustable Flexibility and Precision
You can set tolerance% for Osc and BB Confirmation - each one separately - for more control.
Self-adaptability
The properties of markets change over time, for example the amplitude of fluctuations and the intensity of movements. The script is designed in such a way that you can examine the price history as a benchmark for changes in market properties to adopt determinants. Also you can control those manually.
Self-regulatory
The user has the ability to change input factors depending on their point of view.
Behind the pattern recognition algorithms, there are relationships and similarities in their appearance that cause them to be influenced by each other. Simultaneously with changing the determining factors of each pattern by you, script automatically adjusts other details in accordance with your changes.
Alerts
You can set for type of pattern or each one of pattern have been detected.
Fully Costumizable
All of these options can be change and adjust.
Note 1.
The patterns are based on extensive study of reference and famous sources and the experience of me and my friends in trading and analysis with price action methods.
Note 2.
Due to the Pine limitations in the number of outputs | plots for each script, our attempt has been made to select the best and most important patterns.
Note 3.
So far, many scripts have been written in this field, but our experience with all of them and even the build in version was not satisfactory, and this was the initial motivation for making the script.
We strive to improve progress and elimination of shortcomings and we will continue to make this better.
Note 4.
Through personal experience and based on the principles of market and candlestick psychology, we discovered a new type of pattern and named it as Kayo.
kayo is a two candle pattern which formed when:
1.We have a pivot point with prior candles as left bars and following candles as right bar. Pivot candle called as second candle.
2.In a bullish kayo, first candle must closed descending and second candle must closed as ascending. For bearish kayo vise versa.
3.In a bullish kayo, second candle's lower wick must be longer then upper wick.
4. A pattern marked as kayo when its conditions do not correspond to any of the other patterns(include the confirmation that user added), ie it has the last naming priority over the other patterns.
Note 5.
When you active confirmation options for patterns like hammer, engulf and etc which they conditions are like kayo in some extent, if they can't pass the confirmation steps, they can be marked as kayo pattern.
Note 6.
If you active volume confirmation for Three white soldiers | Three black crows, the confirmation get passed if the volume of forth or third candle increased as value as entered relative to volume EMA3 of 3 candles.
Note 7.
In a bullish pattern all highs of following candles MUST be higher than prior highs and all lows of following candles MUST be higher than prior lows. For bearish patterns vise versa.
This type of confirmation depends on High and Low NOT close!
Gift to price action lovers!
Support us with your like and comments. let us know your experience, points and idea to make this better together.

Multi Price Action & Candlestick Patterns - Horizontals R/SNote:
This is a script that synthesizes a number of popular price action and candlestick patterns along with a trading strategy based on horizontal support and resistance. Scripts are used for learning and research purposes.
Useage:
Support and resistance are two important areas in Price Action analysis and trading. After confirming the support and resistance zone line, waiting to confirm the appropriate candlestick pattern and execute the trade, set a reasonable stop loss and take profit, This is critical for compliance with your money management rules.
Notation:
In the script, price action and candlestick pattern are denoted as follows:
- Bullish Engulfing (BU) & Bearish Engulfing (BE)
- Hammer (HM)
- Hanging Man (MM)
- Morning Star (MS)
- Evening Star (ES)
- Tweezer Top (TZT)
- Tweezer Bottom (TZB)
- Shooting Star (SS)
- Bullish Pinbar (PBBBU) & Bearish Pinbar (PBBE)
- Doji Gravestone (GS)
- Doji Dragonfly (DF)
- Doji - Long legged (LL)
- Spinning Top (ST)
Settings:
- Number of left candle to compare lowest/highest: Compare the high/low price of the current candle with the highest/lowest price of previous candles.
- Number of left candle to calc avg body: Compare the average price of the current candle with the average price of previous candles
- S/R Left Bars: The number of bars left hand side of the Pivot
- S/R Right Bars: The number of bars right hand side of the Pivot
- S/R Volume Threshold - The threshold value (%) for the volume oscillator
The code is open and commented - please feel free to use, share, comment & provide feedback.
Good luck!
Feel free to get indicator or strategy trading signals at yummyprofit.

Bitcoin Bullish Percent IndexHello Traders,
This is Bitcoin Bullish Percent Index script. First lets talk about what the Bullish Percent Index and how it is calculated:
"The Bullish Percent Index (BPI) is a breadth indicator based on the number of securities on Point & Figure Buy Signals, Developed by Abe Cohen in the mid-1950s. Because a security is either on a P&F Buy or Sell Signal, there is no ambiguity when it comes to P&F charts. This makes BPI a straightforward indicator with clearly defined signals."
The calculation is straightforward and simple: (Number of securities on P&F Buy signals) / (Total number of securities)
Here you can see what the P&F buy signal is:
In this script I choose 40 cryptos that is correlated ( as I see ) with BTC (including BtcUsdt). in the first part the script creates P&F chart for each security and check if there is Buy or Sell signal and sum the buy signals if there is. in the second part it creates P&F chart by using the P&F buy/sell signals coming from the securities P&F chart. because of complicated calculation the script may need a few seconds to load.
in the first part reversal value is 3 by default but you can set different values as reversal. sometimes I got better results with reversal = 5.
in BPI part reversal = 3 is used. so each box represents 2% (each X or O is a box). And this means it takes at least a 6% move in BPI for a reversal. the Bullish Percent Index favors the bulls when above 50% and the bears when below 50%. The bulls have the edge when over 50% of stocks are on a P&F Buy Signal. BPI is also considered overbought when above 70% and oversold when below 30%. BPI can move between 0 and 100.
Because of 40 securities are used in the script and all different prices, it uses Percentage scaling only. it can calculate the Percentage automatically by using the time frame of the chart or you can set it as you wish.
The Signals coming from BPI:
Bull Alert: BPI is below 30% and then forms a new column of X's (rises)
Bear Alert: BPI is above 70% and then forms a new column of O's that decline below 70%.
Bull Confirmed: BPI is on a P&F buy signal and in a column of X's (rising).
Bear Confirmed: BPI is on a P&F sell signal and in a column of O's (falling).
Bull Correction: BPI is on a P&F buy signal, but currently falling (column of O's).
Bear Correction: BPI is on a P&F sell signal, but currently rising (column of X's).
If you are not familiar with Bullish Percent Index you better search it on the net to get more info, you can find a lot of articles and web sites about BPI.
as I remember I developed the script 6-7 months ago and today I had chance to publish it as it was
Enjoy!

quantized pin bar indicator with ATRAbstract
This script computes the strength of pin bars.
This script uses the corrent and the previous two bars to compute the strength of pin bars.
The strength of pin bars can be also comared with average true range, so we can evaluate those pin bars are strong or weak.
Introduction
Pin bar is a popular price action trading strategy.
It is based on quick price rejection.
Most of existing pin bar scripts only determine if a bar is a pin bar or not.
However, evaluating the strength of pin bars is important.
If price rejection is too weak, it is difficult to trigger trend reversal.
If a pin bar is too strong, we may enter the trade too late and cannot have good profit.
In this script, it provides a method to compute to strength of pin bars.
After the strength of pin bars are quantized, they can compare with average true range, price range and trend strength, which can help us to determine where are worthy for us to open trades.
Computation
Bullish hammer : current low is lower than ( previous high or current open ) and current close.
Bearish gravestone : current high is higher than ( previous low or current open ) and current close.
Bullish engulfing and harami : ( current low or previous low ) is lower than ( previous 2nd high or previous open ) and current close.
Bearish engulfing and harami : ( current high or previous high ) is higher than ( previous 2nd low or previous open ) and current close.
Parameters
Smoothing : the type of computing average.
Length of ATR : determines the number of true ranges for computing average true range.
ATR multiplier line : the threshould that a pin bar is strong enough. For example, if this value is 0.5, it means a pin bar with 0.5*atr or more is considered a strong pin bar.
one direction pinbar : set to 1 if you want the strength of bullish pin bars and bearish pin bars are cancelled. Set to 0 if you want to keep both strength of bullish pin bars and bearish pin bars; in this case, you may need to change the plot style to make both strength visible.
Trading Suggestions
Evaluate the strength of trend against pin bars. After all, a single reverse pin bar may be too weak to reverse the trend.
Timeframe : if atr is higher than 4*spread, the timeframe is high enough. However, if strong pin bars appear too frequent or price range is too small, going to higher fimeframe may be more safe.
Entry and exit : according to personal flavors.
Conclusion
The strength of pin bars can be quantized.
With this indicator, we can find more potential pin bars which human eyes and binary pattern detectors were leaked.
In my opinion, 0.5*atr is the most suitable streng of a pin bar for my trade entry but I still need to consider the direction of the trend.
You are welcome to share your settings and related trading strategy.
References
Most of related knowledge can be searched from the internet.
I cannot say the exact references because they may violate the rules of Tradingview.

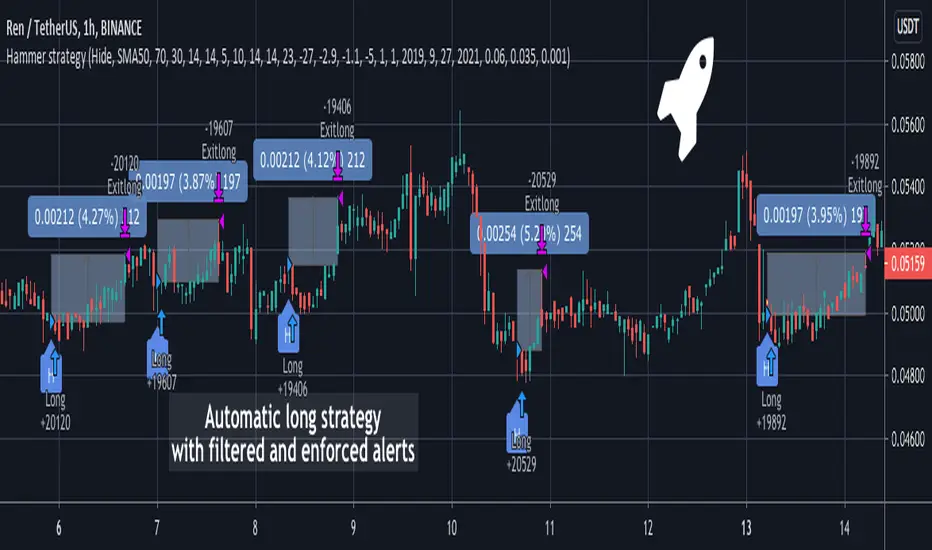
Hammer Long strategy with filtered and enforced alertsA Hammer Long strategy is a price pattern in candlestick charting that occurs when a security trades significantly lower than its opening, but rallies within the period to close near opening price. This pattern forms a hammer-shaped candlestick , in which the lower shadow is at least twice the size of the real body. The body of the candlestick represents the difference between the open and closing prices, while the shadow shows the high and low prices for the period.
Key takeaways:
Hammers have a small real body and a long lower shadow.
Hammers occur after a price decline.
The hammer candlestick shows sellers came into the market during the period but by the close the selling had been absorbed and buyers had pushed the price back to near the open.
The close can be above or below the open, although the close should be near the open in order for the real body to remain small.
The lower shadow should be at least two times the height of the real body.
Hammer candlesticks indicate a potential price reversal to the upside.
The strategy enhances standard Hammer pattern accuracy by clearing out market noises and manipulations from the indicator's triggers. Combination of Volume oscillator filter and Directional Movement Index (DMI) components values adjustments allows to detect only strong signals. The strategy is developed to forecast Long positions entries and exits. The strategy supports spot, futures, options and marginal trading exchanges. It works accurately with BTC, USD, USDT, ETH and BNB quote currencies. Best to use with 30 and 60 minutes timeframe charts. The strategy can be and should be configured for each particular asset. You can change filters and risk management settings to receive the most advanced accurate alerts
Advantages of this script:
1. Weak signals and market noises are filtered. This allows to receive only strong and confirmed alerts
2. Strategy can be easily configured in user interface for each particular asset
3. High performance. At the chart you can see examples of strategy entries and exits, you also can check strategy backtest for RENUSDT position:
Net profit: 26.95%
Percent profitable: 90%
Profit factor: 7.418
Duration of trade: 16 hours
How to use?
1. Apply indicator to the trading pair your are interested in at 30m or 60m timeframe chart
2. Configure the strategy: change filters values and risk management settings until Strategy tester shows good results according to mathematical expectation
3. Set up a TradingView alert to trigger when Hammer strategy conditions are met
4. Strategy will send alerts when to enter and when to exit positions
If you want to obtain access to the indicator please send us a personal message
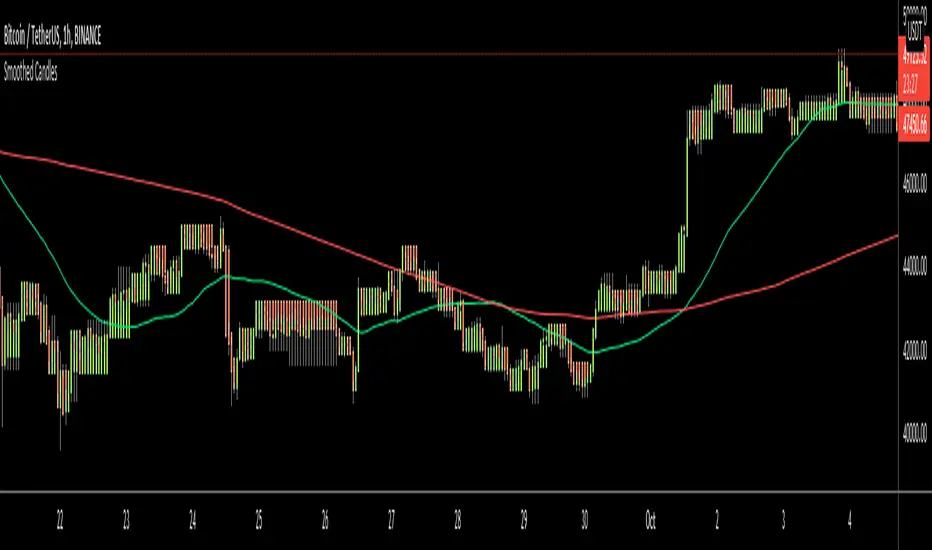
Smoothed CandlesHello Traders,
This is " Smoothed Candles " script to get rid of noises and to get a smoothed chart to figure out breakouts and price movements easily.
There are three scaling methods: User Defined, Dynamic (ATR) and Percentage
Optionally you can add 2 Simple Moving Averages and 2 Exponential Moving Averages
Optionally you can hide the Wicks, example:
You can add moving averages:
Easily find breakouts:
Enjoy!
Candlestick Patterns by Dipak V2I am really excited to publish my work, I know its at the beginning but there is a lot to come in the future. I am writing a script to identify the candlestick patterns. In this version, I have added Hammer and Hanging Man Pattern in the first version, I know its less but its a beginning, I will keep adding the new information in my script in upcoming versions.
This script is for only learning purpose and not for treading realtime. In this script, it only identifies the pattern and does not check for its confirmation or does not provide any stop-loss, Also it does not check the prior trend before the pattern. These things really matter in the live trade. But in future, I am planning to add these things.
If you like my work, please like or comment your ideas I will try to include those in upcoming versions.
Hanging Man:
Hanging man is a bearish reversal candlestick pattern that signals about the uptrend or advancing phase are over and bulls have lost their control. Color of the candle is not important.
Identity:
1) Comes after a significant up rally or uptrend or advancing phase.
2) Small real body at the top.
3) Long lower shadow at least twice the real body.
4) Very small or no upper shadow.
Confirmation:
Immediate next candle’s close should be below the hanging man’s real body.
StopLoss:
There is a potential resistance level above the top of the hanging man. Stoploss should be above the resistance area or at the high of the hanging man.
Hammer:
Hammer is a bullish reversal candlestick pattern that signals about the downtrend or declining phase are over and bears have lost their control. Color of the candle is not important.
Identity:
1) Comes after significant down rally or downtrend or declining phase.
2) Small real body at the top.
3) Long lower shadow at least twice the real body.
4) Very small or no upper shadow.
Confirmation:
Immediate next candle’s close should be above the hammer’s low.
StopLoss:
There is a potential support level below the low of the hammer. Stoploss should be below the support area or at the low of the hammer.
Note: The candle is the same for Hanging Man and Hammer , Difference is where they appear in the uptrend or in the downtrend that makes the real difference.
