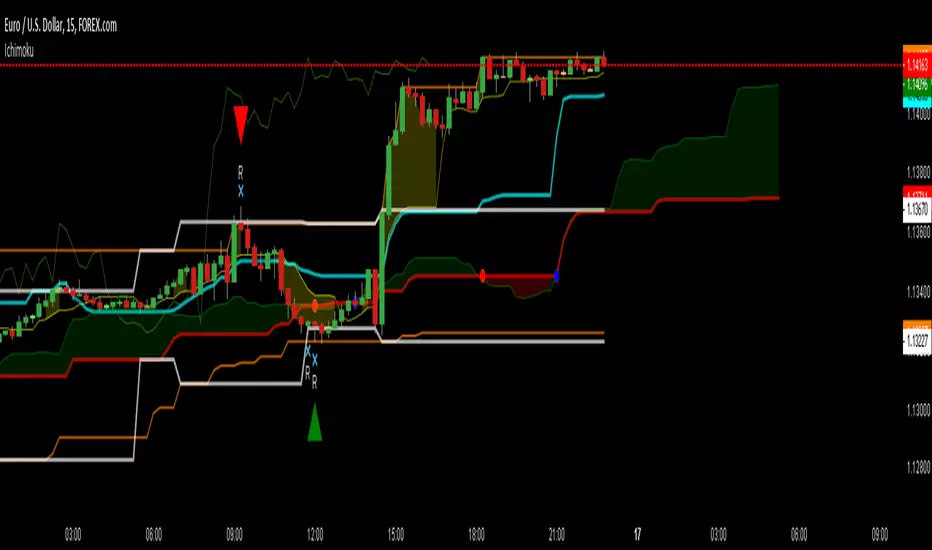
Same Idea as standard Ichimoku except using volume-weighted average high / low for the corresponding periods. adjustable displacement / time period inputs.
(YEK) Combo is a combination of several indicators (listed below). You can use them together or one by one. Just click settings, and choose which of them to be shown. Here are the indicators included in this script: - Ichimoku Cloud - Bollinger Bands - Moving Average 1 - Moving Average 2 (In case of detecting golden crosses or death crosses) - Exponential Moving...
The Skript uses Offsets in both positive and negative direction to give buy and sell alerts. Use the Script on a daily Timeframe - No financial advice - There are 3 Buy and 3 Sell alerts in the Skript. Buy 1 - B1: Buy e.g. 3% Buy 2 - B2: Buy e.g. 10% Buy 3 - B3: Buy e.g. 50% Sell 1 - S1: Sell e.g. 5% Sell 2 - S2: Sell e.g. 30% Sell 3 - S3: Sell e.g. 90%
The "Ichimoku Cloud Offset Daily Strategy" - Indicator uses an Offset to tell when market is possibly overbought or oversold.
detect candle pattern on icihmoku and send alerts
Candle signal on ichimoku levels with customized screener lists embedded
Estrategia basada en un principio de ichimoku, Green Long , Red Short. Make it simple.
This indicator contains : 4 Ichimoku clouds 8 Moving Averages 1 Fibonacci Bollinger Bands 2 Normal Bollinger Bands
MTF Ichimoku Clouds - defult is 4h and another ichimoku cloud is on actual time frame you are.
Original Cloud code base from "Ichimoku Cloud Enhanced For Crypto" Link here At a glance simplified rendering of ichimoku cloud elements and algorithmic detection of all ichimoku cloud events. Has alert conditions for all/most events you would want. Central red/green band represents the cloud and the current "future" cloud colour. Kumo Twists are shown for...
This indicator offers Ichimoku clouds for periods 1, 7, and 30. When used on the DAILY chart these correspond to the D, W & M time frames respectively. The indicator just has the clouds right now because that's all I use. It doesn't have tenken, kijun or anything right now.
Trigger alerts when candle pattern are detected. More conditions are shown : if previous ichimoku levels are touched, if divergence is being raised.
BITFINEX:ETHUSD Hi. This is MBY_LAB. This indicator is a paid indicator. The color of the moving average reflects MACD. The signal line in the middle of the screen is the Ichimoku baseline. And you can also trade through the Bollinger Band at the same time, and you can turn it off when you need it. You can see the Fibonacci resistance line and supporting...
I just found this script from @kingthies here and like it. So i just made some changes and added some little code into it. Reduced some noise for the signals. Hope anyone can enjoy it. But keep in mind, did not test it on live trading! Had just some time and love to work in pine :) Original Happy Trading