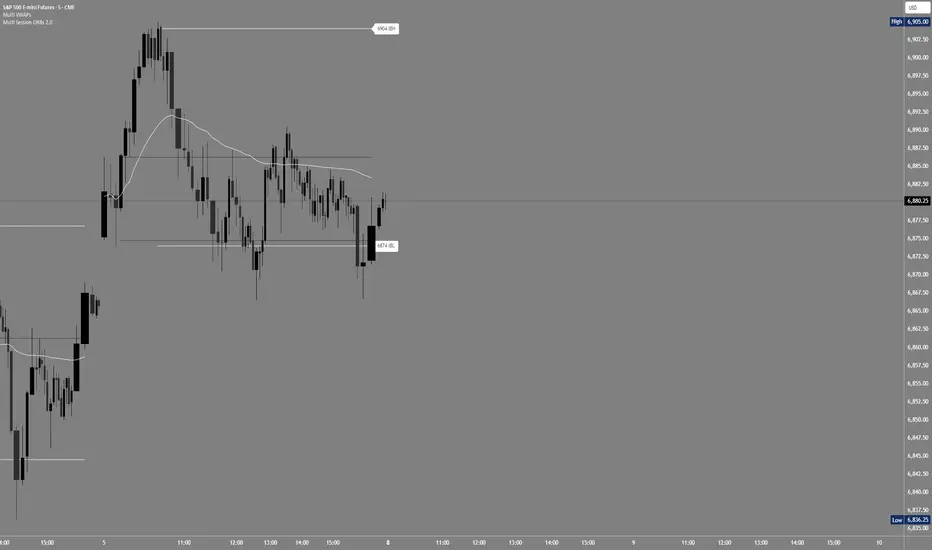
Multi Session ORBs 2.0Multi Session ORBs 2.0 is an intraday tool for session-based traders who rely on Opening Range Breakout and Initial Balance structures to frame trades around the Tokyo, London, and New York sessions. It automatically detects the main sessions in New York time and plots each session’s opening-range high, low, and optional mid, with shaded boxes that highlight the active range and clean horizontal levels that extend across the session for precise breakout, rejection, and rotation analysis.
The script also builds a dedicated New York Initial Balance from 09:30 to 10:30 ET and then projects those IB levels forward from 10:30 through the rest of the NY session, helping intraday traders track first-hour value, monitor when price accepts or rejects that area, and structure trades around range breaks or mean reversion. Optional labels and vertical markers print 15 minutes before the London and New York opens, making it easier to anticipate volatility windows and align entries with key session transitions.
This indicator is designed to be used preferably in confluence with the separate Multi VWAPs tool, which plots multiple VWAPs across different time horizons so that traders can combine session ORB/IB levels with VWAP-based dynamic support and resistance for stronger intraday bias and higher-quality trade locations.
Initialbalance
EDGE Session LevelsEDGE Session Levels - Comprehensive Intraday Reference Tool
═════════════════════════════════════════════════════════════
OVERVIEW:
EDGE Session Levels automatically plots the most critical price levels that professional traders reference throughout the trading day. This indicator eliminates the need to manually draw or track key session levels, giving you instant visual reference points for support, resistance, and market context.
Designed primarily for futures indices traders (ES, NQ, YM, RTY), this indicator comes pre-configured with the correct session times for equity index futures. However, all time windows are fully customizable, making it adaptable for any futures product including Gold, Crude Oil, Bonds, Stock and more.
═════════════════════════════════════════════════════════════
KEY FEATURES
▸ PRIOR SESSION LEVELS (Yesterday's High & Low)
Displays the previous day's RTH (Regular Trading Hours) high and low. These are among the most watched levels by institutional traders and frequently act as support/resistance zones.
▸ CASH SESSION CLOSE
Plots yesterday's closing price at the end of Regular Trading Hours (default: 3:15 PM CT / 4:15 PM ET). This level represents the final price where cash equity market participants ended their trading day and is a key reference for overnight gap analysis and mean reversion strategies.
▸ CASH SESSION OPEN
Marks today's opening price when the cash equity market opened (default: 8:30 AM CT / 9:30 AM ET). The cash open is a critical level as it represents the first price where stock market participants could execute trades, often leading to significant reactions at this level throughout the session. This time window is fully configurable for traders of other products with different pit open times.
▸ GLOBEX HIGH/LOW (Overnight Range)
Tracks and displays the overnight session's high and low. These levels update dynamically during the Globex session and become fixed once RTH begins. The overnight range often contains price during slower trading periods and breakouts from this range can signal directional momentum.
▸ INITIAL BALANCE (First Hour High/Low)
Captures and displays the high and low of the first hour of trading (8:30-9:30 AM CT). The Initial Balance is a cornerstone of Market Profile theory and is used to gauge whether the market is likely to trend or remain range-bound for the session.
▸ OPENING RANGE BOX
Draws a visual box representing the first 30 seconds of the RTH session. This micro-range can act as an early indication of opening sentiment and potential breakout direction.
═════════════════════════════════════════════════════════════
HOW TO USE THIS INDICATOR
SUPPORT & RESISTANCE
All plotted levels serve as potential support and resistance zones. Watch for price reactions, rejections, or breakouts at these levels to inform your trading decisions.
MARKET CONTEXT
• Trading above prior session levels = bullish context
• Trading below prior session levels = bearish context
• Trading within the overnight range = consolidation/balance
• Breaking out of overnight range = potential trend initiation
INITIAL BALANCE STRATEGY
• Price accepting above IB High = bullish bias for the session
• Price accepting below IB Low = bearish bias for the session
• Price remaining within IB = balanced/rotational day expected
CASH LEVELS
The Cash Open and Cash Close levels are particularly important because they represent where equity market participants (not just futures traders) began and ended their activity. Large institutions often reference these levels for portfolio rebalancing and hedging.
═════════════════════════════════════════════════════════════
CONFIGURATION OPTIONS
Each level group includes the following customization options:
• Display Toggle - Show or hide the entire level group
• Tags Toggle - Show or hide the text labels
• Color Selection - Customize the color of each line
• Line Style - Choose between solid, dashed, or dotted lines
• Line Thickness - Adjust width from 1-4 pixels
═════════════════════════════════════════════════════════════
SESSION TIME SETTINGS
DEFAULT SETTINGS (Equity Index Futures - ES, NQ, YM, RTY):
• Cash Open Window: 08:30-08:31 (8:30 AM CT / 9:30 AM ET)
• Cash Close Window: 15:15-15:16 (3:15 PM CT / 4:15 PM ET)
• Opening Range: 08:30-08:31
• Regular Hours: 08:30-15:15
• Initial Balance: 08:30-09:30
ADJUSTING FOR OTHER PRODUCTS:
If you trade products other than equity index futures, you will need to adjust the session times to match your product's trading hours.
Gold Futures (GC):
• Pit Open: 07:20 CT (8:20 AM ET)
• Adjust Cash Open Window to: 07:20-07:21
Crude Oil Futures (CL):
• Pit Open: 08:00 CT (9:00 AM ET)
• Adjust Cash Open Window to: 08:00-08:01
Treasury Futures (ZB, ZN):
• Pit Open: 07:20 CT (8:20 AM ET)
• Adjust Cash Open Window to: 07:20-07:21
Note: All times in TradingView use the exchange timezone. For CME products, this is Central Time (CT). Adjust the 4-digit time codes accordingly for your specific product and exchange.
═════════════════════════════════════════════════════════════
LEVEL LABELS REFERENCE
• YHi - Yesterday's High
• YLo - Yesterday's Low
• CashCl - Yesterday's Cash Session Close
• CashOpen - Today's Cash Session Open
• ONH - Overnight High (Globex High)
• ONL - Overnight Low (Globex Low)
• IBH - Initial Balance High
• IBL - Initial Balance Low
═════════════════════════════════════════════════════════════
TIMEFRAME RECOMMENDATIONS
This indicator is designed for intraday timeframes. Recommended usage:
• 1-minute to 15-minute charts: All features fully functional
• Hourly charts: Most features work; Opening Range Box may not display
• Daily and above: Indicator will not display (levels are intraday concepts)
For best results, use on 5-minute or 15-minute charts where all levels are clearly visible and price interaction can be easily observed.
═════════════════════════════════════════════════════════════
NOTES
• All levels automatically reset at the start of each new session
• Overnight High/Low levels update dynamically during Globex hours
• The Opening Range Box extends throughout the RTH session for visual reference
• Initial Balance levels appear after the first hour of trading completes

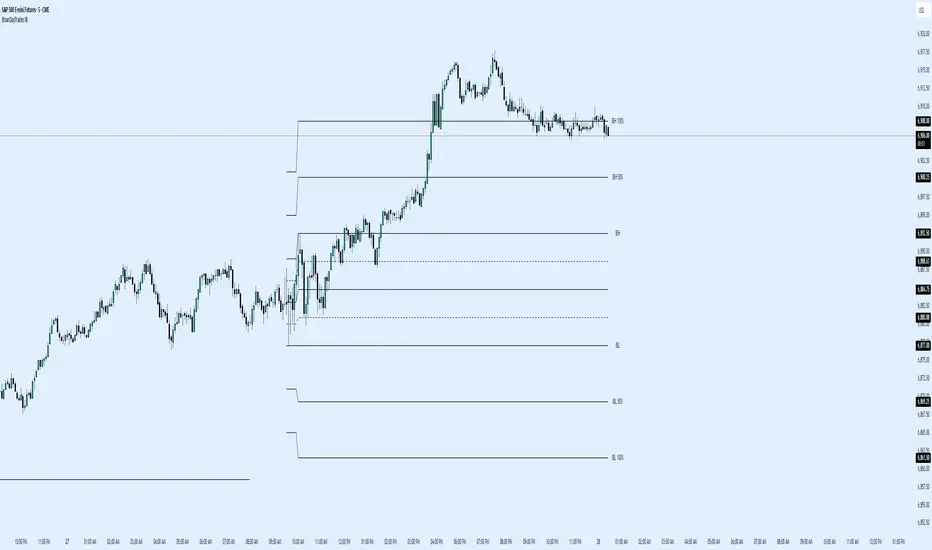
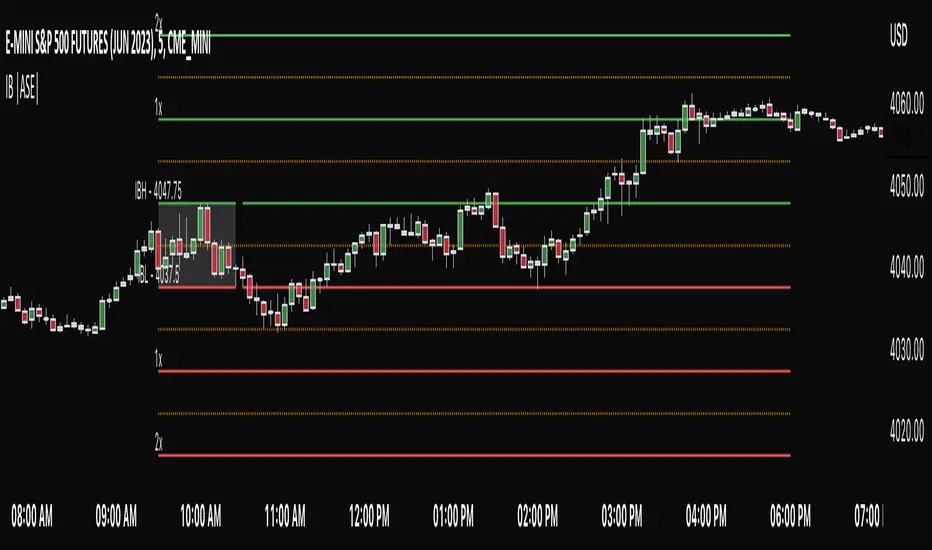
BrianDayTrades IBThis indicator plots the Initial Balance for the NY Open. This takes the high and low of the first hour between 9:30am and 10:30am New York time.
You can adjust which lines and labels are shown.
The Initial Balance high and low are shown with 25%, 50%, 75% lines; as well as 50% and 100% above and below the IB range for targets to use as take profits.
IB SessionsMarks the initial balance of each session (first hour).
Also the weekly IB is marked (first asian session)
Breakout lines for each session to determine possible breakouts on the session.

50-Minute Opening Range BreakoutThis is a test of the opening range with Bearish/Bullish confirmation

BORB 5m 15m IB5m and 15m OR indicator with 100% extensions for each.
Also has Initial Balance with 50% extensions.
NY session.


Previous TPOIndicator Summary
This Pine Script indicator, "Previous TPO," is designed to calculate and display five key price levels from the previous trading day's market activity. It uses a 30-minute TPO (Time Price Opportunity) profile, which is a method of organizing price by time to find areas of high and low activity.
The five levels it plots on the current day are:
1. Previous Value Area High (VAH)
2. Previous Value Area Low (VAL)
3. Previous Point of Control (POC)
4. Previous Initial Balance High (IBH)
5. Previous Initial Balance Low (IBL)
The script is built to be efficient, running its main calculation only once at the beginning of each new day. It also includes an automatic line management system to delete old lines, preventing the "Too many lines" error and keeping the chart clean.
How the Code Works
1. Data Collection: At the start of a new day (00:00), the script looks back at the chart's history. It uses request.security to access 30-minute bar data.
2. Collector Loop: It then loops backward, bar by bar, to find and store 48 unique 30-minute High/Low data points, which represents the full 24-hour range of the previous day.
3. TPO Profile: With this 30-minute data, it builds a TPO profile. It divides the previous day's price range into small bins (price levels) and counts how many 30-minute periods "touched" each price bin.
4. Level Calculation:
o POC: It finds the price bin with the highest TPO count (the most traded price) and sets it as the Point of Control.
o VAH/VAL: It starts at the POC and expands outward, adding the next-most-traded price bins until 70% (or the user-defined percentage) of the day's TPOs are included. The highest and lowest prices of this range are the Value Area High and Value Area Low.
o IBH/IBL: It identifies the high and low of the first hour (the first two 30-minute bars) of the previous day to set the Initial Balance High and Initial Balance Low.
5. Drawing: The script draws these five levels as horizontal lines across the current trading day, providing a constant reference.
6. Line Management: It keeps track of all lines in an array. When the total number of lines exceeds the user's limit (e.g., 50 days * 5 lines = 250), it automatically deletes the oldest lines from the chart.
Usefulness for Trading
This indicator provides a powerful framework for intraday traders by contextualizing the current day's price action against the previous day's "auction."
• Key Support/Resistance: The VAH, VAL, and POC act as significant support and resistance lev-els. Price reacting at these levels can signal mean reversion, while acceptance beyond them can signal a trend or expansion day.
• Value Area as Context: Trading inside the previous day's value area (between VAH and VAL) is often seen as "balanced" or "range-bound" trading. Trading outside of it is "unbalanced" or "trending."
• POC as a "Magnet": The POC, being the area of highest volume/time, often acts as a "magnet" or "center of gravity" for price.
• Opening Range: The Initial Balance (IB) levels show the opening range. A breakout from this range is often a key signal for the day's initial direction.
• 80% Rule: The script contains (currently commented-out) setup logic for the "80% Rule." This is a specific Market Profile strategy where:
1. The market opens inside the previous day's Value Area.
2. The Initial Balance fails to extend outside the VA (e.g., in a short setup, the IB high stays below the VAH).
3. This setup suggests an 80% probability that the price will rotate and test the other side of the Value Area (e.g., test the VAL).
Publication and restrictions
This script is published under the Mozilla Public Licence 2.0 (MPL 2.0) and is therefore suitable for publi-cation as an open source indicator on TradingView.
Timeframe limitation: The indicator is designed for intraday timeframes. Timeframes below 10 minutes do not work and lead to an error. Recommended time frame 30 minutes.
It will not work correctly on:
Time frame under 10 minutes: The data collection loop (max_bars_to_check = 3000) is not large enough to collect the bars required for a full day on a 5-minute chart or smaller.
High time frames (e.g. 1H, 4H, Daily): The script's logic is based on a chart timeframe 30-minute data that it requests. If higher time frames are selected, the script works but the zones are no longer correct or become irrelevant.

Initial Balance Breakout Signals [LuxAlgo]The Initial Balance Breakout Signals help traders identify breakouts of the Initial Balance (IB) range.
The indicator includes automatic detection of IB or can use custom sessions, highlights top and bottom IB extensions, custom Fibonacci levels, and goes further with an IB forecast with two different modes.
🔶 USAGE
The initial balance is the price range made within the first hour of the trading session. It is an intraday concept based on the idea that high volume and volatility enter the market through institutional trading at the start of the session, setting the tone for the rest of the day.
The initial balance is useful for gauging market sentiment, or, in other words, the relationship between buyers and sellers.
Bullish sentiment: Price trades above the IB range.
Mixed sentiment: Price trades within the IB range.
Bearish sentiment: Price trades below the IB range.
The initial balance high and low are important levels that many traders use to gauge sentiment. There are two main ideas behind trading around the IB range.
IB Extreme Breakout: When the price breaks and holds the IB high or low, there is a high probability that the price will continue in that direction.
IB Extreme Rejection: When the price tries to break those levels but fails, there is a high probability that it will reach the opposite IB extreme.
This indicator is a complete Initial Balance toolset with custom sessions, breakout signals, IB extensions, Fibonacci retracements, and an IB forecast. All of these features will be explained in the following sections.
🔹 Custom Sessions and Signals
By default, sessions for Initial Balance and breakout signals are in Auto mode. This means that Initial Balance takes the first hour of the trading session and shows breakout signals for the rest of the session.
With this option, traders can use the tool for open range trading, making it highly versatile. The concept behind open range (OR) is the same as that of initial balance (IB), but in OR, the range is determined by the first minute, three or five minutes, or up to the first 30 minutes of the trading session.
As shown in the image above, the top chart uses the Auto feature for the IB and Breakouts sessions. The bottom chart has the Auto feature disabled to use custom sessions for both parameters. In this case, the first three minutes of the trading session are used, turning the tool into an Open Range trading indicator.
This chart shows another example of using custom sessions to display overnight NASDAQ futures sessions.
The left chart shows a custom session from the Tokyo open to the London open, and the right chart shows a custom session from the London open to the New York open.
The chart shows both the Asian and European sessions, their top and bottom extremes, and the breakout signals from those extremes.
🔹 Initial Balance Extensions
Traders can easily extend both extremes of the Initial Balance to display their preferred targets for breakouts. Enable or disable any of them and set the IB percentage to use for the extension.
As the chart shows, the percentage selected on the settings panel directly affects the displayed levels.
Setting 25 means the tool will use a quarter of the detected initial balance range for extensions beyond the IB extremes. Setting 100 means the full IB range will be used.
Traders can use these extensions as targets for breakout signals.
🔹 Fibonacci Levels
Traders can display default or custom Fibonacci levels on the IB range to trade retracements and assess the strength of market movements. Each level can be enabled or disabled and customized by level, color, and line style.
As we can see on the chart, after the IB was completed, prices were unable to fall below the 0.236 Fibonacci level. This indicates significant bullish pressure, so it is expected that prices will rise.
Traders can use these levels as guidelines to assess the strength of the side trying to penetrate the IB. In this case, the sellers were unable to move the market beyond the first level.
🔹 Initial Balance Forecast
The tool features two different forecasting methods for the current IB. By default, it takes the average of the last ten values and applies a multiplier of one.
IB Against Previous Open: averages the difference between IB extremes and the open of the previous session.
Filter by current day of the week: averages the difference between IB extremes and the open of the current session for the same day of the week.
This feature allows traders to see the difference between the current IB and the average of the last IBs. It makes it very easy to interpret: if the current IB is higher than the average, buyers are in control; if it is lower than the average, sellers are in control.
For example, on the left side of the chart, we can see that the last day was very bullish because the IB was completely above the forecasted value. This is the IB mean of the last ten trading days.
On the right, we can see that on Monday, September 15, the IB traded slightly higher but within the forecasted value of the IB mean of the last ten Mondays. In this case, it is within expectations.
🔶 SETTINGS
Display Last X IBs: Select how many IBs to display.
Initial Balance: Choose a custom session or enable the Auto feature.
Breakouts: Enable or disable breakouts. Choose custom session or enable the Auto feature.
🔹 Extensions
Top Extension: Enable or disable the top extension and choose the percentage of IB to use.
Bottom extension: Enable or disable the bottom extension and choose the percentage of IB to use.
🔹 Fibonacci Levels
Display Fibonacci: Enable or disable Fibonacci levels.
Reverse: Reverse Fibonacci levels.
Levels, Colors & Style
Display Labels: Enable or disable labels and choose text size.
🔹 Forecast
Display Forecast: Select the forecast method.
- IB Against Previous Open: Calculates the average difference between the IB high and low and the previous day's IB open price.
- Filter by Current Day of Week: Calculates the average difference between the IB high and low and the IB open price for the same day of the week.
Forecast Memory: The number of data points used to calculate the average.
Forecast Multiplier: This multiplier will be applied to the average. Bigger numbers will result in wider predicted ranges.
Forecast Colors: Choose from a variety of colors.
Forecast Style: Choose a line style.
🔹 Style
Initial Balance Colors
Extension Transparency: Choose the extension's transparency. 0 is solid, and 100 is fully transparent.

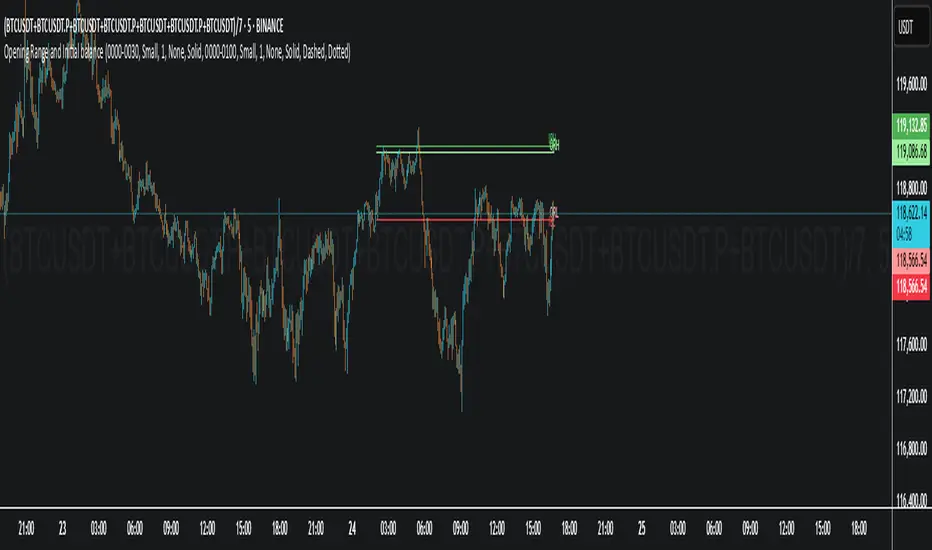
Opening Range and Initial balanceThis indicator represents Opening Range and Initial Balance levels.
Opening Range represents the high and low established during the first few minutes of the trading session — usually 5, 15 or 30 minutes.
Initial Balance represents the high and low established during the first hour of the trading session.
Initial Balance Wave MapThis indicator visualizes the Initial Balance (IB) range for any session, marking the first hour's high and low. It includes optional midpoints, extensions (e.g. 1.5x IB, 2x IB), and customizable time windows. Additional features allow users to display session open, high, low, close, and VWAP reference points. Designed to support price action and session structure analysis, it adapts to various global futures and FX market opens. All display elements are optional and fully configurable.
This updated indicator builds upon the open-source foundation by @noop-noop with enhancements and user-facing labels tailored for Auction Market Theory, scalping, and structure-based trade setups.
Key updated Featured: Multiple previous day's IB levels carry forward into the current day's chart, as opposed to just the previous day's levels carrying forward to the new IB time.
🙌 Credits:
This script builds upon the excellent open-source work by @noop-noop. Original script available here .

Initial balance - weeklyWeekly Initial Balance (IB) — Indicator Description
The Weekly Initial Balance (IB) is the price range (High–Low) established during the week’s first trading session (most commonly Monday). You can measure it over the entire day or just the first X hours (e.g. 60 or 120 minutes). Once that session ends, the IB High and IB Low define the key levels where the initial weekly range formed.
Why Measure the Weekly IB?
Week-Opening Sentiment:
Monday’s range often sets the tone for the rest of the week. Trading above the IB High signals bullish control; trading below the IB Low signals bearish control.
Key Liquidity Zones:
Large institutions tend to place orders around these extremes, so you’ll frequently see tests, breakouts, or rejections at these levels.
Support & Resistance:
The IB High and IB Low become natural barriers. Price will often return to them, bounce off them, or break through them—ideal spots for entries and exits.
Volatility Forecast:
The width of the IB (High minus Low) indicates whether to expect a volatile week (wide IB) or a quieter one (narrow IB).
Significance of IB Levels
Breakout:
A clear break above the IB High (for longs) or below the IB Low (for shorts) can ignite a strong trending move.
Fade:
A rejection off the IB High/Low during low momentum (e.g. low volume or pin-bar formations) offers a high-probability reversal trade.
Mid-Point:
The 50% level of the IB range often “magnetizes” price back to it, providing entry points for continuation or reversal strategies.
Three Core Monday IB Strategies
A. Breakout (Open-Range Breakout)
Entry: Wait for 1–2 candles (e.g. 5-minute) to close above IB High (long) or below IB Low (short).
Stop-Loss: A few pips below IB High (long) or above IB Low (short).
Profit-Target: 2–3× your risk (Reward:Risk ≥ 2:1).
Best When: You spot a clear impulse—such as a strong pre-open volume spike or news-driven move.
B. Fade (Reversal at Extremes)
Entry: When price tests IB High but shows weakening momentum (shrinking volume, upper-wick candles), enter short; vice versa for IB Low and longs.
Stop-Loss: Just beyond the IB extreme you’re fading.
Profit-Target: Back toward the IB mid-point (50% level) or all the way to the opposite IB extreme.
Best When: Monday’s action is range-bound and lacks a clear directional trend.
C. Mid-Point Trading
Entry: When price returns to the 50% level of the IB range.
In an up-trend: buy if it bounces off mid-point back toward IB High.
In a down-trend: sell if it reverses off mid-point back toward IB Low.
Stop-Loss: Just below the nearest swing-low (for longs) or above the nearest swing-high (for shorts).
Profit-Target: To the corresponding IB extreme (High or Low).
Best When: You see a strong initial move away from the IB, followed by a pullback to the mid-point.
Usage Steps
Configure your session: Measure IB over your chosen Monday timeframe (whole day or first X hours).
Choose your strategy: Align Breakout, Fade, or Mid-Point entries with the current market context (trend vs. range).
Manage risk: Keep risk per trade ≤ 1% of account and maintain at least a 2:1 Reward:Risk ratio.
Backtest & forward-test: Verify performance over multiple Mondays and in a paper-trading environment before going live.

[TTM] ICT Sessions & Ranges🌟 Overview 🌟
The ICT Sessions & Ranges Indicator helps traders identify key intraday price levels by marking custom session highs/lows and opening ranges.
It helps traders spot potential liquidity grabs, reversals, and breakout zones by tracking price behavior around these key areas
🌟 Session Highs & Lows – Liquidity Zones 🌟
Session highs and lows often attract price due to stop orders resting above or below them. These levels are frequently targeted during high-volatility moves.
🔹 Asia Session
- Usually ranges in low volatility.
- Highs/lows often get swept during early London.
- Price may raid these levels, then reverse.
🔹 London Session
- First major volatility of the day.
- Highs/lows often tested or swept in New York.
- Commonly forms the day’s true high or low.
🌟 Opening Range Concepts 🌟
The Opening Range is the first 15, 30, or 60 minutes of a session (e.g., New York).
The high (ORH) and low (ORL) define the market’s initial balance and key reaction levels.
🔹 Breakout Trade
- Price breaks ORH/ORL with momentum.
- Signals directional intent.
- Traders enter on the breakout, with stops inside the range.
🔹 Liquidity Raid
- Price briefly breaks ORH/ORL to trigger stops.
- Reverses after the sweep.
- Look for structure shift and entry near FVG or OB.
🌟 Customizable Settings 🌟
The indicator includes 3 configurable ranges , each with:
Start & End Time – Set any custom time window.
Display Type – Choose Box (highlight range) or Lines (mark high/low).
Color Settings – Set custom colors for boxes and lines.
🌟 Default Settings 🌟
Range 1 : 19:00–00:00 (Asia Session)
Range 2 : 01:45–05:15 (London Session)
Range 3 : 09:30–10:00 (NY Opening Range – 30m)

VWAP 2.0 with desv + Initial Balance by RiotWolftrading🌟 Overview
This powerful tool is designed for traders who want to harness the power of the Volume Weighted Average Price (VWAP) alongside session-based ranges to make informed trading decisions. Whether you're a day trader or a swing trader, this indicator provides a clean and effective way to identify support, resistance, and market trends—all in one place! 💡
✨ Key Features
Auto-Anchored VWAP 📊
Automatically calculates the VWAP based on a user-defined anchor period (e.g., Daily, Weekly, Monthly).
Resets at the start of each period (e.g., daily for a Daily anchor).
Displays a customizable VWAP line with standard deviation bands to highlight key price levels.
Standard Deviation Bands 📏
Plots up to three sets of standard deviation bands above and below the VWAP (multipliers: 1.0, 2.0, 3.0).
Includes volume percentage labels to show where trading volume is concentrated. 📉
Session High/Low Range 🕒
Identifies the high and low prices within a customizable session (default: 12:00 to 15:31).
Draws horizontal lines at the session high and low, with dotted deviation lines for additional reference points.
Perfect for spotting key levels during your trading session! 🔑
Time-Based Range Box ⏰
Highlights a specific time window (default: 15:40 to 15:50) with a colored box showing the high and low prices.
Ideal for tracking price action during high-impact events like news releases or market opens. 📅
Alerts 🚨
Set up alerts for when the price crosses above or below the VWAP—never miss a potential trading opportunity!
⚙️ Settings
Customize the indicator to fit your trading style with these easy-to-use settings:
VWAP Settings
Timezone 🌍: Select your timezone (default: GMT+2) to align calculations with your local time.
VWAP Source 📈: Choose the price source for VWAP (default: hlc3 - average of high, low, close).
Std Deviation Multipliers 📐: Adjust the multipliers for the bands (default: 1.0, 2.0, 3.0).
Line Width ✏️: Set the thickness of the VWAP and band lines (default: 1).
Session Time ⏳: Define the session window for VWAP calculations (default: 08:00-18:00, all days).
Show Upper/Lower Bands 👀: Toggle visibility for each set of bands (default: Band 1 visible, Bands 2 & 3 hidden).
Range Settings
Range Start/End Time 🕙: Set the time window for the range box (default: 15:40 to 15:50).
Box Color 🎨: Customize the border color (default: blue).
Box Background Color 🖌️: Adjust the background color (default: light aqua, 90% transparency).
I created this indicator to provide a streamlined, clutter-free tool for traders who rely on VWAP and session-based analysis. It focuses on the essentials—VWAP, standard deviation bands, session high/low, and range box—without unnecessary overlays. I hope it helps you in your trading journey! If you have feedback or suggestions, feel free to share—I’d love to hear from you! 😊

Weekly Initial BalanceWeekly Initial Balance Indicator
The Weekly Initial Balance (IB) indicator is a powerful tool designed for traders to identify key support and resistance levels based on the market's initial activity at the start of each week. By analyzing the first 30 hours of trading.
Key Features:
Customizable IB Period: Define the start hour and duration of the initial balance period to suit your trading schedule and the specific market you are analyzing, I have it set at 30 hours by default.
IB High, Low, and Midpoint Levels: Automatically plots the high, low, and midpoint of the IB period, providing immediate visual reference to critical price levels.
Extension Levels: Calculate and display extension levels based on customizable percentages (e.g., 50%, 100%, 150%), allowing you to project potential breakout targets and identify areas of interest beyond the initial balance range.
Dynamic Lines and Labels: The indicator updates in real-time, extending lines and repositioning labels as new bars form, ensuring you always have the most current information.
Customizable Appearance: Adjust line styles, widths, colors, and label positions to match your charting preferences and improve visual clarity.
How to Use:
Set the IB Parameters:
Week Start Hour (UTC): Specify the hour when the weekly IB period begins. I use 1800EST as that is when the futures market opens.
IB Duration in Hours: Define how many hours constitute the IB period.
Configure Extension Levels:
Input the desired extension percentages to calculate levels beyond the IB range.
Customize Visual Settings:
Adjust line colors, styles, widths, and label offsets to tailor the indicator's appearance.
Interpret the Levels:
Use the IB high and low as immediate support and resistance levels.
Monitor the midpoint for potential pivot areas.
Watch for price interactions with extension levels to anticipate breakouts or reversals.
Benefits:
Identify Key Weekly Levels: Understand the market's initial sentiment each week to gauge potential trends.
Enhance Trading Strategies: Incorporate the IB levels into your trading plan for better entry and exit points.
Adaptable to Various Markets: Suitable for Forex, commodities, indices, and other markets where weekly analysis is beneficial.

GG - LevelsThe GG Levels indicator is a tool designed for day trading U.S. equity futures. It highlights key levels intraday, overnight, intermediate-swing levels that are relevant for intraday futures trading.
Terminology
RTH (Regular Trading Hours): Represents the New York session from 09:30 to 17:00 EST.
ON Session (Overnight Session): Represents the trading activity from 17:00 to 09:29 EST.
IB (Initial Balance): The first hour of the New York session, from 09:30 to 10:30 EST.
Open: The opening price of the RTH session.
YH (Yesterday's High): The highest price during the RTH session of the previous day.
YL (Yesterday's Low): The lowest price during the RTH session of the previous day.
YC (Yesterday's Close): The daily bar close which for futures gets updated to settlement.
IBH (Initial Balance High): The highest price during the IB session.
IBL (Initial Balance Low): The lowest price during the IB session.
ONH (Overnight High): The highest price during the ON session.
ONL (Overnight Low): The lowest price during the ON session.
VWAP (Volume-Weighted Average Price): The volume-weighted average price that resets each day.
Why is RTH Important?
Tracking the RTH session is important because often times the overnight session can be filled with "lies". It is thought that because the overnight session is lower volume price can be pushed or "manipulated" to extremes that would not happen during higher volume times.
Why is the ON Session Important Then?
Just because the ON session can be thought as a "lie" doesn't mean it is relevant to know. For example, if price is stuck inside the ON range then you can think of the market as rotational or range-bound. If price is above the ON range then it can be thought of as bullish. If price is below the ON range then it can be thought as bearish.
What is IB?
IB or initial balance is the first hour of the New York Session. Typically the market sets the tone for the day in the first hour. This tone is similarly a map like the ON session. If we are above the IBH then it is bullish and likely a trend day to the upside. If we are below the IBL then it is bearish and likely a trend day to the downside. If we are in IB then we want to avoid conducting business in the middle of IBH and IBL to avoid getting chopped up in a range bound market.
These levels are not a holy grail
You should use this indicator as guide or map for context about the instrument you are trading. You need to combine your own technical analysis with this indicator. You want as much context confirming your trade thesis in order to enter a trade. Simply buying or selling because we are above or below a level is not recommended in any circumstance. If it were that easy I would not publish this indicator.
Adjustments
In the indicator settings you can adjust the RTH, ON, and IB session-time settings. All of the times entered must be in EST (Eastern Standard Time). You may want to do this to apply the levels to a foreign market.
Examples

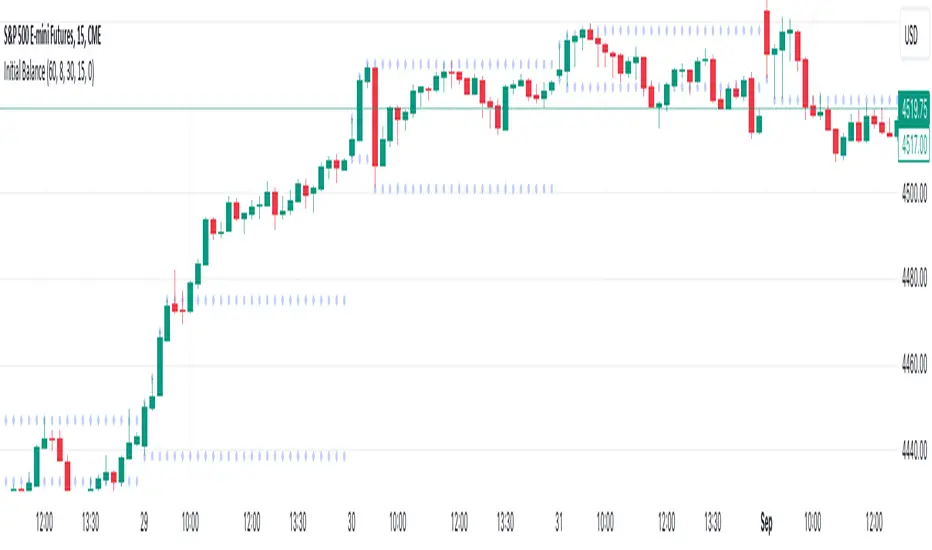
Initial Balance (customizable)Introducing the Initial Balance
Discover precision and clarity in your trading decisions with the Initial Balance. Crafted for traders who seek an edge, this tool pinpoints the range established during the first hour of the trading session, offering a holistic understanding of market sentiments right from the start.
Key Features:
Accurate Visualization: See the initial balance range plotted seamlessly on your chart, providing a transparent view of early market movement.
Customizable Timeframes: Whether you're an early bird catching the first market moves or prefer trading a bit later, set your own start time to fit your trading strategy.
Subtle Aesthetics: With non-intrusive lines and a customizable transparency setting, this indicator integrates smoothly with any chart, ensuring your view remains clear and undistracted.
Adaptable to Any Market: No matter your trading domain - be it stocks, forex, or commodities - this tool adjusts to offer valuable insights.
Why Use the Initial Balance Indicator?
Understanding the initial balance gives a trader the advantage of interpreting the day's potential trend. It's a reflection of early market consensus and serves as a foundation for the day's trading action. By leveraging this, you can better align your strategies with market momentum and improve your trading outcomes.
Add clarity and precision to your trading toolkit. Try the Initial Balance and elevate your trading insights.
RD Opening Range/Initial BalanceIntroducing the RD Opening Range/Initial Balance indicator. The opening range is the first 60 minutes of trading action for a given day (High, Mid, and Low).
The market tends to put significance in these levels, that's why we use them in our trade system.
There is also a data panel:
Today - Today's opening range value
W-Avg - This weeks average
20D CA-OH - the total number of closes above the opening range over the last 20 days (above high)
20D CA-OL - the total number of closes below the opening range over the last 20 days (below low)
* We do plan to add additional data points.
* Only the last OR has labels, we will not be adding them or an option in the future.
* Full customization in setting panel. Color of lines, background, no display of data panel and more.
How to Use
These levels act as dual magnets. They both attract price and repel price.
You use price action and rules to decipher if price is being attracted or repelled.
You will notice as you use this indicator that price respects these levels. Often when answering the 3Qs one of these levels is in play.
During the cash market these levels play a significant role in price action. Even during the Globex/Overnight session these levels are a factor.
Circle areas are examples of price reactions at OR key levels:
If you trade with the RDTS you already know how to use these levels as reaction and target zones.
For clues on which level price is being repelled or attracted I'd suggest you utilize bias and momentum indicators like the RDA.
Initial Balance vs Opening Range
Before we move on and discuss how to use this indicator I want to mention what I consider the difference between the Opening Range and the Initial Balance.
I've adopted the Opening Range verbiage for the first 60 minutes of trading even though the Opening Range is often defined as the first 15m or first 30m.
The more accurate term for the first 60m should be Initial Balance. I'm not sure exactly where this originated but I learned this term when I was heavily trading TPO-- the IB is the first 2 30m blocks of trading.
Any questions or improvements just comment below.
This script was created in by both Bhangerang (an Alpha member of the RDTS) with help by @RexDogActual as well as permission to publish.

Initial Balance |ASE|Introduction
Initial Balance (IB) refers to the price data that is formed during the first hour of a trading session. It is an important concept in trading as it provides insights into the market's opening sentiment and potential trading opportunities or reversals for the day. There are multiple trading sessions throughout the day. The most popular, the NY Session, is open from 9:30 am to 4:00pm EST making the Initial Balance(IB) range the first hour (9:30-10:30) The other sessions include London, Tokyo, and Sydney.
IB Customization
The Initial Balance lines are fully customizable to fit the traders need.
Show Initial Balance
This setting will plot the Initial Balance
Fill/Extend IB Range
The Fill IB Range toggle fills the area in between the IB High and IB Low. Use the IB Fill Color option to change the fill color in the “Line Settings” group on the settings panel.
The Extend IB Range extends the IB lines until the market closes.
Show 1x/2x Extensions
The Show 1x Extension toggle displays 1 times the IB range line (IB High - IB Low) above IB High and 1 times the IB range line below IB Low.
The Show 2x Extension toggle displays the 2 times the IB range line (IB High - IB Low) above IB High and 2 times the IB range line below IB Low.
*Use the Extension Level Color in the “Line Settings” to change the color of the lines.
Show Middle Levels
The Show Middle Levels toggle shows all the 50% lines between the upper 2x and upper 1x line, upper 1x and IB high, IB high and IB low, IB low and lower 1x line, and the lower 1x and lower 2x line.
*Use the Mid Level Color in the “Line Settings” to change the color of the lines.
Delete Previous Day’s Levels
This setting will only show the current day's Initial Balance and delete all previous day levels to produce a clean chart.
How To Use:
The Initial Balance Range can support a bias as it shows the opening market sentiment. By watching price action interact with the Initial Balance Range we can watch for indications of trending or failing moves at the high or the low and overall a ranging or trending session.
The extension levels are projections as to where price could potentially reach in a trending market. If we are bullish and trending higher, we would want to see price reach the first extension, signs of strength at these levels can be used as confirmation to target other levels.
Overall, all these levels can and should be used as support and resistance levels, and as always, can not be used by themselves and require additional confirmation, whether that be an indicator or price action. Below you can see chart examples of these levels in action.
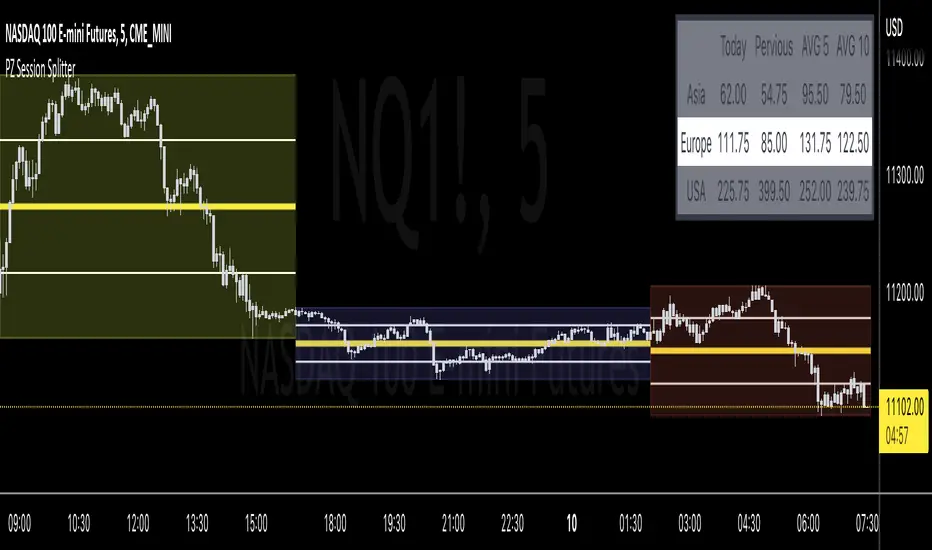
PZ Session SplitterSplit any 24-hour session into 3 segments to determine range statistics and midpoints. Ideal for futures traders to analyze the overnight sessions (Asia and Europe). Also great for splitting the day session into different parts (initial balance, mid-day, closing power-hour). Customize colors and names of sessions along with 50% and 25% midpoints.
RTH Levels Initial Balance Overnight 12-1 Opening types (IB)(ON)Made for ES/NQ.
CME_MINI:ES1!
CME_MINI:NQ1!
But it will most likely work for all USA futures. Default clock settings are set according to CST.
This Indicator automatically draws RTH levels, yesterday’s RTH levels, initial balance, overnight and 12-1 (lunch) levels.
In additionally, at RTH open, it shows opening type.
Also shows/alert works for 12-1 stat.
You may need to change the clock range settings for stocks.
Definitions of opening types.
If price opens the day above the previous day session high, it is considered Higher Outside Range. (HOR)
If price opens the day between the previous close and the previous high, it is considered Higher Inside Range. (HIR)
If price opens between the previous close and previous low, it is Lower Inside Range. (LIR)
If price opens below previous day session low, it is Lower Outside Range. (LOR)
Acronyms:
RTH : Regular Trading Hours
ON : Overnight
IBH : Initial Balance High
IBL : Initial Balance Low
IBMid: Initial Balance Mid
ONH : Overnight High
ONL : Overnight Low
ONMid : Overnight Session Midpoint Price
yRthO : Yesterday's rth open
yRthH : Yesterday's rth high
yRthL : Yesterday's rth low
yRthC : Yesterday's rth close
yRthMid : Yesterday's rth mid
12-1 : Lunch time for Chicago (12pm to 1pm) (CST)
rthmid (for rth session) : (high + low) / 2

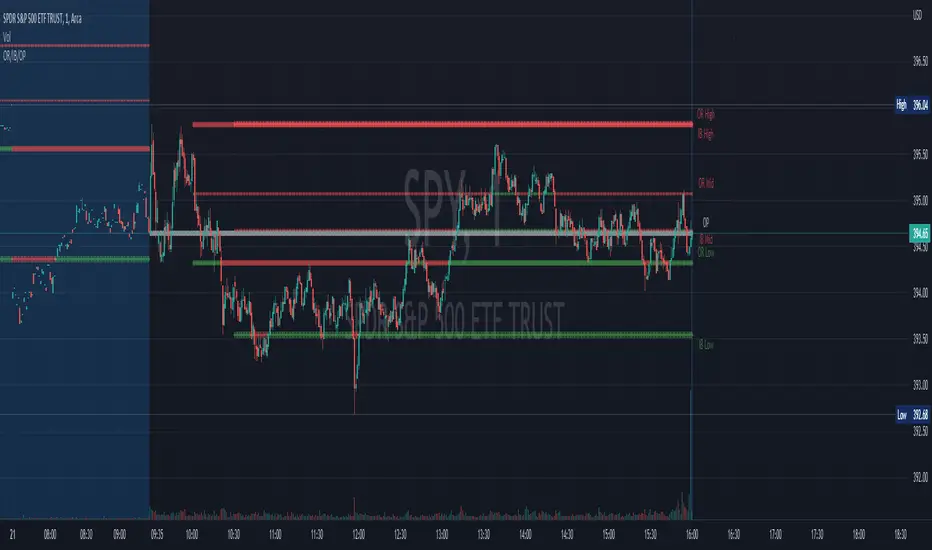
Opening Range, Initial Balance, Opening PriceThis script draws Opening Range, Initial Balance and Opening Price with options to show mid levels.
By default, lines changes color depending on whether closing price is above or below the lines. Red if price is below, green if price is above.
Colors and line styles are all configurable.
Options to change label positions.
Some definitions:
Opening Range - The opening range is high and low for a given period after the market opens. This period is generally the first 30 or 60 minutes of trading
Initial Balance - WRT to TPO profile chart, the Initial Balance is the price range resulting from the market’s trade during the first two 30 minute periods of the regular trading hours session.
Why is this useful?
The first hour of the trading day is the most active and dynamic period. The price range defined by this period of trading creates some key support / resistance levels for the rest of the day. Example below:
BTMM OFJ FOR BEST RESULTS PLEASE SWITCH TO LINE CHART OR DISABLE THE CHART CANDLES. BELOW IS A LINE WITH OPACITY TURNED DOWN TO 15%
ASIA, LONDON, AND NEW YORK SESSIONS CAN BE CUSTOMIZED (1ST 3 HRS DEFAULT)
VOLUME CANDLES CAN BE APPLIED WITH SUPPLY AND DEMAND OR MARKET MAKER METHOD. IN A STRONG TREND YOU WANT TO SEE REPEATED HIGH VOLUME CLUSTERS IN THE DIRECTION OFTHE TREND AND FADING LOW VOLUME ON THE RETRACE
BASICK KEY LEVELS WEEKLY INITIAL BALANCE (MONDAY+TUESDAY HIGHEST HIGH AND LOWEST LOW) YESTERDAY AND LASY WKHI/LO
QUICK APPLICATON
