Rainbow Oscillator The Rainbow Oscillator is a technical indicator that shows prices in overbought or oversold areas. That allows you to catch the price reversal point.
---------------
FEATURES
---------------
.:: Dynamic levels ::.
The indicator levels are divided into several zones, which have a fibonacci ratio. Zones determine the overbought/oversold level. Blue and green level zones are better for buying, red and orange for selling. Dynamic levels are used as replacements for classic levels such as -100 and 100 for the CCI indicator or 30 and 70 for the RSI indicator. Dynamic levels work much better than static levels, as they are more adaptive to the current market situation.
.:: Composite oscillator (3 in 1) ::.
The main signal line of the indicator includes all three oscillators RSI, CCI, Stoch in different ratios. In the settings, you can change the proportions or completely remove one of the oscillators by setting its weight to 0
.:: CCI + RSI + Stoch ratio setting ::.
Each of the oscillators has its own weight in the calculation formula: w2 * cci ( + w1 * ( rsi - 50) + (1 - w2 - w1) * ( stoch - 50), this allows you to create the resulting oscillator from all indicators, depending on the weight of each of them. Each weight value must be between 0 and 1 so that the sum of all weights does not exceed 1.
.:: Smoothing levels and lines of the oscillator ::.
Smoothing the oscillator readings allows you to filter out the noise and get more accurate data. Level offset allows you to customize the support for inputs.
.:: Market Flat ::.
Dynamic creation of levels allows you to find in the price reversal zone, even when the price is in a flat
.:: Sources ::.
You can change the data source for the indicator to the number of longs and shorts for the selected asset. For example, BTCUSDLONGS / BTCUSDSHORTS is perfect for Bitcoin, then the oscillator will work on this data and will not use the quote price.
.:: Trend Detection ::.
The main line of the oscillator has 2 colors - green and red. Red means downtrend, green means uptrend. Trend reversal points are most often found in overbought and oversold zones.
.:: Alerts ::.
Alerts inside for next events: Buy (blue point) Sell (red point) and TrendReversal (change line color)
----------------
TRADING
—-------------
There are several possible entry points for the indicator, let's consider them all.
1) Trend reversal.
Long entry: The indicator line is in the green zone below 0 (oversold), while the line changes color from red (downward) to green (upward)
Short entry: The indicator line is in the red zone above the 0 (overbought) mark, while the line changes color from green to red.
2) Red and blue dots.
Long entry: Blue dot
Short Entry: Red Dot
I prefer to use the first trading method.
----------------
SETTINGS
----------------
.:: Trend Filter (checkbox) ::.
Use trend confirmation for red/blue dots. When enabled, the blue dot requires an uptrend, red dot requires downtrend confirmation before appearing.
.:: Use long/shorts (checkbox) ::.
Change formula to use longs and shorts positions as data source (instead of quote price)
.:: RSI weight / CCI weight / Stoch weight ::.
Weight control coefficients for RSI and CCI indicators, respectively. When you set RSI Weight = 0, equalize the combo of CCI and Stoch , when RSI Weight is zero and CCI Weight is equal to the oscillator value will be plotted
only from Stoch . Intermediate values have a high degree of measurement of each of the three oscillators in percentage terms from 0 to 100. The calculation uses the formula: w2 * cci ( + w1 * ( rsi - 50) + (1 - w2 - w1) * ( stoch - 50),
where w1 is RSI Weight and w2 is CCI Weight, Stoch weight is calculated on the fly as (1 - w2 - w1), so the sum of w1 + w2 should not exceed 1, in this case Stoch will work as opposed to CCI and RSI .
.:: Oscillograph fast and slow periods ::.
The fast period is the period for the moving average used to smooth CCI, RSI and Stoch. The slow period is the same. The fast period must always be less than the slow period.
.:: Oscillograph samples period::.
The period of smoothing the total values of indicators - creates a fast and slow main lines of the oscillator.
.:: Oscillograph samples count::.
How many times smoothing applied to source data.
.:: Oscillator samples type ::.
Smoothing line type e.g. EMA, SMA, RMA …
.:: Level period ::.
Periodically moving averages used to form the levels (zone) of the Rainbow Oscillator indicator
.:: Level offset ::.
Additional setting for shifting levels from zero points. Can be useful for absorbing levels and filtering input signals. The default is 0.
.:: Level redundant ::.
It characterizes the severity of the state at each iteration of the level of the disease. If set to 1 - the levels will not decrease when the oscillator values fall. If it has a value of 0.99 - the levels are reduced by 0.01
each has an oscillator in 1% of cases and is pressed to 0 by more aggressive ones.
.:: Level smooth samples ::.
setting allows you to set the number of strokes per level. Measuring the number of averages with the definition of the type of moving averages
.:: Level MA Type ::.
Type of moving average, average for the formation of a smoothing overbought and oversold zone
Levels

Lepelle's Key LevelsCredit to original code goes to paaax and NSDT. Modified to include premarket H/L levels and to show only daily levels. Indicator includes Close levels.
-US Premarket High and Low Levels
-Daily OHL Levels (No close included)
-Yesterday and Previous day OHLC level
-Labels and ability to modify user preferences (color, line)

Pivot Trend LevelsYou can use this indicator to detect the levels and trend.
I used the highest of the two last highest pivots and the lowest of the two last lowest pivots to calculate "max" and "min" or high level or low level.
I also calculate the average of the 4 values to reach the average line which could be a trend detector in higher lengths.
Default length is 3 but using 10 or 20 as length is really good as trending detector.
I need help to upgrade a trend detector system. please read the script for more information.
Thank you so much.

Cyatophilum Auto Key LevelsThis indicator will automatically plot key horizontal levels.
The script will create a grid from highest to lowest price, dividing this price range into several steps.
It will then loop through each bar and save its cummulative price/volume into each steps.
The steps with the most significant prices/volume are finally plotted into key levels.
═════════════════════════════════════════════════════════════════════════
Settings
• Precision: The number of steps. Increase if you want more precise levels or decrease for bigger areas.
• Lookback: The number of bars from the past used to calculate the levels.
• Strength: The amount of lines to show.
• Use Volume: For volume weighted key levels.

TRADING MADE SIMPLEThis indicator shows market structure. The standard method of using Williams Highs and Lows as pivots, is something of an approximation.
What's original here is that we follow rules to confirm Local Highs and Local Lows, and strictly enforce that a Low can only follow a confirmed High and vice-versa.
-- Highs and Lows
To confirm a candle as a Local High, you need a later candle to Close below its Low. To confirm a Local Low, you need a Close above its High.
A Low can only follow a High (after it's been confirmed). You can't go e.g High, High, Low, Low, only High, Low, High, Low.
When price makes Higher Highs and Higher Lows, market structure is said to be bullish. When price makes Lower Lows and Lower Highs, it's bearish.
I've defined the in-between Highs and Lows as "Ranging", meaning, neutral. They could be trend continuation or reversal.
-- Bullish/Bearish Breaks
A Bullish break in market structure is when the Close of the current candle goes higher than the previous confirmed Local High.
A Bearish Break is when the Close of the current candle goes lower than the most recent confirmed Local Low.
I chose to use Close rather than High to reduce edge case weirdness. The breaking candle often ends up being a big one, thus the close of that candle can be a poor entry.
You can get live warnings by setting the alert to Options: Only Once, because during a candle, the current price is taken as the Close.
Breaks are like early warnings of a change in market bias, because you're not waiting for a High or Low to be formed and confirmed.
Buy The Dip / Sell The Rally
Buy The Dip is a label I gave to the first Higher Low in a bullish market structure. Sell The Rally is the first Lower High in a bearish market structure.
These *might* be good buying/selling opportunities, but you still need to do your own analysis to confirm that.
== USAGE ==
The point of knowing market structure is so you don't make bullish bets in a bearish market and vice versa -
or if you do at least you're aware that that's what you're doing, and hopefully have some overwhelmingly good reason to do so.
These are not signals to be traded on their own. You still need a trade thesis. Use with support & resistance and your other favourite indicators.
Works on any market on any timeframe. Be aware that market structure will be different on different timeframes.
IMPORTANT: If you're not seeing what you expect, check your settings and re-read this entire description carefully. Confirming Highs and Lows can get deceptively complex.

Distance from EMA LevelsDisplay up to 4 distance from EMA levels, by default it's based on the 5m timeframe.

Session Levels - Ultimate Range IndicatorSession Levels - Ultimate Range Indicator
Primarily developed for trading the E-MINI Futures Markets like NQ or ES from the CME Group,
but also more than suitable for Crypto or other instruments.
This indicator highlights the chosen session, which can be Globex, Asian, London and New York.
It plots the important levels and also renders the Opening Range as it forms (a.k.a. Initial Balance).
After the 1st hour Opening Range is finished, it can plot the Standard Deviations / Projections.
See below for a complete feature list.
All Opening Ranges on chart and for the New York session the Range Projections are turned on:
s3.tradingview.com
How to use (example):
If you are trading the Nasdaq Futures (NQ!)
Enable the Globex Overnight session. Basically in the Futures Market, the Globex session is everything outside of US trading hours of Stocks. This draws the important overnight levels, like the Low, 25%, 50%, 75% and the High.
Enable the New York Session with Levels and Opening Range. Generally, 70% of the time the 1st hour will put a Low or High of the day.
If the price is trading above the Globex Low, most likely the Low of the Day is formed and the price target for the day will be 1.5x Standard Deviation and 2x Standard Deviation.
[*} Deviation of the Initial Balance depends on the volume ad overall market structure.
** This is not financial advice or any guarantee **
Features:
Show each Session Highlighted on Intraday chart in it's own color (each session can be turned off and has customizable times and color)
Show Line Levels of each session: Low, 25%, 50%, 75% and the High (customizable color)
Show the Opening Range (Initial Balance) of the Asian, London and New York session. Note: NY has more options.
Opening Range is displayed as a box with level lines (customizable color)
Levels are drawn to the end of the NY Cash session (customizable time)
Show IB Standard Deviations 0.5 - 3.0. Calculated from the Opening Range (Initial Balance)
Option to display Higher Timeframe levels: Previous Day Open/Close and Previous Week Open/Close
All level lines and OR boxes size dynamically as the session progresses
Built in Alerts for when price hits key levels. e.g. Alert when price crosses the NY Opening Range High. Or an Alert when the first STDEV is hit.
Option to toggle display of drawings for Today's trading session only, or Show all recent session levels. This keeps the chart clean or not.
Extras:
The NY Opening Range also has a 50% level line
The NY Opening Bar can be highlighted separately
The Level Lines can have small labels turned on/off. Values are only shown on mouse over to keep a clean chart
Keep in mind:
1) This indicator works on all instruments, but on instruments with limited market hours, your chart setting
has to be set to "Extended Hours" otherwise. For example TSLA on NASDAQ.
2) The Exchange Time Zone for the CME Group is Chicago UTC-6. So the session times you configure in the settings menu are based on that timezone too.
3) Globex opens at 5pm CST and closes when the US session starts 8:30CST.
4) When enabling the Alerts in the Indicator settings, be sure to also create an alarm for this indicator using the Alarm function of Tradingview.

Litt Institutional LevelsThe Litt Institutional Levels Indicator plots previous time periods Highs, Lows, and Closes. Institutions track these levels and will use them as support and resistance to enter and exit their positions. Not every algorithm is a machine-learning wizard. Institutions still use these relatively simple levels to conduct their trades. The best way to use The Litt Institutional Levels Indicator is to find overlapping levels. These areas or lines are called confluence levels and will act as a stronger level than a single line.
For the labeling.
1. Y stands for Yesterday
2. L stands for Last.
3. H stands for High
4. Low stands for Low
5. C stand for Close
For example, LMC would equal Last Months Close.
LQH, would equal Last Quarters High.
YL, would equal Yesterdays Low.")

Percentage Levels by TimeframePlots the positive and negative percentage levels from a selection of timeframes and sources for any ticker. You can use this within a pullback trading system. For example, if you historically look at the average pullback of large cap stocks and ETF's, you can use this indicator to plot the levels it could pullback to for an entry to go long. It can be used as potential targets when trading a ticker short. Another use for this is to backtest the set percentage targets using TradingView's bar replay feature to see how ETF's and large cap stocks have reacted at these levels. Note: This is intended to be used at timeframes equal to higher than the chart's as it may cause re-painting issues.
Currently percentage levels are statically set to 1, 3, 5, 10, 15, 20, 25, and 30% levels above and below the chosen source (open, high, low, close). You can also display the data based on timeframes from Daily (1D) all the way up to Yearly (12M)
*Not financial advice but in my opinion the current percentage levels set (see above) are best used for ETF's and Large Cap Stocks.
Jan 2
Release Notes: Added the ability to select the historical bars to look back when plotting levels
Jan 2
Release Notes: To get a better display or proper resolution on your charts, change the view settings to "Scale Price Chart Only"
Jan 2
Release Notes: To add % labels for this indicator on the price axis, change your chart settings to include "Indicator Name Label" & "Indicator Last Value". You can find this under the Label section after hitting the gear icon in the bottom right of your chart.
Jan 2
Release Notes: Added: Custom Line Plot Extension Settings. Ideally both values should be equal to display optimal extended lines. To return to a base setting: '1' = Historical Lookback & '0' = Offset Lines. Also note this is dependent on the timeframe you are viewing on the chart.
Jan 2
Release Notes: Removed indicator from example chart that was not needed.
Jan 2
Release Notes: Updated some comments in the Pine Script
Jan 2
Release Notes: Update: Added commentary and instructions in the indicator settings to address recommended line plot settings for Stocks/ETF's vs Futures
Jan 2
Release Notes: Changed title from "Calculation Method" to "Calculation Source"
Jan 4 2021
Normal use of security() dictates that it only be used at timeframes equal to or higher than the chart's as it may cause re-painting

Impulse levelsThe indicator detects impulses based on an increase in ATR and volume, and also plots levels based on these impulses.

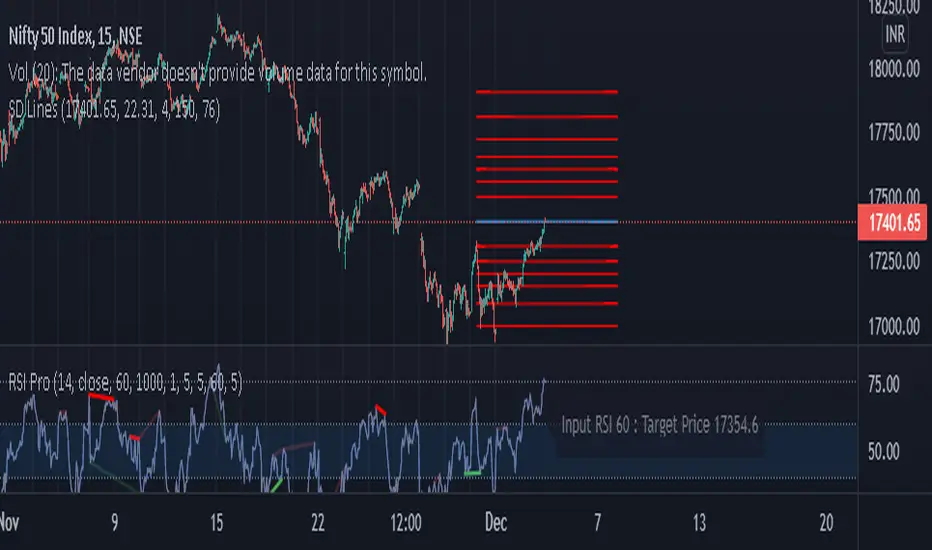
SD Lines for options [Nischay]Annual volatility is found from the NSE website in derivative section, select appropriate annualized volatility for selected instrument.
Nischay Rana
Multi Oscillators Price LevelsThis script draws price levels corresponding to the highest price reached in overbought situations, and the lowest price reached in oversold situations, depending on the oscillator and the timeframe the user has configured.
These levels correspond, most of time, to good supports and resistances prices.
Price levels drawings can be based on the following indicators:
Stochastic RSI (default)
Stochastic CCI
RSI
CCI
You can customize this indicator with the following options:
Source: The candle source to use in indicators calculation
Source Indicator: The indicator on which you cant to base your levels
Timeframe: The timeframe on which you want to apply the selected indicator, and calculate levels
Show supports/resistances: enable/disable price levels, depending on there status (overbought - resistances) / (oversold - supports)
Lines width: width of price levels. (set to 10 by default in order to draw "zones")
Supports/Resistances source: Select the candle data you cant to use to draw supports and resistances levels
Extend levels: Select the line extension for price levels
Levels color: Select the desired color for price levels
And of course , all parameters corresponding to the supported indicators (Stoch, RSI, CCI)
Here are a few examples of different configurations:
This script will probably be modified in the future, don't hesitate to suggest any improvement.

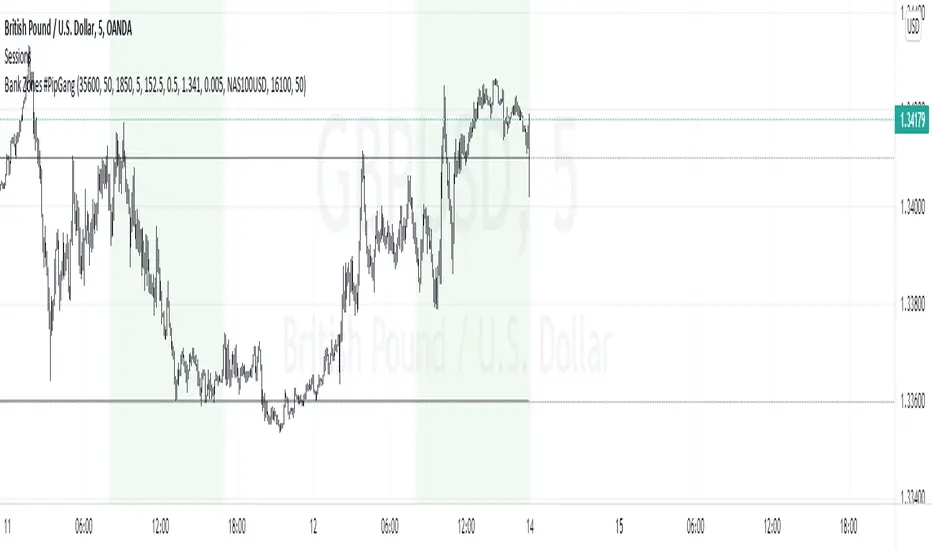
Bank Zones #PipGangHello Traders,
If you trade Forex and Indices this indicator will help you identify Buying and Selling levels that Banks are interested in. These levels are displayed on all time frames. Colors of the lines can be customized.
I also added code to show two EMA's, just uncomment the code to show them. :-)
How to use this indicator.
Show Bank Zones - this will enable/disable horizonal lines on the chart.
Price - enter bank zone price.
Increment By - plots three horizonal lines in pips above and below bank zone price.
Note: Decimal placement is KEY, this may vary by symbol.
Sample Settings:
US30USD
Price 35600.0
IncrementBy 50 (equals 50 pips)
XAUUSD
Price 1850.000
IncrementBy 5 (equals 50 pips)
GBPJPY
Price 152.500
IncrementBy .5 (equals 50 pips)
GBPUSD
Price 1.34100
IncrementBy .005 (equals 50 pips)
No Duplicates Interval Range & EQGenerates Range & EQ levels and removes duplicates. Prioritizes by higher timeframe for duplicates. For example, on Monday's open, weekly open is displayed while daily open is hidden automatically.

[MF] Auto Fibonacci LevelsDescription:
Automatically draw Fibonacci Pivot levels based on the previous (day's, week's or month's)
Range ( High-Low ). The HLC3 is used as the default Pivot level.
Unlike the "Auto Fibonacci Levels", this variation does not update
Levels on current day even if the price goes past the R3/S3 levels.
Timeframes: 1D, 1W, 1M
Range = (High - Low) - From previous Day, Week or month.
FIB LEVELS:
- Yellow = Pivot and Pivot Zone (HLC3 by default)
- red = R1,S1 Levels 0.236 * Range
- Green = R2,S2 Levels 0.368 * Range
- Lime = R3,S3 Levels 0.618 * Range
- Blue = R4,S4 Levels 0.786 * Range
- Gray = R5,S5 Levels 1.000 * Range
- Lime = R6,S6 Levels 1.236 * Range
- Red = R7,S7 Levels 1.382 * Range
- Blue = R8,S8 Levels 1.618 * Range
- Green = R9,S9 Levels 2.000 * Range
CLASSIC LEVELS:
- Yellow = Pivot and Pivot Zone (HLC3)
- Green = R1,S1 Levels (Pivot*2 - Low), (Pivot*2 - High)
- Lime = R2,S2 Levels ( Pivot + Range), ( Pivot - Range)
- Lime = R3,S3 Levels (High + 2*( Pivot - Low)), (Low - 2*(High - Pivot ))
- Blue = R4,S4 Levels (High + 3*( Pivot - Low)), (Low - 3*(High - Pivot ))
Refrences:
- Auto Daily Fib Levels R3.0 by JustUncleL
- Auto Fib by TheYangGuizi
- Monthly Dynamic Range Levels (Fibonaci) V0 by RicardoSantos
Modifications:
- Added next FIB Levels. (changes during the current cycle)
- Added FIB 0.236 Levels
- Added Option to change the colors of the Fib Levels
- Changed Default colors to the colors of Tradingview
- Upgraded to Version4 Pinescript

Volume MA * Fibo levelsIn the scrypt above, the SMA of Volume is taken as a basis and the Fibonacci levels are calculated.
This can be useful for analyzing the trend in accordance with changes in volume.
Any feedback is appreciated!
Good luck with your trading!

Market Sessions Open/Close LevelsThis indicator displays the market open and close price levels for the main trading sessions (Sydney, Tokyo, Frankfurt, London and New York). The Daily Line changes color depending on if price is trading above or below the level. Feel free to add or replace levels depending on your trading style and trading times.

Levels High LowEnglish:
Indicator for quickly identifying support and resistance levels. It is possible to use the parameter of the length of the upper and lower levels. The larger it is, the stronger the levels of the levels. The smaller it is, the less strong the levels are. It is possible to go back and turn off labels and lines. By default, the labels and lines are scale, and the length is 20.
Русский:
Индикатор предназначен для быстрого определения уровней поддержки и сопротивления. Есть возможность изменять параметр длинны верхних уровней и нижних. Чем он больше, тем более сильные уровни отображаются. Чем он меньше, тем менее сильные уровни отображаются. Есть возможность включать и отключать метки и линии. По умолчанию метки и линии отображаются, а длинна равна 20.

High Low Open Mid Ranges & Levels (Multi-Timeframe)This indicator automatically plots the chosen timeframe's high, low, mid point and open. These levels on higher timeframes act as support and resistance levels on lower timeframes, helping find entries, stoploss and profit targets.
Most common timeframes to choose are Daily, 1W, 1M, and 3M. Other timeframes that are good include, 2D, 2W and 2M.
For example, you can see in the snapshot below, we are on the 4hr TF showing those levels from the 2W. This historical 2W zone (open and mid) was (and currently still is) resistance. You can see it also provided a good entry to go short.
This is also useful for intraday scalping. Below, we are on the 15min TF with levels set on the 2D timeframe. You can see how the Open and Mid levels acted as resistance, providing good entries on range trades, with take profit set at the previous 2D low.
There is also a table which tells you all the main TFs high, low, open, and mid levels. They are the most important ones to look out for.
This indicator should not be used in isolation; it is best to pair it up with other TA such as orderblocks, S/D zones, S&R or overlay indicators.

Liquidity Levels [LuxAlgo]The Peak Activity Levels indicator displays support and resistance levels from prices accompanied by significant volume. The indicator includes a histogram returning the frequency of closing prices falling between two parallel levels, each bin shows the number of bullish candles within the levels.
1. Settings
Length: Lookback for the detection of volume peaks.
Number Of Levels: Determines the number of levels to display.
Levels Color Mode: Determines how the levels should be colored. "Relative" will color the levels based on their location relative to the current price. "Random" will apply a random color to each level. "Fixed" will use a single color for each level.
Levels Style: Style of the displayed levels. Styles include solid, dashed, and dotted.
1.1 Histogram
Show Histogram: Determines whether to display the histogram or not.
Histogram Window: Lookback period of the histogram calculation.
Bins Colors: Control the color of the histogram bins.
2. Usage
The indicator can be used to display ready-to-use support and resistance. These are constructed from peaks in volume. When a peak occurs, we take the price where this peak occurred and use it as the value for our level.
If one of the levels was previously tested, we can hypothesize that the level might be used as support/resistance in the future. Additional analysis using volume can be done in order to confirm a potential bounce.
The histogram can return various information to the user. It can show if the price stayed within two levels for a long time and if the price within two levels was mostly made of bullish or bearish candles.
In the chart above, we can see that over the most recent 200 bars (determined by Histogram Window) 68 closing prices fall between levels A and B, with 27 bars being bullish.
Additionally, the width of a bin and its length can sometimes give information about the volatility of a specific price variation. If a bin is very wide but short (a low number of closing prices fallen within the levels) then we can conclude a most of the movement was done on a short amount of time.

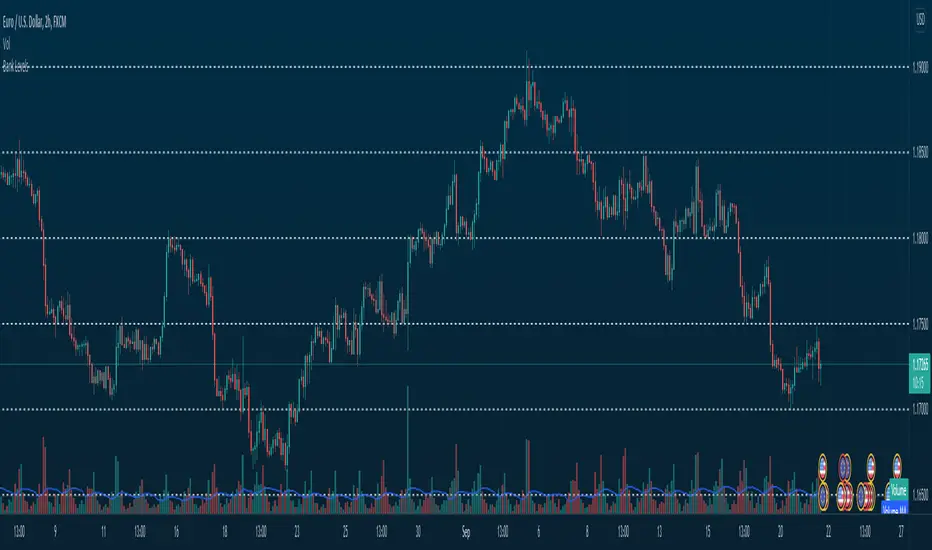
Bank Levels - Psychological Levels - Bitcoin, Indices, ForexThis got removed so I'm publishing it again.
What it is:
- This script draws in levels refereed to as bank levels. They are basically psychological/even numbers(40000, 45000, 150, 1850..)
Why doesn't it work on some charts?
- Each pair has a different tick value. You will have to edit the code to make it work on certain pairs. It's pretty simple, take a look.
CFD Ticks LevelsSimple but very effective script that finds areas of support and resistance through ticks exchange. Only works with CFDs
(You must enter in the settings the value corresponding to the CFD, example: US500 = 500, DAX30 = 30, FRANCE40 = 40 etc ...)
As usual, if you have any suggestions or bug reports don't hesitate.
Cheers

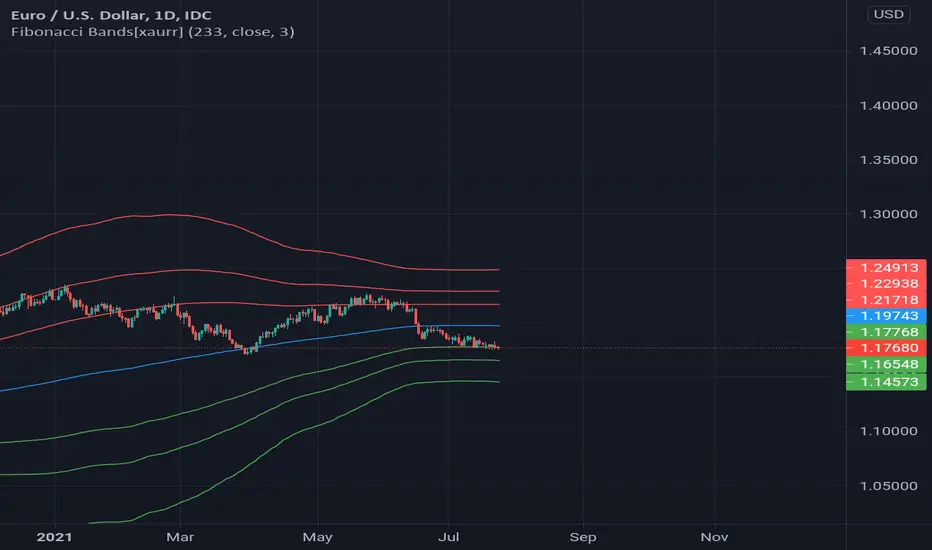
Fibonacci Bands[xaurr]This script draws Fibonacci bands according to std deviation using moving avarage with 233 periods, its the well know fibonacci number for following trend.