Divergence of Market Breadth & Price deduction indicatorHow it begin?
Traders and investors use market breadth in order to assess the index’s overall health. Market breadth can be a reliable, if not an accurate, indicator of an upcoming price rise in the index. Similarly, it can also provide early warning signs for a future price decline.
What is it?
market breadth in this case refer to percentage of stocks above 20 Simple Moving Average,which could be used as a barometer for the market.
How it works?
This paticular indicator compare the divergence of Nasdaq 100 and Russell 2000 percentage of stocks above 20 Simple Moving Average.
This indicator also include a deduction price method ,which is inspired from LEI & LoneCapital
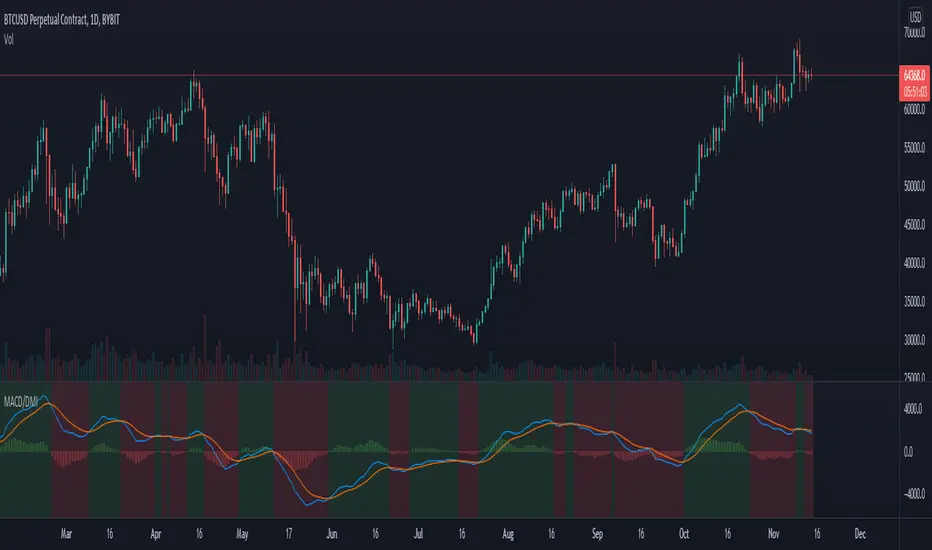
Macd-v

MA MTF Momentum HistogramMy own interpretation indicator which i call multi time frame moving averages momentum with NO LAG EMA support (Optional).
The indicator is calculated by subtracting the long-term EMA from the short-term EMA .
This pretty much resembles the MACD moving averages calculation but without the smoothing of the histogram.
Can also be used to find divergences.
The background shows the main trend with higher time frame which can be set in the settings.
Aimed to use with Higher time frame (Double or more) but can also work with lower time frame.
How to use the indicator?
==Histogram==
Green: Momentum of asset is positive and increasing.
Lighter Green: Momentum of asset is still positive but decreasing and can revert to negative momentum.
Red: Momentum of asset is negative and increasing.
Lighter Red: Momentum of asset is still negative but increasing and revert to positive momentum.
==Background Color - Main Trend==
Green: HTF (Higher time frame) momentum is positive.
RED: HTF momentum is negative.
Feel free to comment and Follow to stay updated with upcoming scripts: www.tradingview.com
NOTE: BARS ARE COLORED BY DEFAULT WITH HISTOGRAM COLORS! (Can be changed in settings)

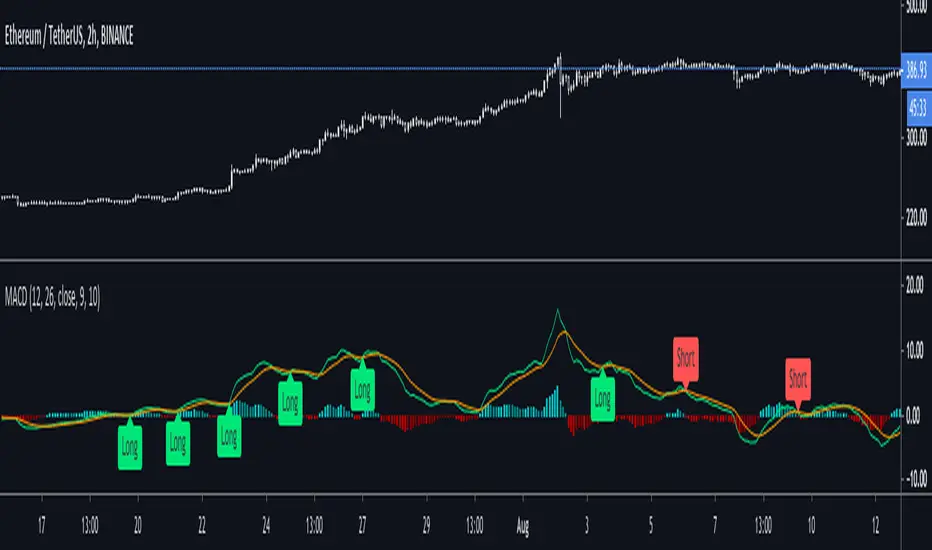
MACD and EMA200 With SignalsThis is my first indicator. It PROVIDES BUY, SHORT, and FALSE Signals by taking the MACD and the 200EMA.

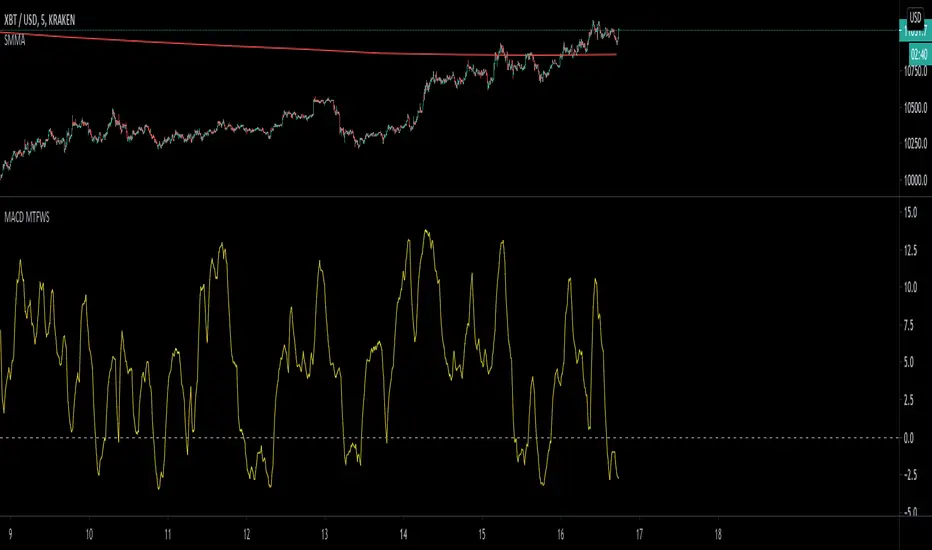
MACD Multiple Time Frames Weighted Momentum Score OscillatorThis script looks at the current momentum direction (up or down) for the 5 minute, 30 minute, 1 hour, 4 hour and daily and allows you to set scores of importance to these.
These scores are then added up to create an oscillator matching your preferences. Tune the indicator to match what you believe is the most important time frames that people use and score it accordingly. The values I put by default are just for demonstration.
For example, (and if you want to test to verify it's working), set the scores to 0 for everything except for the daily). Look at the daily macD by adding it as an indicator and set a score. Whenever the macD is trending up it will add the appropriate value to the score and likewise remove it when it's not.
Enjoy!
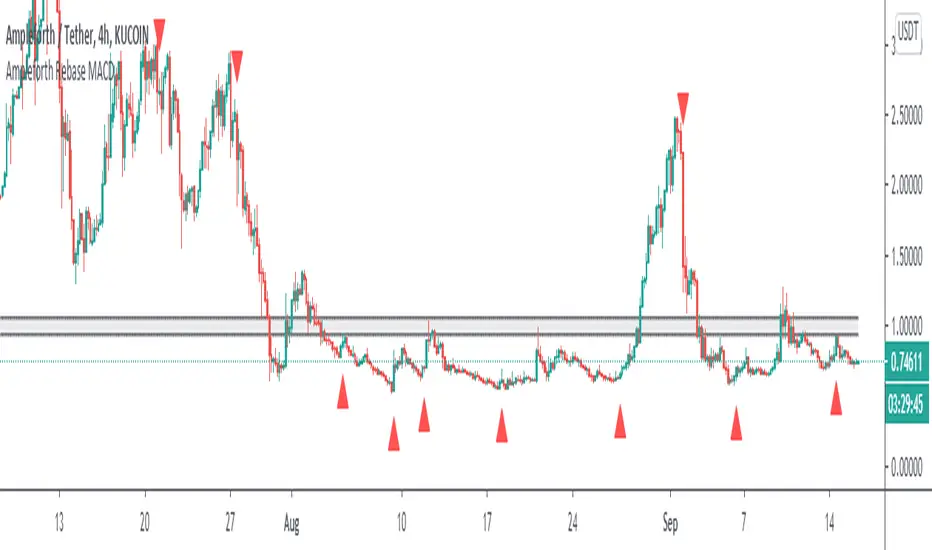
Ampleforth Rebase MACDThis script reveals Ampleforth rebase levels which are going to always work. In addition to that is MACD crossovers serving as potential buy/sell entries. You can set alerts for MACD crossovers and price entering balanced value area (0.96 - 1.06).
MACD signals can be used to automatically open a position and entering a balanced value area can be used as take-profit. Since the price will always move to this level, using this strategy without leverage should be profitable.
Ampleforth seems like a nice asset to trade since it is unlikely to correlate with anything else. At least not when it gets to the extreme levels.

MACD Indicator [SystemAlpha]This is a MACD indicator enhanced with:
- Show MACD and Signal Only or Histogram Only or Both
- Show Buy and Sell Alert - MACD Cross
- Show Bar Color
- Show Regular and Hidden divergence
- Show Divergence Labels
- Generate Alerts: Buy/Sell and Divergence

MACD-X, More Than MACD by DGTMoving Average Convergence Divergence – MACD
The most popular indicator used in technical analysis, the moving average convergence divergence (MACD), created by Gerald Appel. MACD is a trend-following momentum indicator, designed to reveal changes in the strength, direction, momentum, and duration of a trend in a financial instrument’s price
Historical evolution of MACD,
- Gerald Appel created the MACD line,
- Thomas Aspray added the histogram feature to MACD
- Giorgos E. Siligardos created a leader of MACD
MACD employs two Moving Averages of varying lengths (which are lagging indicators) to identify trend direction and duration. Then, MACD takes the difference in values between those two Moving Averages (MACD Line) and an EMA of those Moving Averages (Signal Line) and plots that difference between the two lines as a histogram which oscillates above and below a center Zero Line. The histogram is used as a good indication of a security's momentum.
Mathematically expressed as;
macd = ma(source, fast_length) – ma(source, slow_length)
signal = ma(macd, signal_length)
histogram = macd – signal
where exponential moving average (ema) is in common use as a moving average (ma)
fast_length = 12
slow_length = 26
signal_length = 9
The MACD indicator is typically good for identifying three types of basic signals ;
Signal Line Crossovers
A Signal Line Crossover is the most common signal produced by the MACD. On the occasions where the MACD Line crosses above or below the Signal Line, that can signify a potentially strong move. The standard interpretation of such an event is a recommendation to buy if the MACD line crosses up through the Signal Line (a "bullish" crossover), or to sell if it crosses down through the Signal Line (a "bearish" crossover). These events are taken as indications that the trend in the financial instrument is about to accelerate in the direction of the crossover.
Zero Line Crossovers
Zero Line Crossovers occur when the MACD Line crossed the Zero Line and either becomes positive (above 0) or negative (below 0). A change from positive to negative MACD is interpreted as "bearish", and from negative to positive as "bullish". Zero crossovers provide evidence of a change in the direction of a trend but less confirmation of its momentum than a signal line crossover
Divergence
Divergence is another signal created by the MACD. Simply, divergence occurs when the MACD and actual price are not in agreement. A "positive divergence" or "bullish divergence" occurs when the price makes a new low but the MACD does not confirm with a new low of its own. A "negative divergence" or "bearish divergence" occurs when the price makes a new high but the MACD does not confirm with a new high of its own. A divergence with respect to price may occur on the MACD line and/or the MACD Histogram
Moving Average Crossovers , another hidden signal that MACD Indicator identifies
Many traders will watch for a short-term moving average to cross above a longer-term moving average and use this to signal increasing upward momentum. This bullish crossover suggests that the price has recently been rising at a faster rate than it has in the past, so it is a common technical buy sign. Conversely, a short-term moving average crossing below a longer-term average is used to illustrate that the asset's price has been moving downward at a faster rate and that it may be a good time to sell.
Moving Average Crossovers in reality is Zero Line Crossovers, the value of the MACD indicator is equal to zero each time the two moving averages cross over each other. For easy interpretation by trades, Zero Line Crossovers are simply described as positive or negative MACD
False signals
Like any forecasting algorithm, the MACD can generate false signals. A false positive, for example, would be a bullish crossover followed by a sudden decline in a financial instrument. A false negative would be a situation where there is bearish crossover, yet the financial instrument accelerated suddenly upwards
What is “MACD-X” and Why it is “More Than MACD”
In its simples form, MACD-X implements variety of different calculation techniques applied to obtain MACD Line, ability to use of variety of different sources , including Volume related sources, and can be plotted along with MACD in the same window and all those features are available and presented within a single indicator, MACD-X
Different calculation techniques lead to different values for MACD Line, as will further discuss below, and as a consequence the signal line and the histogram values will differentiate accordingly. Mathematical calculation of both signal line and the histogram remain the same.
Main features of MACD-X ;
1- Introduces different proven techniques applied on MACD calculation , such as MACD-Histogram, MACD-Leader and MACD-Source, besides the traditional MACD (MACD-TRADITIONAL)
• MACD-Traditional , by Gerald Appel
It is the MACD that we know, stated as traditional just to avoid confusion with other techniques used with this study
• MACD-Histogram , by Thomas Aspray
The MACD-Histogram measures the distance between MACD and its signal line (the 9-day EMA of MACD). Aspray developed the MACD-Histogram to anticipate signal line crossovers in MACD. Because MACD uses moving averages and moving averages lag price, signal line crossovers can come late and affect the reward-to-risk ratio of a trade. Bullish or bearish divergences in the MACD-Histogram can alert chartists to an imminent signal line crossover in MACD
The MACD-Histogram represents the difference between MACD and its 9-day EMA, the signal line. Mathematically,
macdx = macd - ma(macd, signal_length)
Aspray's contribution served as a way to anticipate (and therefore cut down on lag) possible MACD crossovers which are a fundamental part of the indicator.
Here come a question, what if repeat the same calculations once more (macdh2 = macdh - ma(macdh, signal_length), will it be even better, this question will remain to be tested
• MACD-Leader , by Giorgos E. Siligardos, PhD
MACD Leader has the ability to lead MACD at critical situations. Almost all smoothing methods encounter in technical analysis are based on a relative-weighted sum of past prices, and the Leader is no exception. The concealed weights of MACD Leader are such that more relative weight is used in the more recent prices than the respective weights used by the components of MACD. In effect, the Leader expresses more changes in average price dynamics for the recent price movement than MACD, thus eventually leading MACD, especially when significant trend changes are about to take place.
Siligardos creates two less-laggard moving averages indicators in its formula using the same periods as follows
Indicator1 = ma(source, fast_length) + ma(source - ma(source, fast_length), fast_length)
Indicator2 = ma(source, slow_length) + ma(source - ma(source, slow_length), slow_length)
and then take the difference:
Indicator1 - Indicator2
The result is a new MACD Leader indicator
macdx = macd + ma(source - fast_ma, fast_length) - ma(source - slow_ma, slow_length)
• MACD-Source , a custom experimental interpretation of mine ,
MACD Source, presents an application of MACD that evaluates Source/MA Ratio, relatively with less lag, as a basis for MACD Line, also can be expressed as source convergence/divergence to its moving average. Among the various techniques for removing the lag between price and moving average (MA) of the price, one in particular stands out: the addition to the moving average of a portion of the difference between the price and MA. MACD Source, is based on signal length mean of the difference between Source and average value of shot length and long length moving average of the source (Source/MA Ratio), where the source is actual value and hence no lag and relatively less lag with the average value of moving average of the source . Mathematically expressed as,
macdx = ma(source - avg( ma(source, fast_length), ma(source, slow_length) ), signal_length)
MACD Source provides relatively early crossovers comparing to MACD and better momentum direction indications, assuming the lengths are set to same values
For further details, you are invited to check the following two studies, where the first seeds were sown of the MACD-Source idea
Price Distance to its Moving Averages study, adapts the idea of “Prices high above the moving average (MA) or low below it are likely to be remedied in the future by a reverse price movement", presented in an article by Denis Alajbeg, Zoran Bubas and Dina Vasic published in International Journal of Economics, Commerce and Management
First MACD like interpretation comes with the second study named as “ P-MACD ”, where P stands for price, P-MACD study attempts to display relationship between Price and its 20 and 200-period moving average. Calculations with P-MACD were based on price distance (convergence/divergence) to its 200-period moving average, and moving average convergence/divergence of 20-period moving average to 200-period moving average of price.
Now as explained above, MACD Source is a one adapted with traditional MACD, where Source stands for Price, Volume Indicator etc, any source applicable with MACD concept
2- Allows usage of variety of different sources, including Volume related indicators
The most common usage of Source for MACD calculation is close value of the financial instruments price. As an experimental approach, this study will allow source to be selected as one of the following series;
• Current Close Price (close)
• Average of High, Low, and Close Price (hlc3)
• On Balance Volume (obv)
• Accumulation Distribution (accdist)
• Price Volume Trend (pvt)
Where,
-Current Close Price and Average of High, Low, and Close Price are price actions of the financial instrument
- Accumulation Distribution is a volume based indicator designed to measure underlying supply and demand
- On Balance Volume (OBV) , is a momentum indicator that measures positive and negative volume flow
- Price Volume Trend (PVT) is a momentum based indicator used to measure money flow
3- Can be plotted along with MACD in the same window using the same scaling
Default setting of MACD-X will display MACD-Source with Current Close Price as a source and traditional MACD can be plotted eighter as a companion of MACD-X or can be selected to be plotted alone.
Applying both will add ability to compare, or use as a confirmation of one other
In case, traditional MACD Is plotted along with MACD-X to avoid misinterpreting, the lines plotted, the area between MACD-X Line and Signal-X Line is highlighted automatically, even if the highlight option not selected. Otherwise highlight will be applied only if that option selected
4- 4C Histogram
Histogram is plotted with four colors to emphasize the momentum and direction
5- Customizable
Additional to ability of selecting Calculation Method, Source, plotting along with MACD, there are few other option that allows users to customize the MACD-X indicator
Lengths are configurable, default values are set as 12, 26, 9 respectively for fast, slow and smoothing length. Setting lengths to 8,21,5 respectively Is worth checking, slower length moving averages will lead to less lag and earlier reaction to price actions but yet requires a caution and back testing before applying
Highlight the area between MACD-X Line and Signal-X Line, with colors emphasising the direction
Label can be added to display Calculation Method, Source and Length settings, the aim of this label is to server only as a reminder to trades to be aware of settings while they are occupied with charts, analysis etc.
Here comes another question, which is of more importance having the reminder or having the indicators with multi timeframe feature? Build-in Multi Time Frame features of Pine is not supported when labels and lines introduced in the script, there are other methods but brings complexity. To be studied further, this version will be with labels for time being.
Epilogue
MACD-X is an alternative variant of MACD, the insight/signals provided by MACD are also applicable to MACD-X with early and clear warnings for the changes in the trend.
If MACD is essential to your analysis, then it is my guess that after using the MACD-X for a while and familiarizing yourself with its unique character and personality, you will make it an inseparable companion to other indicators in your charts.
The various signals generated by MACD/MACD-X are easily interpreted and very few indicators in technical analysis have proved to be more reliable than the MACD, and this relatively simple indicator can quickly be incorporated into any short-term trading strategy
Disclaimer : Trading success is all about following your trading strategy and the indicators should fit within your trading strategy, and not to be traded upon solely
The script is for informational and educational purposes only. Use of the script does not constitutes professional and/or financial advice. You alone the sole responsibility of evaluating the script output and risks associated with the use of the script. In exchange for using the script, you agree not to hold dgtrd TradingView user liable for any possible claim for damages arising from any decision you make based on use of the script

[SCL] MACD DoubleCrossCounts crosses of the MACD and signal lines and derives entry signals. The code for counting the crosses, for deciding what counts as "close enough", and for auto-adjusting for resolutions 1D or longer, might be useful for Pinescripters. The entries and exits themselves are not intended to be used on their own, but could be used as confluence within a trading system. Full explanation is in the script introduction.
MACD VWAP IndicatorThis indicator uses a combination of the VWAP, EMA 9 and parts of the MACD in order to detect a bullish or bearish trend.
How to trade it:
Set SL either below or above the VWAP line (orange) and TP to 1:1.5 ratio (depending on last few candles, of course).
If EMA200 is close by then place SL either below or above EMA200 (blue) and TP to 1:1.5 ratio
Important:
Best traded in 15M, 30M => Intraday.
Have fun! :)

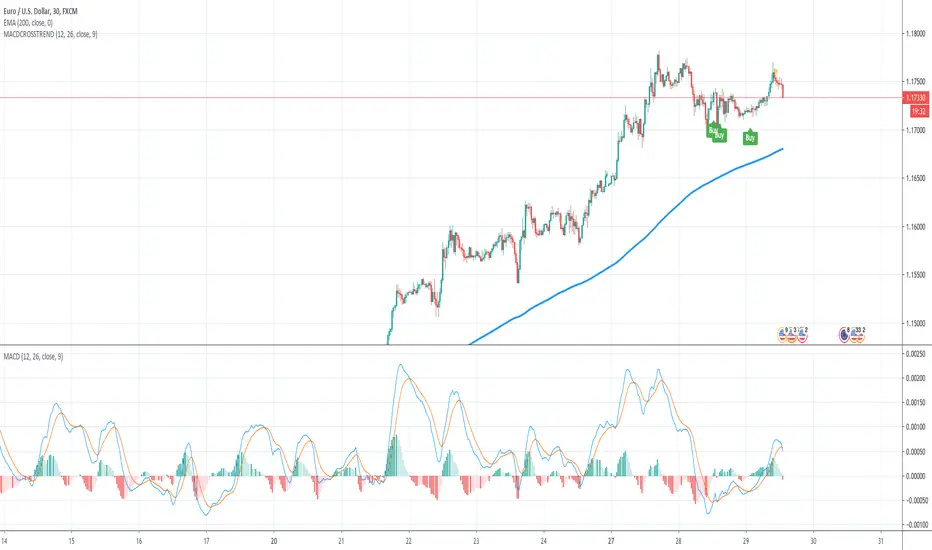
MACD Crossover Trend IndicatorThis is a very simple " the trend is your friend " indicator - if you are consistent!
How this indicator works:
This indicator detects MACD Crossovers based on the current trend. It checks wether the current close price is above or below the 200 EMA and therefore decides whether we are in an up- or down trend.
UP-TREND: If the price is above the EMA200, the MACD is below 0 and crosses up the signal line, then this is a BUY signal!
DOWN-TREND: If the price is below the EMA200, MACD is above 0 and crosses down the signal line, then this is a SELL signal!
You can also add an alert, that keeps you informed, once one of these scenario happens for a certain pair!
With this indicator you will never enter against the trend.
Have fun! :)

MACD Crossover Trend IndicatorHow this indicator works:
This indicator detects MACD Crossovers based on the current trend. It checks wether the current close price is above or below the 200 EMA and therefore decides whether we are in an up- or down trend.
UP-TREND: If the MACD is below 0 and crosses up the signal line, then this is a BUY signal!
DOWN-TREND: If the MACD is above 0 and crosses down the signal line, then this is a SELL signal!
How to trade this:
First rule: Be consistent!
Second rule: You will have lost trades and losing streaks - deal with it!
First set the SL slightly below the last significant low (eventually add/subtract the ATR value to/from it)
Then adjust the TP and ALWAYS use a RR ratio of 1.5.
NEVER get out of the trade earlier
Take every possible trade!
Important: Money management is key... so be consistent!
Have fun! :)
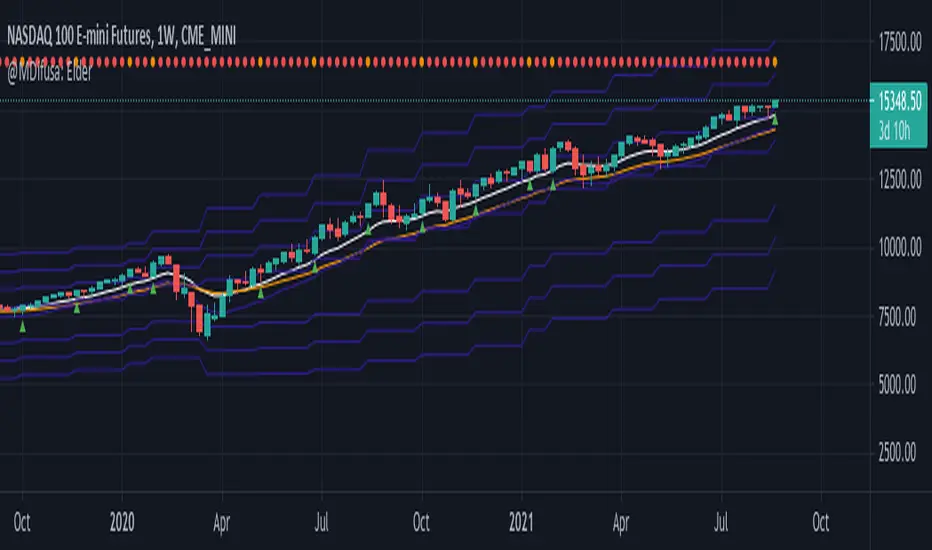
Elder-Keltner-Impulse-MA Study by STTAStudy Name: Elder-Keltner-Impulse-MA Study by STTA
English:
This indicator shows in a combined way three Keltner Channels with EMA21 and multiplier 1,3,5, the Elder Impulse System and a short EMA 11 to recognize the valuation zone, according to various strategies of Dr. Alexander Elder.
This indicator can be applied on all symbols.
Inputs: displayed symbol
Settings:
Elder Force Index (EFI)
-EIF MACD Length
-EIF MACD Slow Length
-EIF MACD Signal Length
-EIF EMA Length
EMA Short Length
Keltner Channels (KC)
-KC MA Length
-KC Multiplier1-3
-KC Source
-KC Type
-KC Bands Style
Outputs:
-EIF Bar Colors
-KC Upper1-3 channel upper and lower Lines
-MA Short

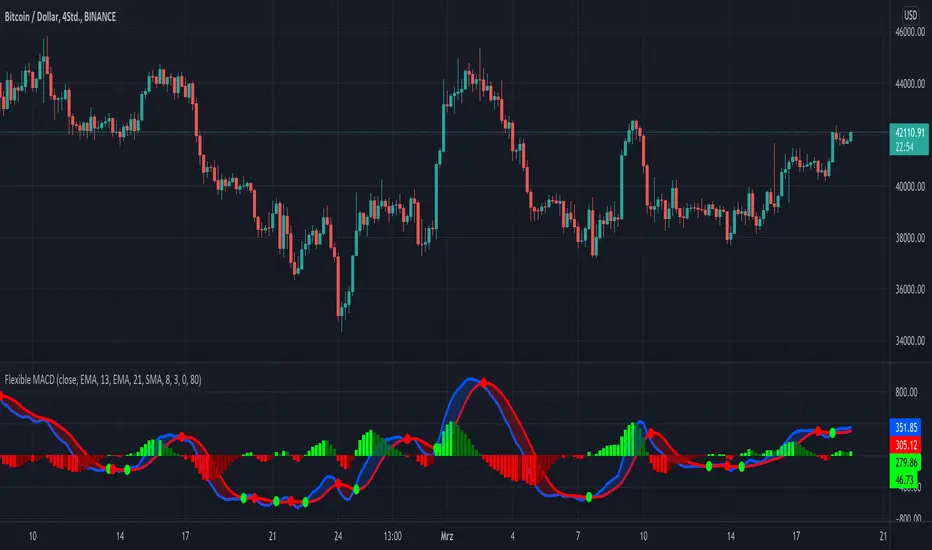
KINSKI Flexible MACDFlexible MACD (Moving Average Convergence/Divergence) Indicator
The Moving Average Convergence Divergence consists of three elements: two moving averages (the MACD line and the signal line) and a histogram. The blue MACD line is the difference between a longer and a shorter EMA (here 13 and 21 periods preset), the red signal line is an SMA (here 8 preset) on the MACD line. The histogram (green: ascending, red: descending) shows the difference between both lines.
As soon as the blue MACD line crosses the red signal line, circles are generated that indicate an up/down trend. If the red signal line is greater than or equal to the blue MACD line, this indicates a downward trend (red circle). If the blue MACD line is greater than or equal to the red signal line, this indicates an upward trend (green circle).
The special thing about this MACD indicator is the many setting options, especially the definition of the MA variants for MACD (Fast, Slow) and signal. You can define the following MA types: "COVWMA", "DEMA", "EMA", "EHMA", "FRAMA", "HMA", "KAMA", "RMA", "SMA", "SMMA", "VIDYA", "VWMA", "WMA".
You also have the following display options:
- "Up/Down Movements: On/Off" - Shows ascending and descending MACD, signal lines
- "Up/Down Movements: Rising Length" - Defines the length from which ascending or descending lines are detected
- "Bands: On/Off" - Fills the space between MACD and signal lines with colors to indicate up or down trends
- "Bands: Transparency" - sets the transparency of the fill color
Disclaimer: I am not a financial advisor. For purpose educate only. Use at your own risk.
Elder EMA, ATR & MACD Indicator, 5X Time Frame & Divergences.This indicator is elaborated following the 3 window strategy described by Elder.
The fast, slow averages and MACD histogram are taken from a time frame 5 times higher than the active time frame and indicate bullish / bearish trends as well as divergences (bottom) of the hostogram with the price.
ALT_FLAMES00.00 - alt-flames
component breakdown:
a) various combinations of EMA crossovers taken from the primeval_series to create a complete sequence of background colored-lines that subdivide into a bullish portion
and a bearish portion for directional identification
b) specific macd crossovers for predictive power in the form of directional flames located directly above the chart price (navy & yellow flames)
c) unique fast & slow rsi combinations for momentum + strength in the form of power flames located directly above the chart price (orange, red, green, & lime flames)
when the alternation of flames are used in concert with the sequence of background colors, one can identify impending explosive price action, can better navigate through periods of slower activity, identify where they are currently in the trend's lifecycle and, MOST IMPORTANTLY, improve the TIMELINESS of entry and exit strategies
00.01 - primeval_series - overview
the primeval_series is a group of transformed universally-renowned mathematical constants that have been transformed and embedded into a series of EMAs
each of these EMAs relates in some meaningful way to the "original wave' or 'wave_0': i.e. the wave that began at t=0, when humanity first made technological progress
the transformations made ensure that the inherent linkages to the original wave remain intact while being applicable to the structures inherent to indicator development
for the purposes of the alt-flames indicator, certain numbers selected from the primeval_series exist and are the basis of each ema , MACD and RSI calculation made herein
00.02 - alt-flames - best practices, and ideal targets
for best use: start with the daily timeframe for broad pattern, then use hourly going forward
ideal for swing trades, shorter-term options, and stocks that already have well-established uptrends, but have also started consolidating for 1+ week
patience is required to catch the ideal break, so best to use mildly OTM calls with at least 2 weeks on them before expiry.
for great use: pick out stocks that have recently broken out heavily from their pivot . Do not enter until the retracement from the top has a defined local low
for average use: any sort of intraday play. this tool is meant for swing trades and sustained breakouts. picking out significant bottom reversals.
the MACD portion is not geared for big reversals here. Rather, it is complementary to the EMA sequences, which are at the core of the indicator
not useful for: shorting stocks that are trending downward or that are in sideways trends

MACD minutesIt´s a multiple (3) Moving Average Convergence Divergence (MACD) indexes.
It was created to help traders to identify trend changes in multilple time frames, in the same graph.

P-MACD by DGTPrice and Moving Averages Convergence/Divergence, shortly named as P-MACD
P-MACD is a trend-following momentum indicator that shows the relationship between Price and Long-term Moving Average (PMACD), and the relationship between two Moving Averages (MAMACD). P-MACD is composed of two lines, and an histogram, showing price distance (convergence/divergence) to its Long-term MA (PMACD), showing short-term MA distance (convergence/divergence) to long-term MA (MAMACD), and a histogram showing the difference (momentum) between the PMACD and MAMACD
The PMACD is calculated by dividing the Price to Long-term Moving Average (200-period SMA/EMA) and finally smoothed with 9-period SMA/EMA
- PMACD Line Formula : (Price / SlowMovingAverage -1) * 100 and smoothed with 9-period SMA/EMA
The MAMACD is calculated by dividing the Short-term Moving Average (such as 20 SMA/EMA) to the Long-term Moving Average (such as 200-period SMA/EMA)
- MAMACD Line Formula : (FastMovingAverage / SlowMovingAverage -1) * 100
The Histogram is calculated by subscripting PMACD and MAMACD
- Formula : PMACD - MAMACD
Optional
Trend Cloud calculated based on fast and slow version of MAMACD
What to look for:
- Line Crosses : PMACD Line can function as a trigger(signal) for buy and sell signals. Buy when the PMACD crosses above the MAMACD line and sell - or short - when the PMACD crosses below the MAMACD line
- Base Crosses : PMACD and/or MAMACD crosses above or below Baseline is another way to indicate the trend and momentum. MAMACD crosses of Baseline, MAMACD positive or negative, reflects short-term moving average crosses the long-term moving average and similarly, PMACD crosses of BaseLine, PMACD positive or negative, reflects price crosses a long-term moving average
- Momentum : P-MACD helps investors understand whether the bullish or bearish movement in the price is strengthening or weakening displayed with a histogram which graphs the distance between the PMACD and MAMACD. Additionally, upward momentum is confirmed with a bullish crossover, which occurs when PMACD and/or MAMACD crosses above Baseline. Conversely, downward momentum is confirmed with a bearish crossover, which occurs when PMACD and/or MAMACD crosses below Baseline
- Distance : Prices high above the moving average (MA) or low below it are likely to be remedied in the future by a reverse price movement. The more distant the PMACD is above or below its baseline indicates that the distance between the Price and its SMA is growing (regarding PMACD, You may find a detailed article explained in “Price Distance to its MA” indicator by DGT) . Similarly the more distant the MAMACD is above or below its baseline indicates that the distance between the two SMAs is growing
- Trend : A rising P-MACD indicates an uptrend, while a declining P-MACD indicates a downtrend
MACD vs. P-MACD
MACD measures the relationship between two MAs, while the P-MACD measures both the relationship between price and its MA, and the relationship between two MAs. MAMACD Line of P-MACD If set to same moving average type and same lengths as in MACD will produce the same line as MACD line, only values are represented as percentage with MAMACD. Both measure momentum in a market, but, because they measure different factors, they differentiate from each other even if they have similarities in presentation. P-MACD provides additional insights, not only to MA relation but also to Price and MA relation
Warning : Moving Average are calculated based on past prices, so they are lagging. The longer the time period for the moving average, the greater the lag as well as less sensitive to price changes. This study implements usage of 200-period long-term moving average, which implies that the P-MACD will provide insight especially for long-term trades, more suited for long-term trades, usage of P-MACD for short-term trades is recommend with lower timeframes (1H or lower).
Indicators aim to generate a potential signal/indication of an upcoming opportunity, but, the Indicators themselves do not guarantee the future movement of a given financial instrument, and are most useful when used in combination with other techniques.
Trading success is all about following your trading strategy and the indicators should fit within your trading strategy, and not to be traded upon solely
Disclaimer : The script is for informational and educational purposes only. Use of the script does not constitutes professional and/or financial advice. You alone the sole responsibility of evaluating the script output and risks associated with the use of the script. In exchange for using the script, you agree not to hold dgtrd tradingview user liable for any possible claim for damages arising from any decision you make based on use of the script

Price Distance to its MA by DGTPrices high above the moving average (MA) or low below it are likely to be remedied in the future by a reverse price movement as stated in an Article by Denis Alajbeg, Zoran Bubas and Dina Vasic published in International Journal of Economics, Commerce and Management
Here comes a study to indicate the idea of this article, Price Distance to its Moving Averages (P/MA Ratio)
The analysis expressed in the paper indicates that there is a connection between the distance of the prices to moving averages and subsequent returns : portfolios of stocks with lower prices to moving averages generally outperformed portfolios of stocks with higher prices to moving averages. This “overextended” effect is more pronounced when using shorter moving averages of 20 and 50 days, and is especially strong in short-term holding periods like one and two weeks. The highest annual returns are recorded when buying in the range of 0-5% below shorter moving averages of 20/50 days, and 0-10% below longer moving averages of 100/200 days. However, buying very far below almost all moving averages on almost all holding periods produces the lowest returns.
The concept of this study recognizes three different modes of action.
In a clearly established upward trend traders should be buying when prices are near or below the MA line and selling when prices move too far above the MA.
Conversely, in downward trend stocks should be shorted when reaching or going above the moving average and covered when they drop too far below the MA line.
In a sideways movement traders are advised to buy if the price is too low below the moving average and sell when it goes too far above it
Short-term traders can expect to outperform in a one or two week time window if buying stocks with lower prices compared to their 20 and 50 SMA/EMA, one to two-week holding periods is quite high, ranging from 72,09% to 90,61% for the SMA(20, 50) and 85,03% to 87,5% for the EMA(20, 50). The best results for the SMA 20 and 50, on average, are concentrated in the region of 0-5% below the MA for the majority of holding periods. Buying very far below almost all MA in almost all holding periods turns out to be the worst possible option
Candle patterns, momentum could be used in conjunction with this indicator for better results. Try Colored DMI and Ichimoku colored SuperTrend by DGT

MACD with BGThis is a standard MACD indicator with Background colour and the option to draw the Background colour of the next higher timeframe.
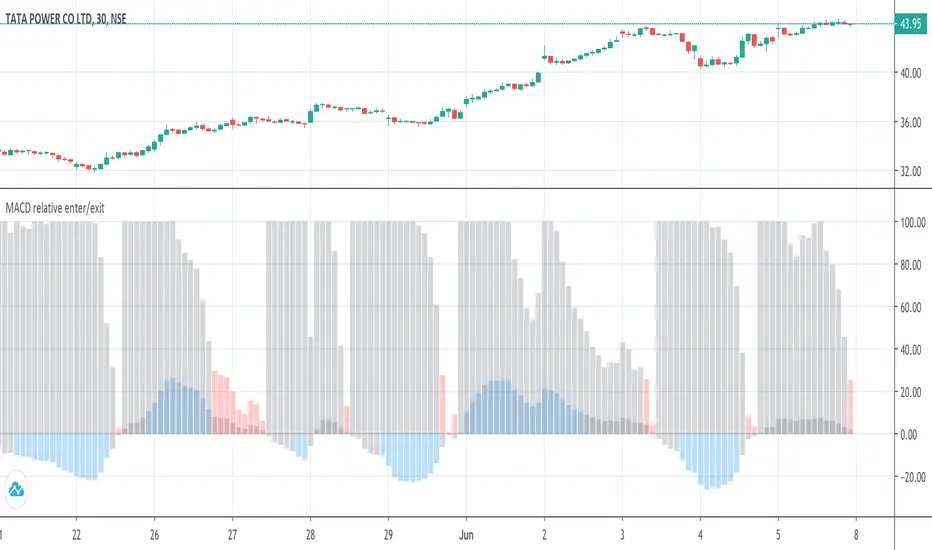
MACD histogram relative open/closePrelude
This script makes it easy to capture MACD Histogram open/close for automated trading.
There seems to be no "magic" value for MACD Histogram that always works as a cut-off for trade entry/exit, because of the variation in market price over time.
The idea behind this script is to replicate the view of the MACD graph we (humans) see on the screen, in mathematics, so the computer can approximately detect when the curve is opening/closing.
Math
The maths for this is composed of 2 sections -
1. Entry -
i. To trigger entry, we normalize the Histogram value by first determining the lowest and highest values on the MACD curves (MACD, Signal & Hist).
ii. The lowest and highest values are taken over the "Frame of reference" which is a hyperparameter.
iii. Once the frame of reference is determined, the entry cutoff param can be defined with respect to the values from (i) (10% by default)
2. Exit
To trigger an exit, a trader searches for the point where the Histogram starts to drop "steeply".
To convert the notion of "steep" into mathematics -
i. Take the max histogram value reached since last MACD curve flip
ii. Define the cutoff with reference to the value from (i) (30% by default)
Plots
Gray - Dead region
Blue - Histogram opening
Red - Histogram is closing
Notes
A good value for the frame of reference can be estimated by looking at the timescale of the graph you generally work with during manual trading.
For me, that turned out to be ~2.5 hours. (as shown in the above graph)
For a 3-minute ticker, frame of reference = 2.5 * 60 / 3 = 50
Which is the default given in this script.
Ultimately, it is up to you to do grid search and find these hyperparams for the stock and ticker size you're working with.
Also, this script only serves the purpose of detecting the Histogram curve opening/closing.
You may want to add further checks to perform proper trading using MACD.
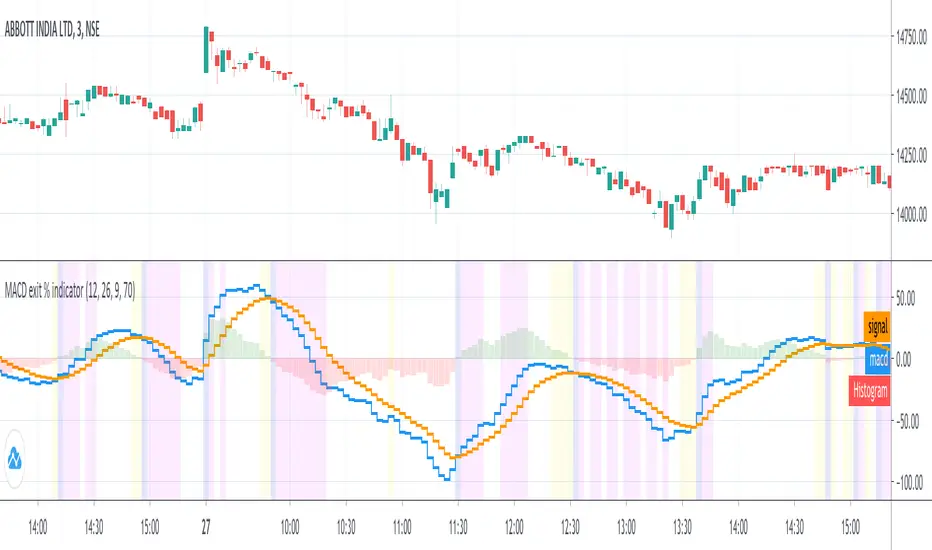
MACD exit % indicatorIntroduction
An exit indicator for MACD, good for triggering order exit via MACD.
It works by considering and the .
Then, it just exits when the % change in these values surpasses a threshold.
Indicators
blue line - MACD
orange line - Signal
green/red columns - Histogram
aqua background - Last Histogram Flip
fuchsia background - Max abs(Histogram) value after last flip
orange Background - Exit region