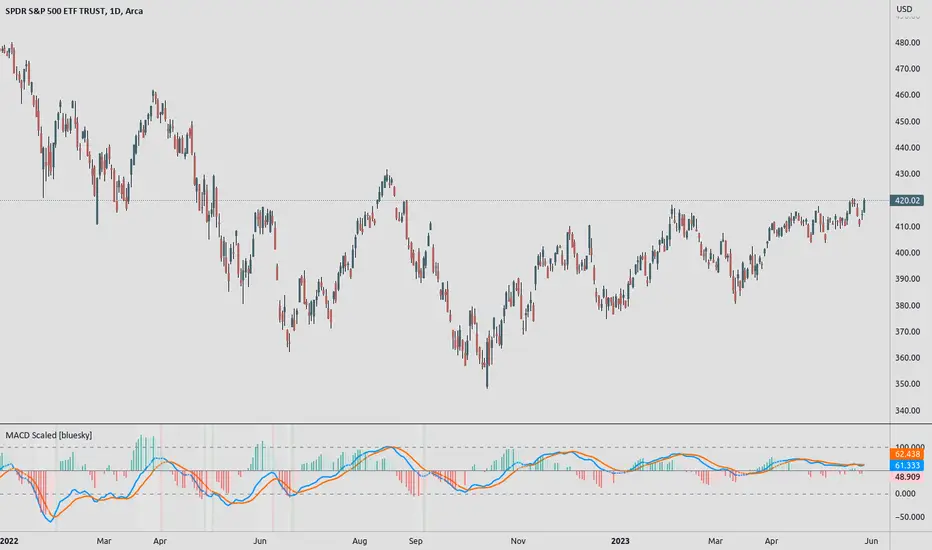
MACD ScaledMACD scaled and re-centered for 0-100 range (user adjustable)
+ Leader
+ Stochastic RSI
Details: A simple MACD re-centered to 50 lines rather than 0 line. Also added MACD Leader and Stochastic RSI to show possible usefulness of re-scaling the MACD.
NOTE: Due to nature of MACD, could not get the lines cannot be contained within top/bottom borders without excess distortion.
Credit to lazybear for leader formula.
ממוצע התכנסות/סטייה נע (MACD)
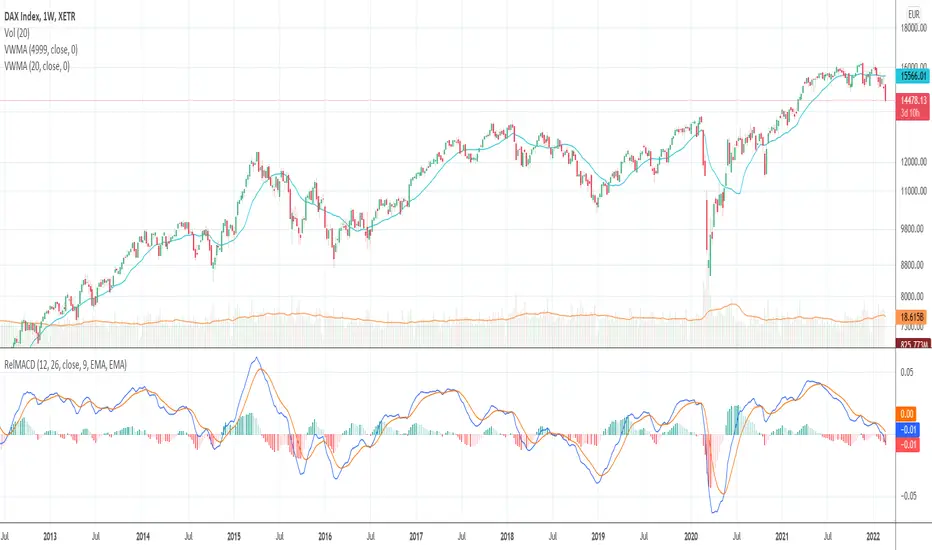
Relative Moving Average Convergence DivergenceThe normal MACD is formed by the difference of two moving averages. In contrast, the relative MACD is formed by the quotient of two moving averages.
In my opinion, it is only with the Relaticen MACD possible to compare values at different prices.
Der normale MACD wird durch die Differenz zweier gleitender Durchschnitte gebildet. Im Gegensatz dazu wird der Relative MACD duch den Quotienten zweier gleitender Durchscnitte gebildet.
Meiner Meinung nach, ist es erst mit dem Relaticen MACD möglich Werte zu unterschiedlichen Kursen zu vergleichen.
La MACD normale est formée par la différence entre deux moyennes mobiles. En revanche, la MACD relative est calculée à partir du quotient de deux moyennes mobiles.
À mon avis, ce n'est qu'avec la MACD relative qu'il est possible de comparer des valeurs à des prix différents.
El MACD normal está formado por la diferencia entre dos medias móviles. En cambio, el MACD relativo está formado por el cociente de dos medias móviles.
En mi opinión, sólo con el MACD Relativo es posible comparar valores a diferentes precios.
Обычный MACD формируется разницей между двумя скользящими средними. В отличие от этого, относительный MACD формируется из коэффициента двух скользящих средних.
На мой взгляд, только с помощью относительного MACD можно сравнивать значения по разным ценам.
正常的MACD是由两条移动平均线之差形成的。相反,相对MACD是由两条移动平均线的商数形成的。
在我看来,只有相对MACD才有可能比较不同价格下的价值。
MACD Bar 1.0 [upslidedown]MACD is one of the most consistent ways a trader can determine overall trend direction. In this script, I've simplified the traditional MACD histogram into a compact bar with trend change shapes (▲▼) when the MACD histogram goes under the zero line or above the zero line. With traditional MACD I often have to zoom in, wasting precious time. This indicator fixes that problem.
I use this script as a confirmation for other trigger signals, not as an entry or exit signal. I find this compact widget to be a preferable visualization of MACD on lower timeframes, while high timeframe analysis lends itself to the traditional MACD built-in with more data for decision making. This is also very useful when crafting trading strategies to quickly check for confluence of signals.
In addition to the traditional EMA smoothing that comes with MACD, I exposed a series of common moving average types. These include: SMA, EMA, WMA, RMA, SWMA, VWMA, Hull, TEMA, and ZLEMA. TEMA and ZLEMA are not standard builtins, but when looking for fast confirmation they can be very useful. They can also create LOTS of noise, so consider this wisely before changing the builtin methodology. One neat trick is to pair a "fast" version of this with fast moving average type and then a slow one using traditional EMA.
▲▼ signals = trend shift in direction of triangle
full color "bull or bear" color = strong trend
half color (semi-transparent) "bull or bear" color = weakening trend

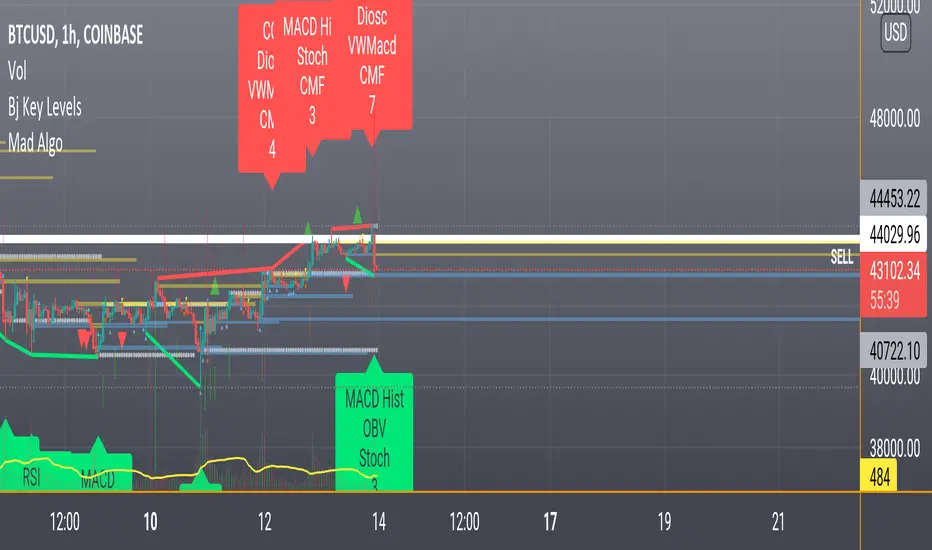
CA - Indicators ColorsThe following indicator help to have an idea of the current state of the MACD and FullStochastic in 1 hour and 1 day. If you are a trader that is regularly using stochastics and macd indicator and don't have enough space in you screen this might help to increase the space in your screen.
Parameters used on MACD: 12, 26,9
Parameters used on Stochastics: 14,5,5
The whole idea of the indicator is if you see an entry for a long position, you can confirm that a higher timeframe its aligned by both indicators and if you are seeing an entry for a short position you can confirm with a higher timeframe.
This indicator doesn't provide an entry or exit signal, but lets you verify where is the trend going in those timeframes so it helps you decide to make the trade.
Stochastic
Green: going up
Red: going down
Macd
Green: going up
Light Green: previous was green and going down.
Red: going down
Light Red: previous was red and going up
Keep in mind, the colors are going to get updated as long as the market is active.
Any feedback its appreciated.

Selected MACD Areas CompareThis is a simple tool to compare two selected MACD histogram area. The MACD histogram area is sometimes used to determine trend reversal or trend strength. One may have difficulty with this when the compared MACD areas are of different shape or similar in size. This indicator/tool allows user to select two time periods on the chart and get a precise compare result.
To use the indicator, place a regular MACD indicator on the chart which shows the histogram, then add this indicator and select the two areas of which you want to compare the size. Please make sure that the regular MACD indicator this one have the same source.

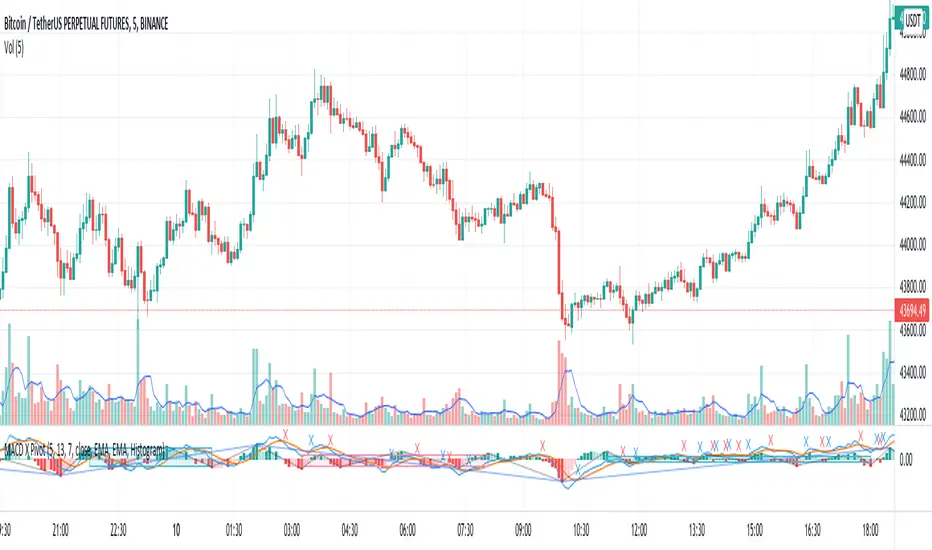
MACD X PivotThe Theory of Entanglement (缠论) is one of the most widely studied trading theories in China, but it is much less known among traders outside. Fractals, strokes, line segments and pivots are basic elements in the Theory of Entanglement. This indicator, MACD X Pivot, applies the concept of strokes, line segment and pivot to the classic MACD indicator and provides a good indication of the exact turning point of a trend based on MACD divergence. Also see a related indicator for applying the Theory of Entanglement on the price chart:
Relations between stroke, line segment and pivot:
• Stroke: Connecting two adjacent top and bottom fractals with at least one candlestick in between.
• Line segment: Consists of an odd number of strokes, at least three strokes are required, and the first three strokes must have overlapping parts.
• Pivot: The part of a trend type at a certain level that is overlapped by at least three consecutive sub-level trend types.
List of drawings on the chart:
1. Blue and red crosses: golden and death crosses between MACD and signal lines.
1. Gray lines: Strokes at the current level.
2. Blue lines: Strokes at a higher level, also line segments at the current level.
3. Blue shaded rectangles: Bullish pivot.
4. Red shaded rectangles: Bearish pivot.
How to use the indicator:
1. The golden cross and death cross between the MACD and signal lines: Blue cross: MACD line crosses up the signal line - buy signal; Red cross: MACD line crosses down the signal line: sell signal.
2. For the bullish blue pivot, the 2nd low (higher low) provides a good indication of the exact turning point from a bearish to bullish trend.
3. For the bearish red pivot, the 2nd high (lower high) provides a good indication of the exact turning point from a bullish to bearish trend.
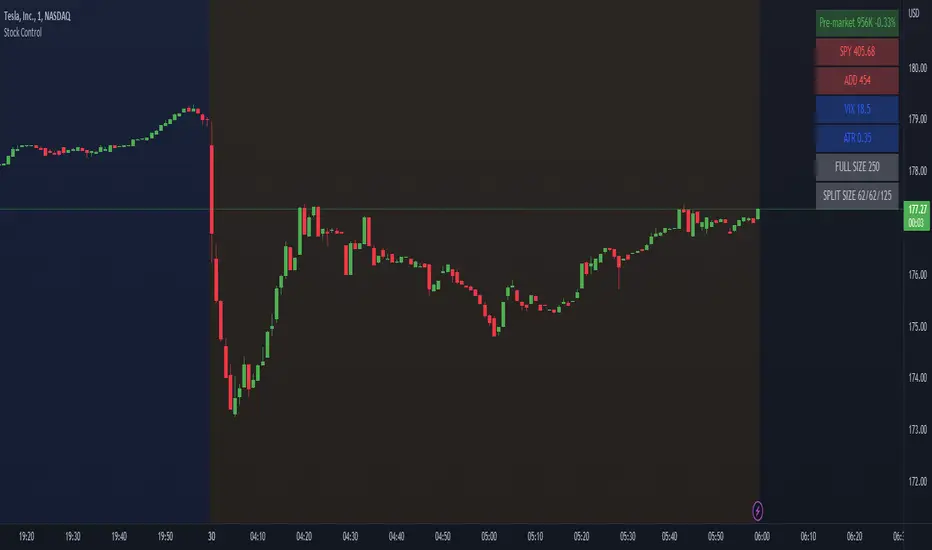
Stock ControlThis indicator shows the following values:
Pre-market volume
SPY
ADD
VIX
For each value the background will be colored based on specific internal parameters which can be customized.
The indicator is highly customizable. Here are some of the settings:
Compact view
Text size
Pre-market thresholds
SPY MACD parameters
ADD MACD parameters
VIX Bollinger parameters
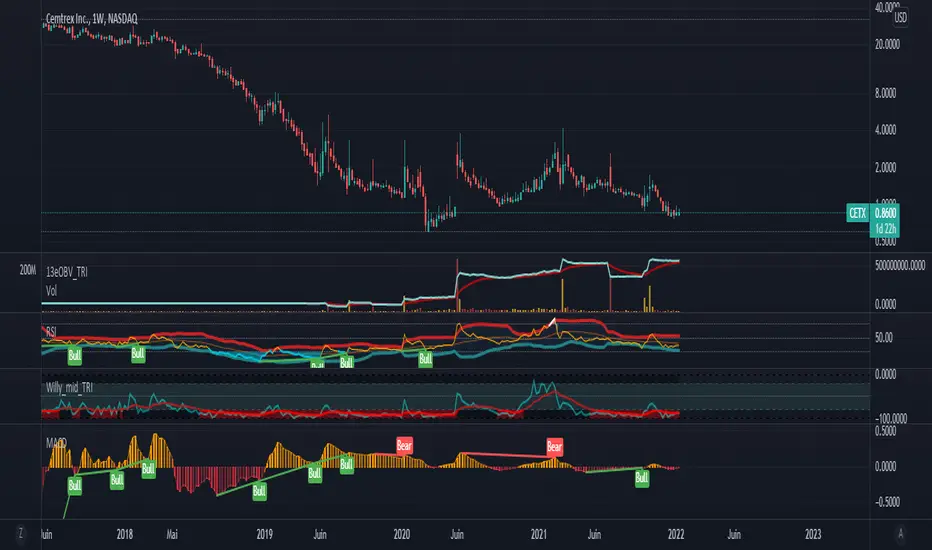
Normalized MACD by[@hadi_saadat]This MACD is exactly like standard MACD, but extremely stable and normalized by EMAs(200,150,100,50,30).
So you need at-least 30 candle to see the chart.
The Huge differences can be seen when the close price scale over time changes for instance go to the weekly time-frame, see the normalized MACD and Standard MACD when the BTC price was below 10k or even below 5k and compare two MACD charts (The standard one chart get almost vanished when the price was much cheaper and it doesnt scale well), then zoom in the standard MACD at that period and again compare it to The Normalized one(When you zoom in you will see surprisingly both MACDs are exactly the same form and shape, however normalized one doesn't need zoom-in and it is well scaled among the time and different prices), You will be surprised that how stable it is.
The normalizes MACDs, Signals and Histograms values are comparable to any other assets (obviously in same time-frame).

[UPRIGHT Trading] Awesome MACD+ (cc)Hello Traders,
I'd like to introduce you all to the Awesome MACD+ indicator.
As most of you know, the Moving Average Convergence Divergence, MACD, indicator is a one of the most popular indicator among traders. The MACD is a trend-momentum indicator that measures the relationship between moving averages and uses a signal line to show crossovers between the MACD line. The signal line is generally used as a trigger for buy/sell signals with a cross of the MACD line or confirmation when used with other strategies. More advanced traders will look for divergences; divergences can, for example, indicate a weakness in the current trend.
How the Awesome MACD+ is different:
This MACD uses several complex equations and filters to improve accuracy.
Multiple extremely accurate Buy/Sell signals not found on a traditional MACD indicator.
Ability to use 2 different background highlight signals and several different buy/sell signals.
Fully customizable (as always), ability to turn on or off any signals, change any of the colors to suit your needs.
***I've used Bitcoin in the chart above just to show that it is still extremely accurate using alt-coins as well.
On AAPL
Advanced algo trend filtering
Easy to read signals for every level of trader.
..Can work for the minimalist.
..Those that want every signal.
..Those that like a balance of signals.
Whatever your style or skill level, the Awesome MACD+ can be customized to fit your needs.
The above chart should look like this:
Good luck Traders.
Cheers,
Mike
(UPRIGHT Trading)

MACD Cross [Momentum & Trend Filter]This is MTF MACD crossover and crossunder, with EMA trend filter and MTF RSI overbought/oversold filter.
Guidelines:
- User can set stop loss, take profit target and risk to reward ratio in setting
- ATR Stop and ATR Multiplier are use to set stop loss and take profit levels, setting are varies depend on what you are trading, play around and find appropriate number
- Don't trade if range between stop loss and target profit are too small or if there are too many small range try to increase multiplier
- If MACD Zero Line Filter enable, detect MACD crossover only under zero line for LONG, and detect MACD crossunder only above zero line for SHORT
- If EMA Trend Filter enable, detect MACD crossover which price above EMA for LONG, and detect MACD crossunder which price below EMA for SHORT
- RSI timeframe 1-3 should not lower than chart timeframe to display Overbought and Oversold correctly
- Enable MTF Overbought and Oversold just to display red background for Overbought, and green background for Oversold
There are 3 alert options:
(For those free user which can get only 1 alert, please choose "MACD crossover & crossunder" if you want to get alert for both long and short directions)
Have fun :)

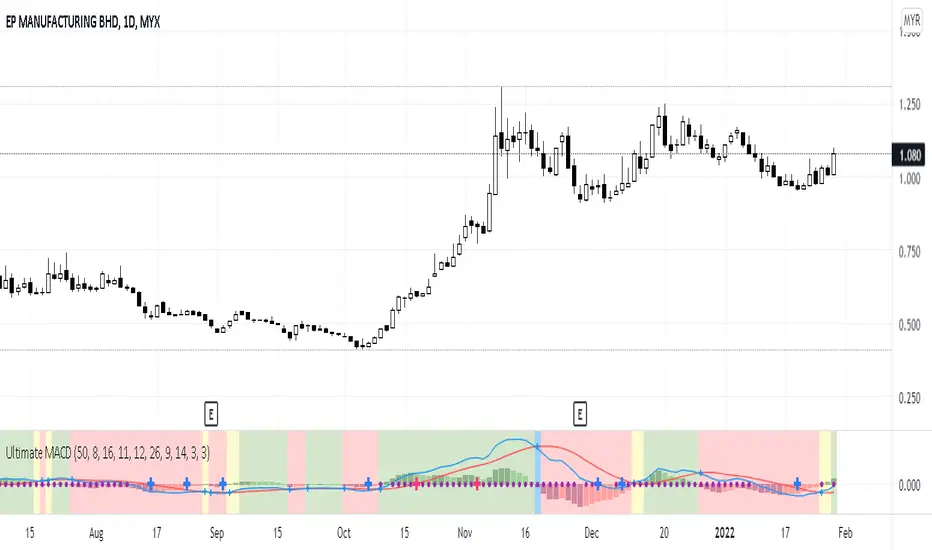
Ultimate MACDThis indicator is an improved version of MACD+RSI (refer to my script list). Basically, this indicator is a combination of several indicators:
1. Fast MACD (preset at 8, 16, 11 - it is my own preference settings and the red and blue line in this indicator are referring to the Fast MACD settings)
2. Slow MACD (preset at 12, 26, 9 - standard settings and the Slow MACD lines are not displayed in this indicator)
3. RSI (preset over value 50)
4. Stochastic (preset overbought at 80, oversold at 20)
How to read:
1. Fast and Slow MACD:
- Two red and blue lines are displaying the Fast MACD lines
- Small blue cross will appear at every crossover of the Fast MACD lines
- Golden Cross 1: Yellow background will appear if only Fast MACD lines are crossing to each other (blue crossover red)
- Golden Cross 2: Green background will appear if both Fast and Slow MACD lines are crossing to each other (blue crossover red but for Slow MACD, I didn't put those lines in this indicator)
- Death Cross 1: Blue background will appear if only Fast MACD lines are crossing to each other (red crossover blue)
- Death Cross 2: Red background will appear if both Fast and Slow MACD lines are crossing to each other (red crossover blue)
2. RSI:
- Purple dots will appear on the center line if RSI value is over 50
3. Stochastic:
- Big Blue cross will appear on the center line if stochastic line are crossing to each other in the oversold area (preset at 20)
- Big Red cross will appear on the center line if stochastic line are crossing to each other in the overbought area (preset at 80)
That's all about this indicator, you can use it based on your own trading style if it suits you. And again I let the script open for anyone to modify it based on your own preferences.
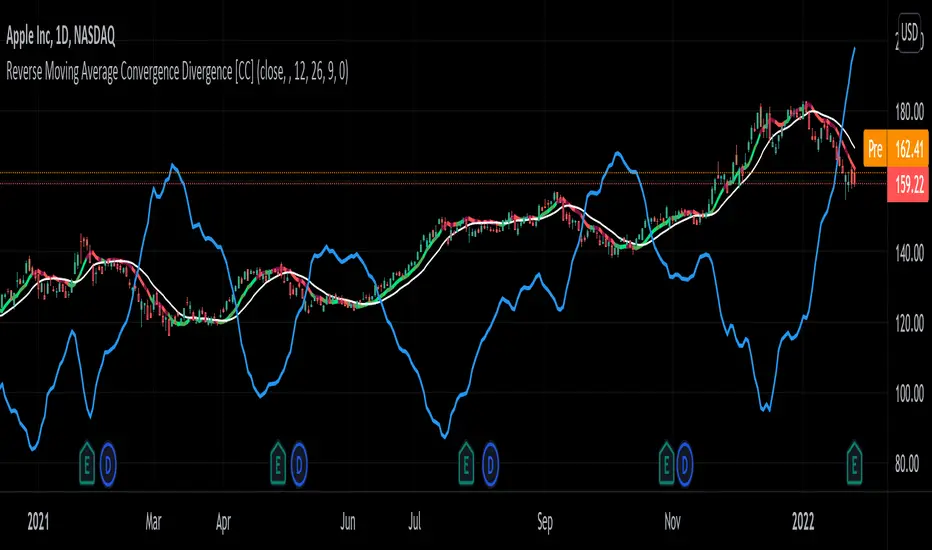
Reverse Moving Average Convergence Divergence [CC]The Reverse Macd was created by Johnny Dough (Stocks and Commodities Jan 2012) and this is another indicator in my ongoing series to find those hidden gems. This indicator works in a few very powerful ways. For example the blue line shows you what the current price would be if the macd was at the macd level that you choose. I set the default to 0 but feel free to change it if you want. This will give you short to medium term info by telling you if it is an uptrend when the price is above the blue line or vice versa. It also creates the reverse macd line and it's signal line by using information from the previous day to decompile the macd and show you the price that it would be at if the macd was at that level. It turns this into a new moving average that closely tracks price movements and with the two competing signals, gives you more than enough info to find the perfect entry and exit points. Like always I have included strong buy and sell signals in addition to normal ones so darker colors are strong signals and lighter colors are normal signals. Buy when the line is green and sell when it is red.
Let me know if there are any other scripts you would like to see me publish!
Sharktank - MACD ExtendedThe MACD, but with added features. Features are:
* Different color schemes.
* Change between different MA types (EMA and SMA) for both the oscillator and the signal MA.
* Show normal bearish and bullish divergence on both the oscillator and the signal MA.
* Show hidden bearish and bullish divergence on both the oscillator MA and the signal MA.
* Change line styles.

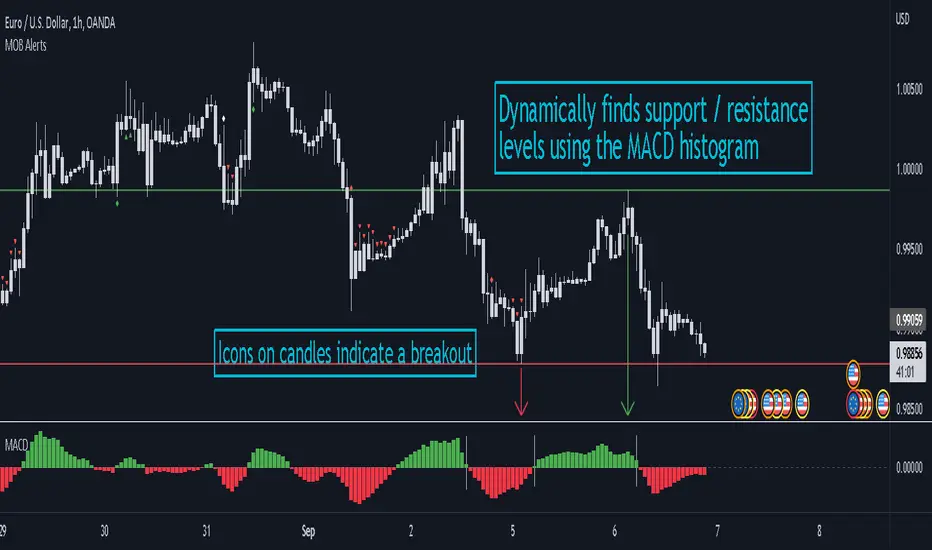
MACD Objective Breakouts + AlertsFinds the most recent support and resistance level as confirmed by the MACD . These level are detected dynamically and the lines will be updated as new levels form.
Alerts can be toggled on or off in the settings but will not work if the alert is not added to your chart. Alerts can be added by selecting the "Alert" button on TradingView then selecting "MOB Alerts" as the condition
Alerts will trigger when price closes above or below the indicated levels.
Please let me know if you find any bugs!
MACD + AveragesA classic MACD with average peak and dip lines. The lighter green and red horizontal lines are the average peak and dip of the entire span, respectively. The second, bolder of the two lines are the averages of the peaks and dips above and below the overall peak and dip averages. The filled in color is to help visualize these averages and possible trade setups.
Wave Trend OscillatorThis is a very standard version of the Wave Trend Oscillator.
The Channel and Average values are displayed as lines, most people display them as areas.
The Channel and Average difference is displayed as a histogram, most people display it as a tiny noisy area.
I was unable to find a standard version of the Wave Trend Oscillator.
The colorful hyped up versions of this indicator made me feel like a clown while using them.
I have essentially copied the style of the MACD with this indicator, to keep things professional.
With this WTO, you can change the timeframe and source.
You can also change the histogram average length and multiplier, making it usable.
The typical way that people display the histogram is completely unusable and just for appearance.
Now it does a decent job showing when the momentum of the WTO's downward movement is slowing down, just like how the MACD histogram works.
This indicator is essentially a normalized MACD, though they are calculated differently.
The Wave Trend Oscillator is useful for spotting/monitoring changed in mid-trend momentum.
In my experience, divergence in this indicator is a strong signal.
If the MACD is too slow for you, then this is a great alternative; without all the extra fluff people usually add to it.

Mad StrategyThis is a compile of my trading suite.
Because it is so simple I can describe much of it.
Just try it, green for buy and red for sell.
[Rygel] MACD 4C with divergences, crossovers and alertsThis indicator is a reliable, exhaustive, instant, simple divergence detector for the MACD 4C oscillator.
I've struggled for months to find a MACD divergence indicator I can rely on, I've tinkered with the ones I found and never was satisfied by the final result. For all of them important divergences were not shown, for some divergences was shown too late, for others divergence lines was not drawn, some even shown some strange exotic divergences... I played will all the parameters and something was always wrong or missing at the end.
It was even worse for the MACD 4C indicator, the 4-color MACD, which I prefer to use.
So I finally decided to write my own divergence algorithm and to create my own indicator. After a few attempts, here's the result.
This MACD indicator is using the same divergence detection algorithm I wrote for my RSI indicator. You'll find on its description page a comparison of my divergence algorithm with other ones to see how it differs.
When I built this indicator, my objectives were to create one that is:
Reliable. I didn't want to have to double-check an indicator to make sure it's doing what I expect it to do. I want to be able to look at it for one second and know I can rely on it.
Exhaustive. I didn't want to have to rely on multiple indicators to be sure I'm not missing a divergence.
Instant. I wanted the divergences to be shown as soon as soon as they form and not after a pivot is confirmed. For some indicator, when the divergence is displayed, it's already too late to act on it.
Simple. I wanted my indicator to be clean, readable and not visually aggressive. The main objective of this indicator is to show divergences and I didn't want to visually overload it with unrequired information.
I wanted my indicator to be a simple as possible, nonetheless you'll find a few parameters to tinker with. Many of them will need no explanation but here's the list.
Show signal line: disabled by default. Show the MACD signal line.
Color signal line: disabled by default. Show the signal line as green when it goes up and read when it goes down.
Show signal crossovers: enabled by default. Show a green dot when MACD crosses up its signal line and a red dot when it crosses down.
Show zero line: enabled by default. Show a line at the 0 value.
Show zero crossovers: disabled by default. Show a green triangle when MACD crosses up the 0 line and a red triangle when it crosses down.
Show regular divergences: enabled by default.
Show hidden divergences: disabled by default for readability. I try to keep the indicator as clean as possible by default.
Bullish regular divergence color : no explanation needed I suppose.
Bullish hidden divergence color : same.
Bearish regular divergence color : ditto.
Bearish hidden divergence color : uhh.
Show overbought and oversell backgrounds : when RSI is oversold or oversell, the background color changes to red or green. The indicator uses two levels of oversold/overbought. When the RSI is strongly oversold/overbought the background color gets brighter. You can configure these levels in the advanced parameters.
Advanced parameters:
MACD fast moving average length: 12 by default.
MACD slow moving average length: 26 by default.
MACD signal moving average length: 9 by default.
Show divergences before pivot confirmation : enabled by default. Divergences will appear as soon as possible, before the pivot is confirmed by another candlestick. Unconfirmed divergences will appear as dashed lines then disappear if not confirmed or turn to solid lines if confirmed. This may create false positives with alerts as the divergence may disappear.
Minimum bars to check: 5 by default. As this indicator detects absolutely all the divergences, some may be insignificant and it may become unreadable without some filtering. If you want to see absolutely all the divergences, you may lower this value. Please note TradingView limits to 50 how many lines are displayed at the same time on an indicator. So when you display more divergences, some in the past disappear. It's not usually an issue but if you scroll back in time, divergences will stop to show at one point in the past.
Maximum bars to check: 75 by default. Divergences may go far in the past, this parameters limit how old a divergence may be. You can higher it to show more divergences.
Show pivots: disabled by default. Show the pivot points used for divergence detections.
This indicator offers the following alerts:
Any divergence
Bearish divergence
Bullish divergence
Regular bearish divergence
Regular bullish divergence
Hidden bearish divergence
Hidden bullish divergence
MACD becoming positive
MACD becoming negative
MACD crossing up signal line
MACD crossing down signal line
Please note TradingView limits for performance reason to 50 the number of lines you can display on an indicator at the same time. So when you scroll back in time, at one point divergences will stop to show. If you want to see divergences far in the past, you may need to use the replay feature or to configure stronger filtering settings.
I hope you'll enjoy this indicator as much as I do! :)
Feel free to comment if you experience a bug or if an important feature is missing for you. (Please note the core of this indicator is divergence detection, I want to keep it simple so I will probably not add many unrelated features to it.)

MACD + Divergence + Line █ OVERVIEW
Here's the classic MACD with some simples features in plus.
█ CONCEPTS
4 features
1 — Classic MACD histogram, with 4 different colors such as above or below 0, and above or below the previous bar
2 — Display option to disable EMA
3 — A signal line that show the exact point, because the histogram view might be hard to be precise
4 — Looking for previous Divergences, Bullish, Bearish and Hidden Bullish and Bearish but I don't like Hidden divergences
█ OTHER SECTIONS
An oscillator is good to know where we are in the trends, but it's not enough to run a small business of trading, you need to learn how to use it.
What is a divergence ?
Thanks to The rational investor for teaching me how to use this indicator.
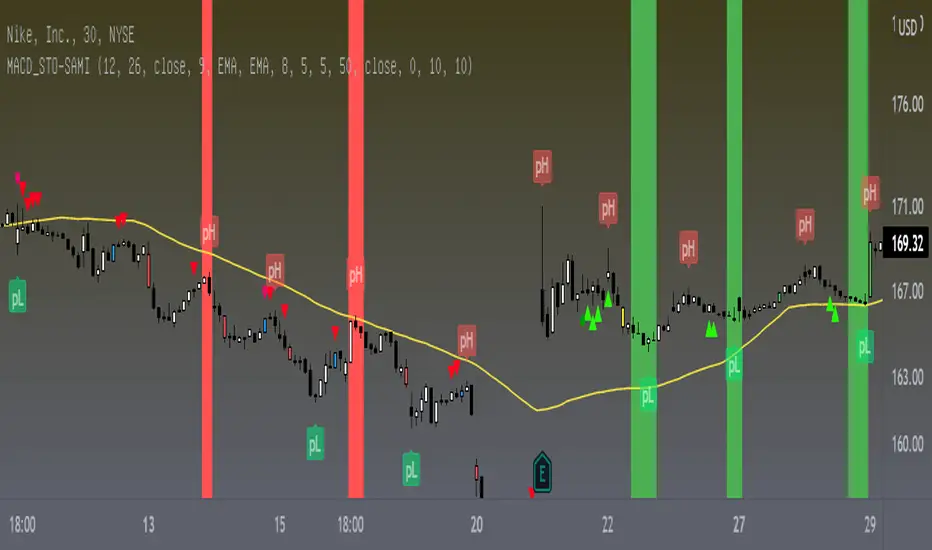
MACD_STO-SAMI
This indicator depends on the trend. You must first determine the general trend and then wait for the signals that indicate buying in the bullish direction and the signals that indicate selling in the bearish direction, which is the green signal is considered buying and the red signal is considered selling
Also, this indicator differs from the rest of the indicators that the signal is prior to the movement of hair, meaning that it is predictive and is strong.
The green bar is the buying peak.
The red bar is oversold.
The red arrows indicate that you can sell, but the price must be monitored.
The green arrows indicate that it is possible to buy and monitor the price
The colored candles are 4, and each candle indicates the order of the candle.
1- The blue candle indicates a change in the bearish trend and the possibility of it changing to an upward trend.
2- The green candle, which indicates that there will be acceleration in the upward direction.
3- The yellow candle indicates a change in the upward trend and the possibility of it changing to the downside.
4- The red candle indicates that there will be acceleration in the downside direction
To help determine the trend, the average of the 50 simple has been set
NYSE:BA
FX:GBPUSD
TADAWUL:1120
BINANCE:BTCUSDT
MACD_STO-SAMI This indicator depends on the trend. You must first determine the general trend and then wait for the signals that indicate buying in the bullish direction and the signals that indicate selling in the bearish direction, which is the green signal is considered buying and the red signal is considered selling
Also, this indicator differs from the rest of the indicators that the signal is prior to the movement of hair, meaning that it is predictive and is strong.

Median Convergence DivergenceIntroduction
The Median Convergence Divergence (MCD) is a derivative of the Moving Average Convergence Divergence (MACD). The difference is the change in the use of the measure of central tendency. In MACD, moving average (mean) is used, whereas, in MCD, the median is used instead. The purpose of using the median is to eliminate the outlying values, which would be calculated for a moving average. The outliers would affect the value of the moving average.
For example: 3, 5, 7, 8, 5, 4, 2, 1, 6, 21, 8. The data set average is 6.3, whereas the median value is 5. There is a difference of about 23% in the example. The reason is the outlying value '21' in the data set.
As the markets are volatile, outlying values can always emerge. A moving average will consider those values; on the other hand, the median will ignore. If the strategy calls for a tool to ignore the outliers, the Median Convergence Divergence would be a great centered oscillator.
The default values have changed to suit the current trading days in a week. When the MACD was introduced, there would be six trading days in a week. Therefore, it used 12 (2 weeks), 26(4 weeks), and 9 ( 1.5 weeks). But now that there are five trading days per week. The default values are adapted to them. Feel free to change them as per your wish.
Recommended Settings
The current settings are set to be used for the Daily Time Frame: 5 day period for the fast line, a 20 day period for the slow line, and a 10 day period for the signal line. (5 days represent a trading week, 10 days is two weeks, and 20 days is 4 weeks or a month)
For the weekly charts, use 4 week period for the fast line, 13 week period for the slow line, and 8 week period for the signal line. (4 weeks represent a month, 8 weeks is two months, and 13 weeks is 3 months or quarterly)
And for monthly charts, use 3 month period for the fast line, 12 month period for the slow line, and 6 month period for the signal line. (3 months is quarterly, 6 months is bi-yearly, and 12 month is yearly)
It'll be challenging to measure for intraday since there are many different timeframes within intraday. The settings mentioned above should also be customized as per the requirements of the trading strategy.
Strategy
The strategy application is the same as the MACD, i.e., Signal Line Crossovers, Zero Line Crossovers, and Divergence.
Signal Line Crossovers: When the MCD line crosses above the Signal line, it's a bullish crossover. When the MCD line crosses below the Signal line, it's a bearish crossover.
Zero Line Crossovers: It's a bullish crossover when the MCD line crosses above the Zero line. When the MCD line crosses below the Zero Line, it's a bearish crossover.
Divergence: When price shows a lower low, but MCD shows a higher low, it's a bullish divergence. When the price shows a higher high but MCD shows a lower high, it's a bearish divergence.
Using other indicators in conjunction with the Median Convergence Divergence is recommended to take entry and exit signals.

MATIC/USD 1H Bot for 3commas (works w/o 3commas too)This is a MATIC/USD or USDT specific implementation of my BNB/USD 1 hour bot. It should work out of the gate correctly for MATIC, at least based on what has been happening with it for the past seven weeks. You can fiddle with the following settings using the gear icon:
Fast and slow MACD length
The decision to use RSI thresholds as requirements for buys and/or sells, as well as the chart timeframe to use for that (make sure you use the same timeframe as your chart or a higher timeframe. You don't want to use a 1m RSI on a one hour chart but you can use a 4 hour RSI on a 1 hour chart with no issues.)
Buy and/or sell RSI threshold limits
Trailing stop loss %
Start date (for backtesting, I usually leave mine with 1-2 months trailing as those are usually better indicators than how they would have performed over the past few years)
Stress levels
Moving Average length and type
Linear regression amount
The gist of this bot is that it will use a smoothed EMA to make informed buys and sells. The smoothing prevents most noise from affecting your orders. It also allows you to set a trailing stop loss. If you don't want to use this feature set the value to 100 and it will effectively disable it.
Finally, you can disable RSI threshold point visibility. This won't affect bot operation, it just makes it cleaner to look at on your chart. Disabling RSI buys or sells will also disable visibility.
This bot takes a shotgun strategy to buys and sells. It makes a lot of buys and the majority of them are closed with little to no movement up or down. However, the ones that are profitable make a LOT as you will see once you start testing.
I make the full version of these bots available (though the script is protected) so users can test them, however if you want to use it with 3commas you will need access to the full script. Message me if you want the code and we can figure something out.
