Professional MSTI+ Trading Indicator"Professional MSTI+ Trading Indicator" is a comprehensive technical analysis tool that combines over 20 indicators to generate high-quality trading signals and assess market sentiment. The script integrates standard indicators (MACD, RSI, Bollinger Bands, Stochastic, Simple Moving Averages, and Volume Analysis) with advanced components (Squeeze Momentum, Fisher Transform, True Strength Index, Heikin-Ashi, Laguerre RSI, Hull MA) and further includes metrics such as ADX, Chaikin Money Flow, Williams %R, VWAP, and EMA for in-depth market analysis.
Key Features:
Multiple Presets for Different Trading Styles:
Choose from optimal configurations like Professional, Swing Trading, Day Trading, Scalping, or Reversal Hunter. Note that the presets may not work perfectly on all pairs, and manual calibration might be required. This flexibility allows you to fine-tune the settings to align with your unique strategies and signals.
Multi-Layered Signal Filtering:
Filters based on trend, volume, and volatility help eliminate false signals, enhancing the accuracy of market entries.
Comprehensive Fear & Greed Index:
The indicator aggregates data from RSI, volatility, momentum, trend, and volume to gauge overall market sentiment, providing an additional layer of market context.
Dynamic Information Panel:
Displays detailed status updates for each component (e.g., MACD, RSI, Laguerre RSI, TSI, Fisher Transform, Squeeze, Hull MA, etc.) along with a visual strength bar that represents the intensity of the trading signal.
Signal Generation:
Buy and sell signals are generated when a predefined number of conditions are met and confirmed over multiple bars. These signals are clearly displayed on the chart with arrows, making it easier to spot potential entry and exit points.
Alert Setup:
Built-in alert conditions allow you to receive real-time notifications when trading signals are generated, helping you stay on top of market movements.
"Professional MSTI+ Trading Indicator" is designed to enhance your trading strategy by providing a multi-faceted market analysis and an intuitive visual interface. While the presets offer a robust starting point, they may require manual calibration on certain pairs, giving you the flexibility to configure your own unique strategies and signals.
Machinelearning

Machine Learning Trendlines Cluster [LuxAlgo]The ML Trendlines Cluster indicator allows traders to automatically identify trendlines using a machine learning algorithm based on k-means clustering and linear regression, highlighting trendlines from clustered prices.
For trader's convenience, trendlines can be filtered based on their slope, allowing them to filter out trendlines that are too horizontal, or instead keep them depending on the user-selected settings.
🔶 USAGE
Traders only need to set the number of trendlines (clusters) they want the tool to detect and the algorithm will do the rest.
By default the tool is set to detect 4 clusters over the last 500 bars, in the image above it is set to detect 10 clusters over the same period.
This approach only focuses on drawing trendlines from prices that share a common trading range, offering a unique perspective to traditional trendlines. Trendlines with a significant slope can highlight higher dispersion within its cluster.
🔹 Trendline Slope Filtering
Traders can filter trendlines by their slope to display only steep or flat trendlines relative to a user-defined threshold.
The image above shows the three different configurations of this feature:
Filtering disabled
Filter slopes above threshold
Filter slopes below threshold
🔶 DETAILS
K-means clustering is a popular machine-learning algorithm that finds observations in a data set that are similar to each other and places them in a group.
The process starts by randomly assigning each data point to an initial group and calculating the centroid for each. A centroid is the center of the group. K-means clustering forms the groups in such a way that the variances between the data points and the centroid of the cluster are minimized.
The trendlines are displayed according to the linear regression function calculated for each cluster.
🔶 SETTINGS
Window Size: Maximum number of bars to get data from
Clusters: Maximum number of clusters (trendlines) to detect
🔹 Optimization
Maximum Iteration Steps: Maximum loop iterations for cluster computation
🔹 Slope Filter
Threshold Multiplier: Multiplier applied to a volatility measure, higher multiplier equals higher threshold
Filter Slopes: Enable/Disable Trendline Slope Filtering, select to filter trendlines with slopes ABOVE or BELOW the threshold
🔹 Style
Upper Zone: Color to display in the top zone
Lower Zone: Color to display in the bottom zone
Lines: Style for the lines
Size: Line size

Volume Predictor [PhenLabs]📊 Volume Predictor
Version: PineScript™ v6
📌 Description
The Volume Predictor is an advanced technical indicator that leverages machine learning and statistical modeling techniques to forecast future trading volume. This innovative tool analyzes historical volume patterns to predict volume levels for upcoming bars, providing traders with valuable insights into potential market activity. By combining multiple prediction algorithms with pattern recognition techniques, the indicator delivers forward-looking volume projections that can enhance trading strategies and market analysis.
🚀 Points of Innovation:
Machine learning pattern recognition using Lorentzian distance metrics
Multi-algorithm prediction framework with algorithm selection
Ensemble learning approach combining multiple prediction methods
Real-time accuracy metrics with visual performance dashboard
Dynamic volume normalization for consistent scale representation
Forward-looking visualization with configurable prediction horizon
🔧 Core Components
Pattern Recognition Engine : Identifies similar historical volume patterns using Lorentzian distance metrics
Multi-Algorithm Framework : Offers five distinct prediction methods with configurable parameters
Volume Normalization : Converts raw volume to percentage scale for consistent analysis
Accuracy Tracking : Continuously evaluates prediction performance against actual outcomes
Advanced Visualization : Displays actual vs. predicted volume with configurable future bar projections
Interactive Dashboard : Shows real-time performance metrics and prediction accuracy
🔥 Key Features
The indicator provides comprehensive volume analysis through:
Multiple Prediction Methods : Choose from Lorentzian, KNN Pattern, Ensemble, EMA, or Linear Regression algorithms
Pattern Matching : Identifies similar historical volume patterns to project future volume
Adaptive Predictions : Generates volume forecasts for multiple bars into the future
Performance Tracking : Calculates and displays real-time prediction accuracy metrics
Normalized Scale : Presents volume as a percentage of historical maximums for consistent analysis
Customizable Visualization : Configure how predictions and actual volumes are displayed
Interactive Dashboard : View algorithm performance metrics in a customizable information panel
🎨 Visualization
Actual Volume Columns : Color-coded green/red bars showing current normalized volume
Prediction Columns : Semi-transparent blue columns representing predicted volume levels
Future Bar Projections : Forward-looking volume predictions with configurable transparency
Prediction Dots : Optional white dots highlighting future prediction points
Reference Lines : Visual guides showing the normalized volume scale
Performance Dashboard : Customizable panel displaying prediction method and accuracy metrics
📖 Usage Guidelines
History Lookback Period
Default: 20
Range: 5-100
This setting determines how many historical bars are analyzed for pattern matching. A longer period provides more historical data for pattern recognition but may reduce responsiveness to recent changes. A shorter period emphasizes recent market behavior but might miss longer-term patterns.
🧠 Prediction Method
Algorithm
Default: Lorentzian
Options: Lorentzian, KNN Pattern, Ensemble, EMA, Linear Regression
Selects the algorithm used for volume prediction:
Lorentzian: Uses Lorentzian distance metrics for pattern recognition, offering excellent noise resistance
KNN Pattern: Traditional K-Nearest Neighbors approach for historical pattern matching
Ensemble: Combines multiple methods with weighted averaging for robust predictions
EMA: Simple exponential moving average projection for trend-following predictions
Linear Regression: Projects future values based on linear trend analysis
Pattern Length
Default: 5
Range: 3-10
Defines the number of bars in each pattern for machine learning methods. Shorter patterns increase sensitivity to recent changes, while longer patterns may identify more complex structures but require more historical data.
Neighbors Count
Default: 3
Range: 1-5
Sets the K value (number of nearest neighbors) used in KNN and Lorentzian methods. Higher values produce smoother predictions by averaging more historical patterns, while lower values may capture more specific patterns but could be more susceptible to noise.
Prediction Horizon
Default: 5
Range: 1-10
Determines how many future bars to predict. Longer horizons provide more forward-looking information but typically decrease accuracy as the prediction window extends.
📊 Display Settings
Display Mode
Default: Overlay
Options: Overlay, Prediction Only
Controls how volume information is displayed:
Overlay: Shows both actual volume and predictions on the same chart
Prediction Only: Displays only the predictions without actual volume
Show Prediction Dots
Default: false
When enabled, adds white dots to future predictions for improved visibility and clarity.
Future Bar Transparency (%)
Default: 70
Range: 0-90
Controls the transparency of future prediction bars. Higher values make future bars more transparent, while lower values make them more visible.
📱 Dashboard Settings
Show Dashboard
Default: true
Toggles display of the prediction accuracy dashboard. When enabled, shows real-time accuracy metrics.
Dashboard Location
Default: Bottom Right
Options: Top Left, Top Right, Bottom Left, Bottom Right
Determines where the dashboard appears on the chart.
Dashboard Text Size
Default: Normal
Options: Small, Normal, Large
Controls the size of text in the dashboard for various display sizes.
Dashboard Style
Default: Solid
Options: Solid, Transparent
Sets the visual style of the dashboard background.
Understanding Accuracy Metrics
The dashboard provides key performance metrics to evaluate prediction quality:
Average Error
Shows the average difference between predicted and actual values
Positive values indicate the prediction tends to be higher than actual volume
Negative values indicate the prediction tends to be lower than actual volume
Values closer to zero indicate better prediction accuracy
Accuracy Percentage
A measure of how close predictions are to actual outcomes
Higher percentages (>70%) indicate excellent prediction quality
Moderate percentages (50-70%) indicate acceptable predictions
Lower percentages (<50%) suggest weaker prediction reliability
The accuracy metrics are color-coded for quick assessment:
Green: Strong prediction performance
Orange: Moderate prediction performance
Red: Weaker prediction performance
✅ Best Use Cases
Anticipate upcoming volume spikes or drops
Identify potential volume divergences from price action
Plan entries and exits around expected volume changes
Filter trading signals based on predicted volume support
Optimize position sizing by forecasting market participation
Prepare for potential volatility changes signaled by volume predictions
Enhance technical pattern analysis with volume projection context
⚠️ Limitations
Volume predictions become less accurate over longer time horizons
Performance varies based on market conditions and asset characteristics
Works best on liquid assets with consistent volume patterns
Requires sufficient historical data for pattern recognition
Sudden market events can disrupt prediction accuracy
Volume spikes may be muted in predictions due to normalization
💡 What Makes This Unique
Machine Learning Approach : Applies Lorentzian distance metrics for robust pattern matching
Algorithm Selection : Offers multiple prediction methods to suit different market conditions
Real-time Accuracy Tracking : Provides continuous feedback on prediction performance
Forward Projection : Visualizes multiple future bars with configurable display options
Normalized Scale : Presents volume as a percentage of maximum volume for consistent analysis
Interactive Dashboard : Displays key metrics with customizable appearance and placement
🔬 How It Works
The Volume Predictor processes market data through five main steps:
1. Volume Normalization:
Converts raw volume to percentage of maximum volume in lookback period
Creates consistent scale representation across different timeframes and assets
Stores historical normalized volumes for pattern analysis
2. Pattern Detection:
Identifies similar volume patterns in historical data
Uses Lorentzian distance metrics for robust similarity measurement
Determines strength of pattern match for prediction weighting
3. Algorithm Processing:
Applies selected prediction algorithm to historical patterns
For KNN/Lorentzian: Finds K nearest neighbors and calculates weighted prediction
For Ensemble: Combines multiple methods with optimized weighting
For EMA/Linear Regression: Projects trends based on statistical models
4. Accuracy Calculation:
Compares previous predictions to actual outcomes
Calculates average error and prediction accuracy
Updates performance metrics in real-time
5. Visualization:
Displays normalized actual volume with color-coding
Shows current and future volume predictions
Presents performance metrics through interactive dashboard
💡 Note:
The Volume Predictor performs optimally on liquid assets with established volume patterns. It’s most effective when used in conjunction with price action analysis and other technical indicators. The multi-algorithm approach allows adaptation to different market conditions by switching prediction methods. Pay special attention to the accuracy metrics when evaluating prediction reliability, as sudden market changes can temporarily reduce prediction quality. The normalized percentage scale makes the indicator consistent across different assets and timeframes, providing a standardized approach to volume analysis.

AI Adaptive Oscillator [PhenLabs]📊 Algorithmic Adaptive Oscillator
Version: PineScript™ v6
📌 Description
The AI Adaptive Oscillator is a sophisticated technical indicator that employs ensemble learning and adaptive weighting techniques to analyze market conditions. This innovative oscillator combines multiple traditional technical indicators through an AI-driven approach that continuously evaluates and adjusts component weights based on historical performance. By integrating statistical modeling with machine learning principles, the indicator adapts to changing market dynamics, providing traders with a responsive and reliable tool for market analysis.
🚀 Points of Innovation:
Ensemble learning framework with adaptive component weighting
Performance-based scoring system using directional accuracy
Dynamic volatility-adjusted smoothing mechanism
Intelligent signal filtering with cooldown and magnitude requirements
Signal confidence levels based on multi-factor analysis
🔧 Core Components
Ensemble Framework : Combines up to five technical indicators with performance-weighted integration
Adaptive Weighting : Continuous performance evaluation with automated weight adjustment
Volatility-Based Smoothing : Adapts sensitivity based on current market volatility
Pattern Recognition : Identifies potential reversal patterns with signal qualification criteria
Dynamic Visualization : Professional color schemes with gradient intensity representation
Signal Confidence : Three-tiered confidence assessment for trading signals
🔥 Key Features
The indicator provides comprehensive market analysis through:
Multi-Component Ensemble : Integrates RSI, CCI, Stochastic, MACD, and Volume-weighted momentum
Performance Scoring : Evaluates each component based on directional prediction accuracy
Adaptive Smoothing : Automatically adjusts based on market volatility
Pattern Detection : Identifies potential reversal patterns in overbought/oversold conditions
Signal Filtering : Prevents excessive signals through cooldown periods and minimum change requirements
Confidence Assessment : Displays signal strength through intuitive confidence indicators (average, above average, excellent)
🎨 Visualization
Gradient-Filled Oscillator : Color intensity reflects strength of market movement
Clear Signal Markers : Distinct bullish and bearish pattern signals with confidence indicators
Range Visualization : Clean representation of oscillator values from -6 to 6
Zero Line : Clear demarcation between bullish and bearish territory
Customizable Colors : Color schemes that can be adjusted to match your chart style
Confidence Symbols : Intuitive display of signal confidence (no symbol, +, or ++) alongside direction markers
📖 Usage Guidelines
⚙️ Settings Guide
Color Settings
Bullish Color
Default: #2b62fa (Blue)
This setting controls the color representation for bullish movements in the oscillator. The color appears when the oscillator value is positive (above zero), with intensity indicating the strength of the bullish momentum. A brighter shade indicates stronger bullish pressure.
Bearish Color
Default: #ce9851 (Amber)
This setting determines the color representation for bearish movements in the oscillator. The color appears when the oscillator value is negative (below zero), with intensity reflecting the strength of the bearish momentum. A more saturated shade indicates stronger bearish pressure.
Signal Settings
Signal Cooldown (bars)
Default: 10
Range: 1-50
This parameter sets the minimum number of bars that must pass before a new signal of the same type can be generated. Higher values reduce signal frequency and help prevent overtrading during choppy market conditions. Lower values increase signal sensitivity but may generate more false positives.
Min Change For New Signal
Default: 1.5
Range: 0.5-3.0
This setting defines the minimum required change in oscillator value between consecutive signals of the same type. It ensures that new signals represent meaningful changes in market conditions rather than minor fluctuations. Higher values produce fewer but potentially higher-quality signals, while lower values increase signal frequency.
AI Core Settings
Base Length
Default: 14
Minimum: 2
This fundamental setting determines the primary calculation period for all technical components in the ensemble (RSI, CCI, Stochastic, etc.). It represents the lookback window for each component’s base calculation. Shorter periods create a more responsive but potentially noisier oscillator, while longer periods produce smoother signals with potential lag.
Adaptive Speed
Default: 0.1
Range: 0.01-0.3
Controls how quickly the oscillator adapts to new market conditions through its volatility-adjusted smoothing mechanism. Higher values make the oscillator more responsive to recent price action but potentially more erratic. Lower values create smoother transitions but may lag during rapid market changes. This parameter directly influences the indicator’s adaptiveness to market volatility.
Learning Lookback Period
Default: 150
Minimum: 10
Determines the historical data range used to evaluate each ensemble component’s performance and calculate adaptive weights. This setting controls how far back the AI “learns” from past performance to optimize current signals. Longer periods provide more stable weight distribution but may be slower to adapt to regime changes. Shorter periods adapt more quickly but may overreact to recent anomalies.
Ensemble Size
Default: 5
Range: 2-5
Specifies how many technical components to include in the ensemble calculation.
Understanding The Interaction Between Settings
Base Length and Learning Lookback : The base length determines the reactivity of individual components, while the lookback period determines how their weights are adjusted. These should be balanced according to your timeframe - shorter timeframes benefit from shorter base lengths, while the lookback should generally be 10-15 times the base length for optimal learning.
Adaptive Speed and Signal Cooldown : These settings control sensitivity from different angles. Increasing adaptive speed makes the oscillator more responsive, while reducing signal cooldown increases signal frequency. For conservative trading, keep adaptive speed low and cooldown high; for aggressive trading, do the opposite.
Ensemble Size and Min Change : Larger ensembles provide more stable signals, allowing for a lower minimum change threshold. Smaller ensembles might benefit from a higher threshold to filter out noise.
Understanding Signal Confidence Levels
The indicator provides three distinct confidence levels for both bullish and bearish signals:
Average Confidence (▲ or ▼) : Basic signal that meets the minimum pattern and filtering criteria. These signals indicate potential reversals but with moderate confidence in the prediction. Consider using these as initial alerts that may require additional confirmation.
Above Average Confidence (▲+ or ▼+) : Higher reliability signal with stronger underlying metrics. These signals demonstrate greater consensus among the ensemble components and/or stronger historical performance. They offer increased probability of successful reversals and can be traded with less additional confirmation.
Excellent Confidence (▲++ or ▼++) : Highest quality signals with exceptional underlying metrics. These signals show strong agreement across oscillator components, excellent historical performance, and optimal signal strength. These represent the indicator’s highest conviction trade opportunities and can be prioritized in your trading decisions.
Confidence assessment is calculated through a multi-factor analysis including:
Historical performance of ensemble components
Degree of agreement between different oscillator components
Relative strength of the signal compared to historical thresholds
✅ Best Use Cases:
Identify potential market reversals through oscillator extremes
Filter trade signals based on AI-evaluated component weights
Monitor changing market conditions through oscillator direction and intensity
Confirm trade signals from other indicators with adaptive ensemble validation
Detect early momentum shifts through pattern recognition
Prioritize trading opportunities based on signal confidence levels
Adjust position sizing according to signal confidence (larger for ++ signals, smaller for standard signals)
⚠️ Limitations
Requires sufficient historical data for accurate performance scoring
Ensemble weights may lag during dramatic market condition changes
Higher ensemble sizes require more computational resources
Performance evaluation quality depends on the learning lookback period length
Even high confidence signals should be considered within broader market context
💡 What Makes This Unique
Adaptive Intelligence : Continuously adjusts component weights based on actual performance
Ensemble Methodology : Combines strength of multiple indicators while minimizing individual weaknesses
Volatility-Adjusted Smoothing : Provides appropriate sensitivity across different market conditions
Performance-Based Learning : Utilizes historical accuracy to improve future predictions
Intelligent Signal Filtering : Reduces noise and false signals through sophisticated filtering criteria
Multi-Level Confidence Assessment : Delivers nuanced signal quality information for optimized trading decisions
🔬 How It Works
The indicator processes market data through five main components:
Ensemble Component Calculation :
Normalizes traditional indicators to consistent scale
Includes RSI, CCI, Stochastic, MACD, and volume components
Adapts based on the selected ensemble size
Performance Evaluation :
Analyzes directional accuracy of each component
Calculates continuous performance scores
Determines adaptive component weights
Oscillator Integration :
Combines weighted components into unified oscillator
Applies volatility-based adaptive smoothing
Scales final values to -6 to 6 range
Signal Generation :
Detects potential reversal patterns
Applies cooldown and magnitude filters
Generates clear visual markers for qualified signals
Confidence Assessment :
Evaluates component agreement, historical accuracy, and signal strength
Classifies signals into three confidence tiers (average, above average, excellent)
Displays intuitive confidence indicators (no symbol, +, ++) alongside direction markers
💡 Note:
The AI Adaptive Oscillator performs optimally when used with appropriate timeframe selection and complementary indicators. Its adaptive nature makes it particularly valuable during changing market conditions, where traditional fixed-weight indicators often lose effectiveness. The ensemble approach provides a more robust analysis by leveraging the collective intelligence of multiple technical methodologies. Pay special attention to the signal confidence indicators to optimize your trading decisions - excellent (++) signals often represent the most reliable trade opportunities.

Bayesian TrendEnglish Description (primary)
1. Overview
This script implements a Naive Bayesian classifier to estimate the probability of an upcoming bullish, bearish, or neutral move. It combines multiple indicators—RSI, MACD histogram, EMA price difference in ATR units, ATR level vs. its average, and Volume vs. its average—to calculate likelihoods for each market direction. Each indicator is “binned” (categorized into discrete zones) and assigned conditional probabilities for bullish/bearish/neutral scenarios. The script then normalizes these probabilities and paints bars in green if bullish is most likely, red if bearish is most likely, or blue if neutral is most likely. A small table is also displayed in the top-right corner of the chart, showing real-time probabilities.
2. How it works
Indicator Calculations: The script calculates RSI, MACD (line and histogram), EMA, ATR, and Volume metrics.
Binning: Each metric is converted into a discrete category (e.g., low, medium, high). For example, RSI < 30 is binned as “low,” while RSI > 70 is binned as “high.”
Conditional Probabilities: User-defined tables specify the conditional probabilities of each bin under three hypotheses (Up, Down, Neutral).
Naive Bayesian Formula: The script multiplies the relevant conditional probabilities, normalizes them, and derives the final probabilities (Up, Down, or Neutral).
Visualization:
Bar Colors: Bars are green when the Up probability exceeds 50%, red for Down, and blue otherwise.
Table: Displays numeric probabilities of Up, Down, and Neutral in percentage terms.
3. How to use it
Add the script to your chart.
Observe the colored bars:
Green suggests a higher probability for bullish movement.
Red suggests a higher probability for bearish movement.
Blue indicates a higher probability of sideways or uncertain conditions.
Check the table in the top-right corner to see exact probabilities (Up/Down/Neutral).
Use the input settings to adjust thresholds (RSI, MACD, Volume, etc.), define alert conditions (e.g., when Up probability crosses 50%), and decide whether to trigger alerts on bar close or in real-time.
4. Originality and usefulness
Originality: This script uniquely applies a Naive Bayesian approach to a blend of classic and volume-based indicators. It demonstrates how different indicator “zones” can be combined to produce probabilistic insights.
Usefulness: Traders can interpret the probability breakdown to gauge the script’s bias. Unlike single indicators, this approach synthesizes several signals, potentially offering a more holistic perspective on market conditions.
5. Limitations
The conditional probabilities are manually assigned and may not reflect actual market behavior across all instruments or timeframes.
Results depend on the user’s choice of thresholds and indicator settings.
Like any indicator, past performance does not guarantee future results. Always confirm signals with additional analysis.
6. Disclaimer
This script is intended for educational and informational purposes only. It does not constitute financial advice. Trading involves significant risk, and you should make decisions based on your own analysis. Neither the script’s author nor TradingView is liable for any financial losses.
Русское описание (Russian translation, optional)
Этот индикатор реализует наивный Байесовский классификатор для оценки вероятности предстоящего роста (Up), падения (Down) или бокового движения (Neutral). Он комбинирует несколько индикаторов—RSI, гистограмму MACD, разницу цены и EMA в единицах ATR, уровень ATR относительно своего среднего значения и объём относительно своего среднего—чтобы вычислить вероятности для каждого направления рынка. Каждый индикатор делится на «зоны» (low, mid, high), которым приписаны условные вероятности для бычьего/медвежьего/нейтрального исхода. Скрипт нормирует эти вероятности и раскрашивает бары в зелёный, красный или синий цвет в зависимости от того, какая вероятность выше. Также в правом верхнем углу отображается таблица с текущими значениями вероятностей.

SuperTrend + Relative Volume (Kernel Optimized)Introducing our new KDE Optimized Supertrend + Relative Volume Indicator!
This innovative indicator combines the power of the Supertrend indicator along with Relative Volume. It utilizes the Kernel Density Estimation (KDE) to estimate the probability of a candlestick marking a significant trend break or reversal.
❓How to Interpret the KDE %:
The KDE % is a crucial metric that reflects the likelihood that the current candlestick represents a true break in the SuperTrend line, supported by an increase in relative volume. It estimates the probability of a trend shift or continuation based on historical SuperTrend breaks and volume patterns:
Low KDE %: A lower probability that the current break is significant. Price action is less likely to reverse, and the trend may continue.
Moderate KDE - High KDE %: An increased possibility that a trend reversal or consolidation could occur. Traders should start watching for confirmation signals.
📌How Does It Work?
The SuperTrend indicator uses the Average True Range (ATR) to determine the direction of the trend and identifies when the price crosses the SuperTrend line, signaling a potential trend reversal. Here's how the KDE Optimized SuperTrend Indicator works:
SuperTrend Calculation: The SuperTrend indicator is calculated, and when the price breaks above (bullish) or below (bearish) the SuperTrend line, it is logged as a significant event.
Relative Volume: For each break in the SuperTrend line, we calculate the relative volume (current volume vs. the average volume over a defined period). High relative volume can suggest stronger confirmation of the trend break.
KDE Array Calculation: KDE is applied to the break points and relative volume data:
Define the KDE options: Bandwidth, Number of Steps, and Array Range (Array Max - Array Min).
Create a density range array using the defined number of steps, corresponding to potential break points.
Apply a Gaussian kernel function to the break points and volume data to estimate the likelihood of the trend break being significant.
KDE Value and Signal Generation: The KDE array is updated as each break occurs. The KDE % is calculated for the breakout candlestick, representing the likelihood of the trend break being significant. If the KDE value exceeds the defined activation threshold, a darker bullish or bearish arrow is plotted after bar confirmation. If the KDE value falls below the threshold, a more transparent arrow is drawn, indicating a possible but lower probability break.
⚙️Settings:
SuperTrend Settings:
ATR Length: The period over which the Average True Range (ATR) is calculated.
Multiplier: The multiplier applied to the ATR to determine the SuperTrend threshold.
KDE Settings:
Bandwidth: Determines the smoothness of the KDE function and the width of the influence of each break point.
Number of Bins (Steps): Defines the precision of the KDE algorithm, with higher values offering more detailed calculations.
KDE Threshold %: The level at which relative volume is considered significant for confirming a break.
Relative Volume Length: The number of historic candles used in calculating KDE %

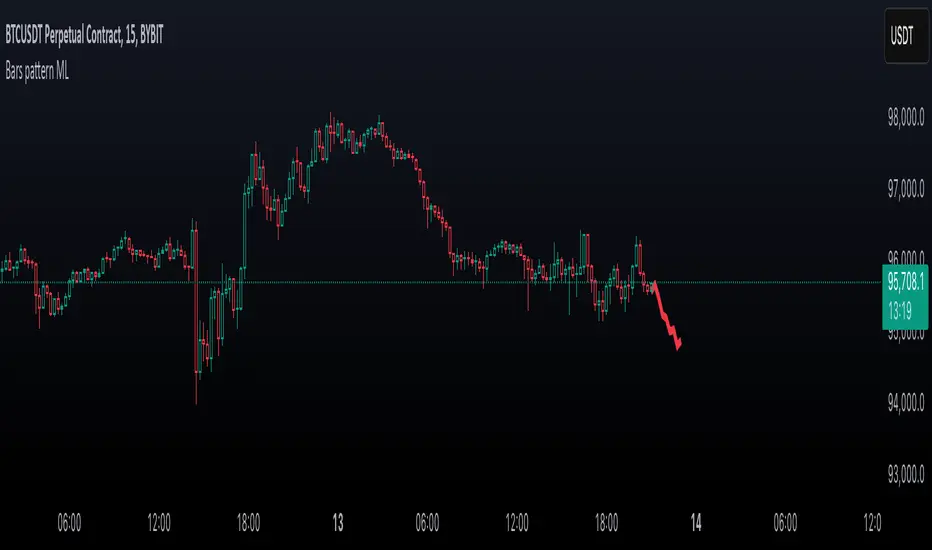
Bars pattern MLThis script implements a K-Nearest Neighbors (KNN)-based machine learning model to predict future price movements in financial markets. It analyzes past price action using Euclidean distance and selects the most similar historical patterns to estimate future price changes. Unlike traditional KNN implementations, this approach optimizes distance calculations by maintaining a dynamically updated list of the closest neighbors, ensuring efficient selection without the need for sorting. The model generates a forecasted price trajectory based on incremental predictions, which are visualized on the chart using polylines for better interpretability.
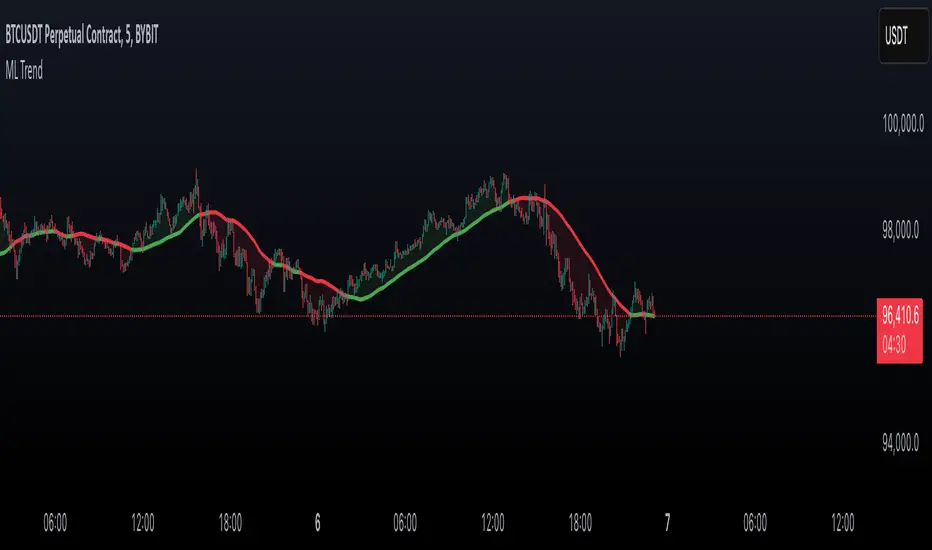
Machine Learning: kNN Trend PredictorThe kNN Trend Predictor is a machine learning-based indicator that uses the k-Nearest Neighbors (kNN) algorithm for price prediction in trading. By analyzing historical price movements and computing Euclidean distances, the script identifies the closest past price patterns and forecasts potential trends. It provides color-coded trend signals, optional trade entry labels, and alerts for long and short signals.
Naive Bayes Candlestick Pattern Classifier v1.1 BETAAn intermezzo on why i made this script publication..
A : Candlestick Pattern took hours to backtest, why not using Machine Learning techniques?
B : Machine Learning, no that's gonna be really heavy bro!
A : Not really, because we use Naive Bayes.
B : The simplest, yet powerful machine learning algorithm to separate (a.k.a classify) multivariate data.
----------------------------------------------------------------------------------------------------------------------
Hello, everyone!
After deep research in extracting meaningful information from the market, I ended up building this powerful machine learning indicator based on the evolution of Bayesian Statistics. This indicator not only leverages the simplicity of Naive Bayes but also extends its application to candlestick pattern analysis, making it an invaluable tool for traders who are looking to enhance their technical analysis without spending countless hours manually backtesting each pattern on each market!.
What most interesting part is actually after learning all of likely useless methods like fibonacci, supply and demand, volume profile, etc. We always ended up back to basic like support and resistance and candlestick patterns, but with a slight twist on strategy algorithm design and statistical approach. Thus, the only reason why i made this, because i exactly know that you guys will ended up in this position as time goes by.
The essence of this indicator lies in its ability to automate the recognition and statistical evaluation of various candlestick patterns. Traditionally, traders have relied on visual inspection and manual backtesting to determine the effectiveness of patterns like Bullish Engulfing, Bearish Engulfing, Harami variations, Hammer formations, and even more complex multi-candle patterns such as Three White Soldiers, Three Black Crows, Dark Cloud Cover, and Piercing Pattern. However, these conventional methods are both time-consuming and prone to subjective bias.
To address these challenges, I employed Naive Bayes—a probabilistic classifier that, despite its simplicity, offers robust performance in various domains. Naive Bayes assumes that each feature is independent of the others given the class label, which, although a strong assumption, works remarkably well in practice, especially when the dataset is large like market data and the feature space is high-dimensional. In our case, each candlestick pattern acts as a feature that can be statistically evaluated based on its historical performance. The indicator calculates a probability that a given pattern will lead to a price reversal, by comparing the pattern’s close price to the highest or lowest price achieved in a lookahead window.
One of the standout features of this script is its flexibility. Each candlestick pattern is not only coded into the system but also comes with individual toggles to enable or disable them based on your trading strategy. This means you can choose to focus on single-candle patterns like Bullish Engulfing or more complex multi-candle formations such as Three White Soldiers, without modifying the core code. The built-in customization options allow you to adjust colors and labels for each pattern, giving you the freedom to tailor the visual output to your preference. This level of customization ensures that the indicator integrates seamlessly into your existing TradingView setup.
Moreover, the indicator isn’t just about pattern recognition—it also incorporates outcome-based learning. Every time a pattern is detected, it looks ahead a predefined number of bars to evaluate if the expected reversal actually materialized. This outcome is then stored in arrays, and over time, the script dynamically calculates the probability of success for each pattern. These probabilities are presented in a real-time updating table on your chart, which shows not only the percentage probability but also the count of historical occurrences. With this information at your fingertips, you can quickly gauge the reliability of each pattern in your chosen market and timeframe.
Another significant advantage of this approach is its speed and efficiency. While more complex machine learning models like neural networks might require heavy computational resources and longer training times, the Naive Bayes classifier in this script is lightweight, instantaneous and can be updated on the fly with each new bar. This real-time capability is essential for modern traders who need to make quick decisions in fast-paced markets.
Furthermore, by automating the process of backtesting, the indicator frees up your time to focus on other aspects of trading strategy development. Instead of manually analyzing hundreds or even thousands of candles, you can rely on the statistical power of Naive Bayes to provide you with insights on which patterns are most likely to result in profitable moves. This not only enhances your efficiency but also helps to eliminate the cognitive biases that often plague manual analysis.
In summary, this indicator represents a fusion of traditional candlestick analysis with modern machine learning techniques. It harnesses the simplicity and effectiveness of Naive Bayes to deliver a dynamic, real-time evaluation of various candlestick patterns. Whether you are a seasoned trader looking to refine your technical analysis or a beginner eager to understand market dynamics, this tool offers a powerful, customizable, and efficient solution. Welcome to a new era where advanced statistical methods meet practical trading insights—happy trading and may your patterns always be in your favor!
Note : On this current released beta version, you must manually adjust reversal percentage move based on each market. Further updates may include automated best range detection and probability.

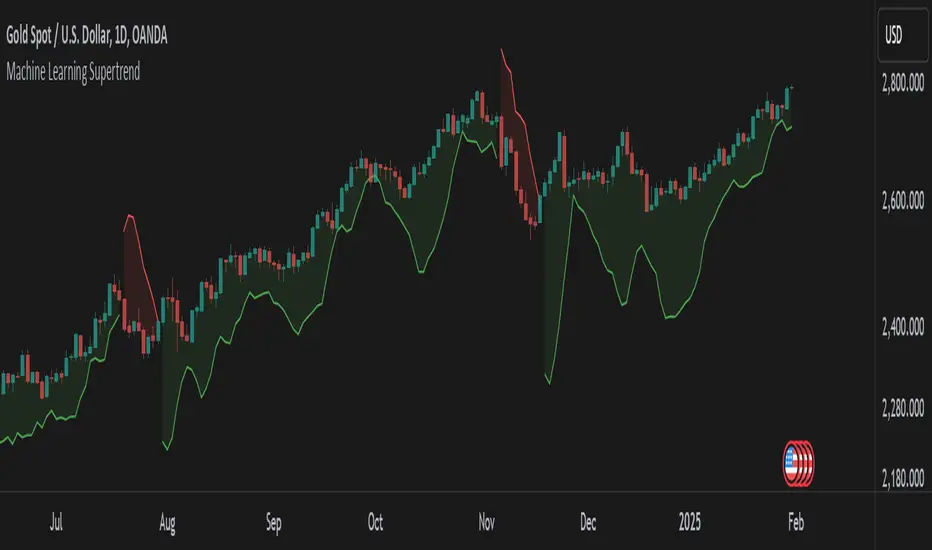
Machine Learning SupertrendThe Machine Learning Supertrend is an advanced trend-following indicator that enhances the traditional Supertrend with Gaussian Process Regression (GPR) and kernel-based learning. Unlike conventional methods that rely purely on historical ATR values, this indicator integrates machine learning techniques to dynamically estimate volatility and forecast future price movements, resulting in a more adaptive and robust trend detection system.
At the core of this indicator lies Gaussian Process Regression (GPR), which utilizes a Radial Basis Function (RBF) kernel to model price distributions and anticipate future trends. Instead of simply looking at past price action, it constructs a kernel matrix, enabling a probabilistic approach to price forecasting. This allows the indicator to not only detect current trends but also project potential trend reversals with greater accuracy.
By applying machine learning to ATR estimation, the ML Supertrend dynamically adjusts its thresholds based on predicted values rather than a fixed multiplier. This makes the trend signals more responsive to market conditions, reducing false signals and minimizing whipsaws often seen with traditional Supertrend indicators. The upper and lower bands are no longer static but evolve based on the underlying price structure, improving the reliability of trend shifts.
When the price crosses these adaptive levels, the indicator detects a trend change and plots it accordingly. Green signifies a bullish trend, while red indicates a bearish one. Alerts can also be triggered when the trend shifts, allowing traders to react quickly to potential reversals.
What makes this approach powerful is its ability to adapt to different market conditions. Traditional ATR-based methods use fixed parameters that might not always be optimal, whereas this ML-driven Supertrend continuously refines its estimations based on real-time data. The result is a more intelligent, less lagging, and highly adaptive trend-following tool.
This indicator is particularly useful for traders looking to enhance trend-following strategies with AI-driven insights. It reduces noise, improves signal reliability, and even offers a degree of trend forecasting, making it ideal for those who want a more advanced and dynamic alternative to standard Supertrend indicators.
This indicator is provided for educational and informational purposes only. It does not constitute financial advice, and past performance is not indicative of future results. Trading involves risk, and users should conduct their own research and use proper risk management before making investment decisions.
Johnny's Machine Learning Moving Average (MLMA) w/ Trend Alerts📖 Overview
Johnny's Machine Learning Moving Average (MLMA) w/ Trend Alerts is a powerful adaptive moving average indicator designed to capture market trends dynamically. Unlike traditional moving averages (e.g., SMA, EMA, WMA), this indicator incorporates volatility-based trend detection, Bollinger Bands, ADX, and RSI, offering a comprehensive view of market conditions.
The MLMA is "machine learning-inspired" because it adapts dynamically to market conditions using ATR-based windowing and integrates multiple trend strength indicators (ADX, RSI, and volatility bands) to provide an intelligent moving average calculation that learns from recent price action rather than being static.
🛠 How It Works
1️⃣ Adaptive Moving Average Selection
The MLMA automatically selects one of four different moving averages:
📊 EMA (Exponential Moving Average) – Reacts quickly to price changes.
🔵 HMA (Hull Moving Average) – Smooth and fast, reducing lag.
🟡 WMA (Weighted Moving Average) – Gives recent prices more importance.
🔴 VWAP (Volume Weighted Average Price) – Accounts for volume impact.
The user can select which moving average type to use, making the indicator customizable based on their strategy.
2️⃣ Dynamic Trend Detection
ATR-Based Adaptive Window 📏
The Average True Range (ATR) determines the window size dynamically.
When volatility is high, the moving average window expands, making the MLMA more stable.
When volatility is low, the window shrinks, making the MLMA more responsive.
Trend Strength Filters 📊
ADX (Average Directional Index) > 25 → Indicates a strong trend.
RSI (Relative Strength Index) > 70 or < 30 → Identifies overbought/oversold conditions.
Price Position Relative to Upper/Lower Bands → Determines bullish vs. bearish momentum.
3️⃣ Volatility Bands & Dynamic Support/Resistance
Bollinger Bands (BB) 📉
Uses standard deviation-based bands around the MLMA to detect overbought and oversold zones.
Upper Band = Resistance, Lower Band = Support.
Helps traders identify breakout potential.
Adaptive Trend Bands 🔵🔴
The MLMA has built-in trend envelopes.
When price breaks the upper band, bullish momentum is confirmed.
When price breaks the lower band, bearish momentum is confirmed.
4️⃣ Visual Enhancements
Dynamic Gradient Fills 🌈
The trend strength (ADX-based) determines the gradient intensity.
Stronger trends = More vivid colors.
Weaker trends = Lighter colors.
Trend Reversal Arrows 🔄
🔼 Green Up Arrow: Bullish reversal signal.
🔽 Red Down Arrow: Bearish reversal signal.
Trend Table Overlay 🖥
Displays ADX, RSI, and Trend State dynamically on the chart.
📢 Trading Signals & How to Use It
1️⃣ Bullish Signals 📈
✅ Conditions for a Long (Buy) Trade:
The MLMA crosses above the lower band.
The ADX is above 25 (confirming trend strength).
RSI is above 55, indicating positive momentum.
Green trend reversal arrow appears (confirmation of a bullish reversal).
🔹 How to Trade It:
Enter a long trade when the MLMA turns bullish.
Set stop-loss below the lower Bollinger Band.
Target previous resistance levels or use the upper band as take-profit.
2️⃣ Bearish Signals 📉
✅ Conditions for a Short (Sell) Trade:
The MLMA crosses below the upper band.
The ADX is above 25 (confirming trend strength).
RSI is below 45, indicating bearish pressure.
Red trend reversal arrow appears (confirmation of a bearish reversal).
🔹 How to Trade It:
Enter a short trade when the MLMA turns bearish.
Set stop-loss above the upper Bollinger Band.
Target the lower band as take-profit.
💡 What Makes This a Machine Learning Moving Average?
📍 1️⃣ Adaptive & Self-Tuning
Unlike static moving averages that rely on fixed parameters, this MLMA automatically adjusts its sensitivity to market conditions using:
ATR-based dynamic windowing 📏 (Expands/contracts based on volatility).
Adaptive smoothing using EMA, HMA, WMA, or VWAP 📊.
Multi-indicator confirmation (ADX, RSI, Volatility Bands) 🏆.
📍 2️⃣ Intelligent Trend Confirmation
The MLMA "learns" from recent price movements instead of blindly following a fixed-length average.
It incorporates ADX & RSI trend filtering to reduce noise & false signals.
📍 3️⃣ Dynamic Color-Coding for Trend Strength
Strong trends trigger more vivid colors, mimicking confidence levels in machine learning models.
Weaker trends appear faded, suggesting uncertainty.
🎯 Why Use the MLMA?
✅ Pros
✔ Combines multiple trend indicators (MA, ADX, RSI, BB).
✔ Automatically adjusts to market conditions.
✔ Filters out weak trends, making it more reliable.
✔ Visually intuitive (gradient colors & reversal arrows).
✔ Works across all timeframes and assets.
⚠️ Cons
❌ Not a standalone strategy → Best used with volume confirmation or candlestick analysis.
❌ Can lag slightly in fast-moving markets (due to smoothing).

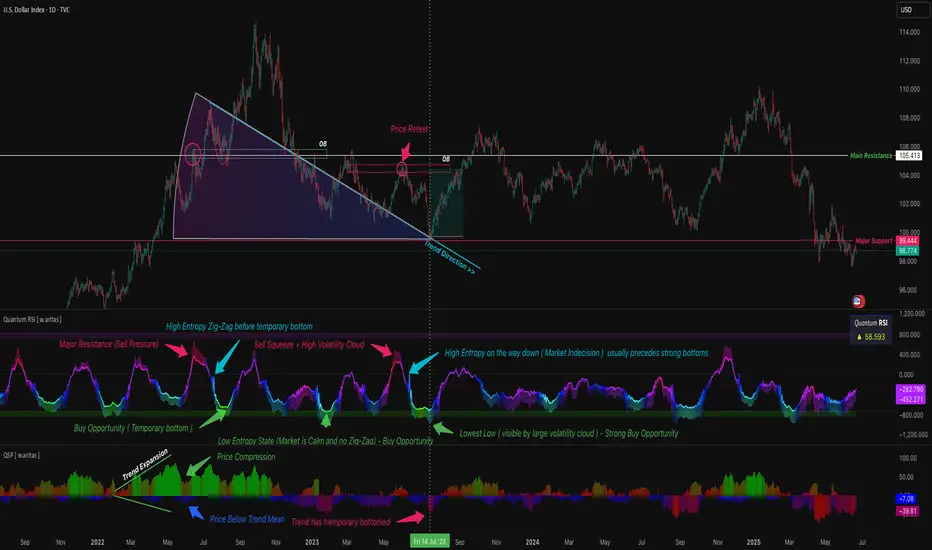
QT RSI [ W.ARITAS ]The QT RSI is an innovative technical analysis indicator designed to enhance precision in market trend identification and decision-making. Developed using advanced concepts in quantum mechanics, machine learning (LSTM), and signal processing, this indicator provides actionable insights for traders across multiple asset classes, including stocks, crypto, and forex.
Key Features:
Dynamic Color Gradient: Visualizes market conditions for intuitive interpretation:
Green: Strong buy signal indicating bullish momentum.
Blue: Neutral or observation zone, suggesting caution or lack of a clear trend.
Red: Strong sell signal indicating bearish momentum.
Quantum-Enhanced RSI: Integrates adaptive energy levels, dynamic smoothing, and quantum oscillators for precise trend detection.
Hybrid Machine Learning Model: Combines LSTM neural networks and wavelet transforms for accurate prediction and signal refinement.
Customizable Settings: Includes advanced parameters for dynamic thresholds, sensitivity adjustment, and noise reduction using Kalman and Jurik filters.
How to Use:
Interpret the Color Gradient:
Green Zone: Indicates bullish conditions and potential buy opportunities. Look for upward momentum in the RSI plot.
Blue Zone: Represents a neutral or consolidation phase. Monitor the market for trend confirmation.
Red Zone: Indicates bearish conditions and potential sell opportunities. Look for downward momentum in the RSI plot.
Follow Overbought/Oversold Boundaries:
Use the upper and lower RSI boundaries to identify overbought and oversold conditions.
Leverage Advanced Filtering:
The smoothed signals and quantum oscillator provide a robust framework for filtering false signals, making it suitable for volatile markets.
Application: Ideal for traders and analysts seeking high-precision tools for:
Identifying entry and exit points.
Detecting market reversals and momentum shifts.
Enhancing algorithmic trading strategies with cutting-edge analytics.
Machine Learning Moving Average [LuxAlgo]The Machine Learning Moving Average (MLMA) is a responsive moving average making use of the weighting function obtained Gaussian Process Regression method. Characteristic such as responsiveness and smoothness can be adjusted by the user from the settings.
The moving average also includes bands, used to highlight possible reversals.
🔶 USAGE
The Machine Learning Moving Average smooths out noisy variations from the price, directly estimating the underlying trend in the price.
A higher "Window" setting will return a longer-term moving average while increasing the "Forecast" setting will affect the responsiveness and smoothness of the moving average, with higher positive values returning a more responsive moving average and negative values returning a smoother but less responsive moving average.
Do note that an excessively high "Forecast" setting will result in overshoots, with the moving average having a poor fit with the price.
The moving average color is determined according to the estimated trend direction based on the bands described below, shifting to blue (default) in an uptrend and fushia (default) in downtrends.
The upper and lower extremities represent the range within which price movements likely fluctuate.
Signals are generated when the price crosses above or below the band extremities, with turning points being highlighted by colored circles on the chart.
🔶 SETTINGS
Window: Calculation period of the moving average. Higher values yield a smoother average, emphasizing long-term trends and filtering out short-term fluctuations.
Forecast: Sets the projection horizon for Gaussian Process Regression. Higher values create a more responsive moving average but will result in more overshoots, potentially worsening the fit with the price. Negative values will result in a smoother moving average.
Sigma: Controls the standard deviation of the Gaussian kernel, influencing weight distribution. Higher Sigma values return a longer-term moving average.
Multiplicative Factor: Adjusts the upper and lower extremity bounds, with higher values widening the bands and lowering the amount of returned turning points.
🔶 RELATED SCRIPTS
Machine-Learning-Gaussian-Process-Regression
SuperTrend-AI-Clustering

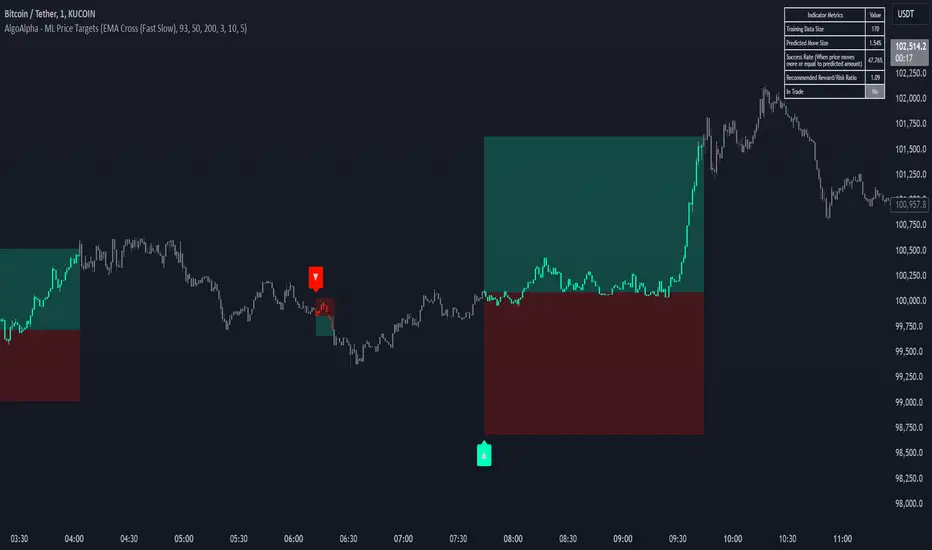
Machine Learning Price Target Prediction Signals [AlgoAlpha]Introducing the Machine Learning Price Target Predictions, a cutting-edge trading tool that leverages kernel regression to provide accurate price targets and enhance your trading strategy. This indicator combines trend-based signals with advanced machine learning techniques, offering predictive insights into potential price movements. Perfect for traders looking to make data-driven decisions with confidence.
What is Kernel Regression and How It Works
Kernel regression is a non-parametric machine learning technique that estimates the relationship between variables by weighting data points based on their similarity to a given input. The similarity is determined using a kernel function, such as the Gaussian (RBF) kernel, which assigns higher weights to closer data points and progressively lower weights to farther ones. This allows the model to make smooth and adaptive predictions, balancing recent data and historical trends.
Key Features
🎯 Predictive Price Targets : Uses kernel regression to estimate the magnitude of price movements.
📈 Dynamic Trend Analysis : Multiple trend detection methods, including EMA crossovers, Hull Moving Average, and SuperTrend.
🔧 Customizable Settings : Adjust bandwidth for kernel regression and tweak trend indicator parameters to suit your strategy.
📊 Visual Trade Levels : Displays take-profit and stop-loss levels directly on the chart with customizable colors.
📋 Performance Metrics : Real-time win rate, recommended risk-reward ratio, and training data size displayed in an on-chart table.
🔔 Alerts : Get notified for new trends, take-profit hits, and stop-loss triggers.
How to Use
🛠 Add the Indicator : Add it to your favorites and apply it to your chart. Configure the trend detection method (SuperTrend, HMA, or EMA crossover) and other parameters based on your preferences.
📊 Analyze Predictions : Observe the predicted move size, recommended risk-reward ratio, and trend direction. Use the displayed levels for trade planning.
🔔 Set Alerts : Enable alerts for trend signals, take-profit hits, or stop-loss triggers to stay informed without constant monitoring.
How It Works
The indicator calculates features such as price volatility, relative strength, and trend signals, which are stored during training periods. When a trend change is detected, the kernel regression model predicts the likely price move based on these features. Predictions are smoothed using the specified bandwidth to avoid overfitting while ensuring timely responses to feature changes. Visualized take-profit and stop-loss levels help traders optimize risk management. Real-time metrics like win rate and recommended risk-reward ratios provide actionable insights for decision-making.
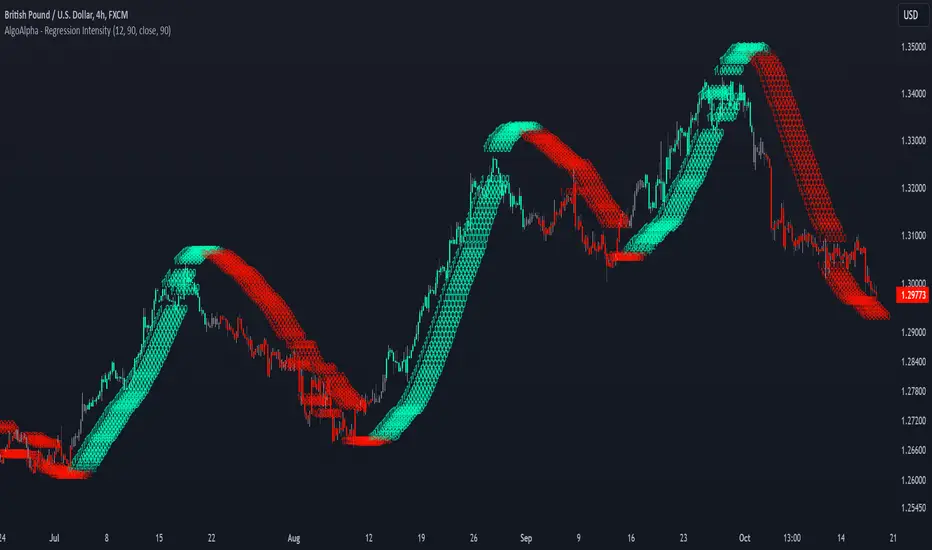
Linear Regression Intensity [AlgoAlpha]Introducing the Linear Regression Intensity indicator by AlgoAlpha, a sophisticated tool designed to measure and visualize the strength of market trends using linear regression analysis. This indicator not only identifies bullish and bearish trends with precision but also quantifies their intensity, providing traders with deeper insights into market dynamics. Whether you’re a novice trader seeking clearer trend signals or an experienced analyst looking for nuanced trend strength indicators, Linear Regression Intensity offers the clarity and detail you need to make informed trading decisions.
Key Features:
📊 Comprehensive Trend Analysis: Utilizes linear regression over customizable periods to assess and quantify trend strength.
🎨 Customizable Appearance: Choose your preferred colors for bullish and bearish trends to align with your trading style.
🔧 Flexible Parameters: Adjust the lookback period, range tolerance, and regression length to tailor the indicator to your specific strategy.
📉 Dynamic Bar Coloring: Instantly visualize trend states with color-coded bars—green for bullish, red for bearish, and gray for neutral.
🏷️ Intensity Labels: Displays dynamic labels that represent the intensity of the current trend, helping you gauge market momentum at a glance.
🔔 Alert Conditions: Set up alerts for strong bullish or bearish trends and trend neutrality to stay ahead of market movements without constant monitoring.
Quick Guide to Using Linear Regression Intensity:
🛠 Add the Indicator: Simply add Linear Regression Intensity to your TradingView chart from your favorites. Customize the settings such as lookback period, range tolerance, and regression length to fit your trading approach.
📈 Market Analysis: Observe the color-coded bars to quickly identify the current trend state. Use the intensity labels to understand the strength behind each trend, allowing for more strategic entry and exit points.
🔔 Set Up Alerts: Enable alerts for when strong bullish or bearish trends are detected or when the trend reaches a neutral zone. This ensures you never miss critical market movements, even when you’re away from the chart.
How It Works:
The Linear Regression Intensity indicator leverages linear regression to calculate the underlying trend of a selected price source over a specified length. By analyzing the consistency of the regression values within a defined lookback period, it determines the trend’s intensity based on a percentage tolerance. The indicator aggregates pairwise comparisons of regression values to assess whether the trend is predominantly upward or downward, assigning a state of bullish, bearish, or neutral accordingly. This state is then visually represented through dynamic bar colors and intensity labels, offering a clear and immediate understanding of market conditions. Additionally, the inclusion of Average True Range (ATR) ensures that the intensity visualization accounts for market volatility, providing a more robust and reliable trend assessment. With customizable settings and alert conditions, Linear Regression Intensity empowers traders to fine-tune their strategies and respond swiftly to evolving market trends.
Elevate your trading strategy with Linear Regression Intensity and gain unparalleled insights into market trends! 🌟📊
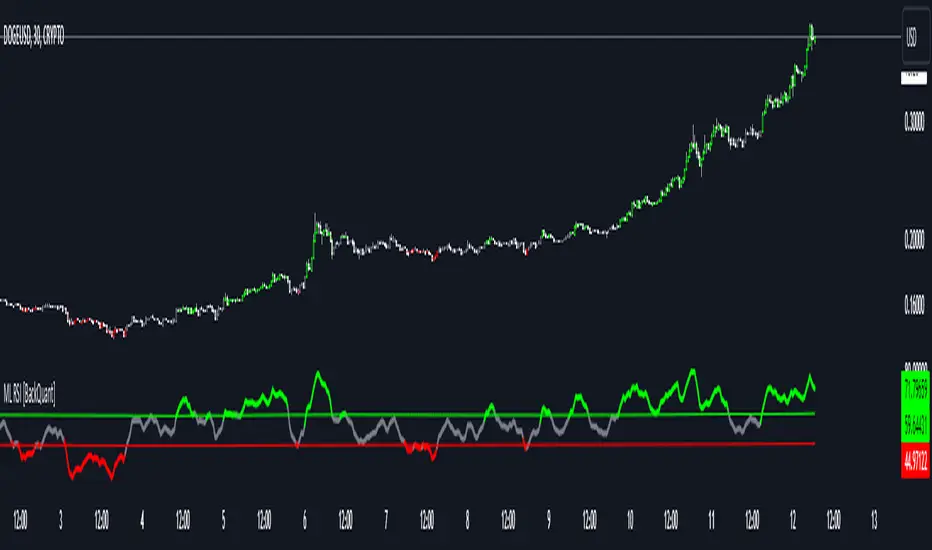
Machine Learning RSI [BackQuant]Machine Learning RSI
The Machine Learning RSI is a cutting-edge trading indicator that combines the power of Relative Strength Index (RSI) with Machine Learning (ML) clustering techniques to dynamically determine overbought and oversold thresholds. This advanced indicator adapts to market conditions in real-time, offering traders a robust tool for identifying optimal entry and exit points with increased precision.
Core Concept: Relative Strength Index (RSI)
The RSI is a well-known momentum oscillator that measures the speed and change of price movements, oscillating between 0 and 100. Typically, RSI values above 70 are considered overbought, and values below 30 are considered oversold. However, static thresholds may not be effective in all market conditions.
This script enhances the RSI by integrating a dynamic thresholding system powered by Machine Learning clustering, allowing it to adapt thresholds based on historical RSI behavior and market context.
Machine Learning Clustering for Dynamic Thresholds
The Machine Learning (ML) component uses clustering to calculate dynamic thresholds for overbought and oversold levels. Instead of relying on fixed RSI levels, this indicator clusters historical RSI values into three groups using a percentile-based initialization and iterative optimization:
Cluster 1: Represents lower RSI values (typically associated with oversold conditions).
Cluster 2: Represents mid-range RSI values.
Cluster 3: Represents higher RSI values (typically associated with overbought conditions).
Dynamic thresholds are determined as follows:
Long Threshold: The upper centroid value of Cluster 3.
Short Threshold: The lower centroid value of Cluster 1.
This approach ensures that the indicator adapts to the current market regime, providing more accurate signals in volatile or trending conditions.
Smoothing Options for RSI
To further enhance the effectiveness of the RSI, this script allows traders to apply various smoothing methods to the RSI calculation, including:
Simple Moving Average (SMA)
Exponential Moving Average (EMA)
Weighted Moving Average (WMA)
Hull Moving Average (HMA)
Linear Regression (LINREG)
Double Exponential Moving Average (DEMA)
Triple Exponential Moving Average (TEMA)
Adaptive Linear Moving Average (ALMA)
T3 Moving Average
Traders can select their preferred smoothing method and adjust the smoothing period to suit their trading style and market conditions. The option to smooth the RSI reduces noise and makes the indicator more reliable for detecting trends and reversals.
Long and Short Signals
The indicator generates long and short signals based on the relationship between the RSI value and the dynamic thresholds:
Long Signals: Triggered when the RSI crosses above the long threshold, signaling bullish momentum.
Short Signals: Triggered when the RSI falls below the short threshold, signaling bearish momentum.
These signals are dynamically adjusted to reflect real-time market conditions, making them more robust than static RSI signals.
Visualization and Clustering Insights
The Machine Learning RSI provides an intuitive and visually rich interface, including:
RSI Line: Plotted in real-time, color-coded based on its position relative to the dynamic thresholds (green for long, red for short, gray for neutral).
Dynamic Threshold Lines: The script plots the long and short thresholds calculated by the ML clustering process, providing a clear visual reference for overbought and oversold levels.
Cluster Plots: Each RSI cluster is displayed with distinct colors (green, orange, and red) to give traders insights into how RSI values are grouped and how the dynamic thresholds are derived.
Customization Options
The Machine Learning RSI is highly customizable, allowing traders to tailor the indicator to their preferences:
RSI Settings : Adjust the RSI length, source price, and smoothing method to match your trading strategy.
Threshold Settings : Define the range and step size for clustering thresholds, allowing you to fine-tune the clustering process.
Optimization Settings : Control the performance memory, maximum clustering steps, and maximum data points for ML calculations to ensure optimal performance.
UI Settings : Customize the appearance of the RSI plot, dynamic thresholds, and cluster plots. Traders can also enable or disable candle coloring based on trend direction.
Alerts and Automation
To assist traders in staying on top of market movements, the script includes alert conditions for key events:
Long Signal: When the RSI crosses above the long threshold.
Short Signal: When the RSI crosses below the short threshold.
These alerts can be configured to notify traders in real-time, enabling timely decisions without constant chart monitoring.
Trading Applications
The Machine Learning RSI is versatile and can be applied to various trading strategies, including:
Trend Following: By dynamically adjusting thresholds, this indicator is effective in identifying and following trends in real-time.
Reversal Trading: The ML clustering process helps identify extreme RSI levels, offering reliable signals for reversals.
Range-Bound Trading: The dynamic thresholds adapt to market conditions, making the indicator suitable for trading in sideways markets where static thresholds often fail.
Final Thoughts
The Machine Learning RSI represents a significant advancement in RSI-based trading indicators. By integrating Machine Learning clustering techniques, this script overcomes the limitations of static thresholds, providing dynamic, adaptive signals that respond to market conditions in real-time. With its robust visualization, customizable settings, and alert capabilities, this indicator is a powerful tool for traders seeking to enhance their momentum analysis and improve decision-making.
As always, thorough backtesting and integration into a broader trading strategy are recommended to maximize the effectiveness!
Weekly RSI Buy/Sell SignalsWeekly RSI Buy/Sell Signal Indicator
This indicator is designed to help traders identify high-probability buy and sell opportunities on the weekly chart by using the Relative Strength Index (RSI). By utilizing weekly RSI values, this indicator ensures signals align with broader market trends, providing a clearer view of potential price reversals and continuation.
How It Works:
Weekly RSI Calculation: This script calculates the RSI using a 14-period setting, focusing on the weekly timeframe regardless of the user’s current chart view. The weekly RSI is derived using request.security, allowing for consistent signals even on intraday charts.
Signal Conditions:
Buy Signal: A buy signal appears when the RSI crosses above the oversold threshold of 30, suggesting that price may be gaining momentum after a potential bottom.
Sell Signal: A sell signal triggers when the RSI crosses below the overbought threshold of 70, indicating a possible momentum shift downwards.
Visual Cues:
Buy/Sell Markers: Clear green "BUY" and red "SELL" markers are displayed on the chart when buy or sell conditions are met, making it easy to identify entry and exit points.
RSI Line and Thresholds: The weekly RSI value is plotted in real time with color-coded horizontal lines at 30 (oversold) and 70 (overbought), providing a visual reference for key levels.
This indicator is ideal for traders looking for reliable, trend-based signals on higher timeframes and can be a helpful tool for filtering out shorter-term market noise.

Adaptive SuperTrend Oscillator [AlgoAlpha]Adaptive SuperTrend Oscillator 🤖📈
Introducing the Adaptive SuperTrend Oscillator , an innovative blend of volatility clustering and SuperTrend logic designed to identify market trends with precision! 🚀 This indicator uses K-Means clustering to dynamically adjust volatility levels, helping traders spot bullish and bearish trends. The oscillator smoothly tracks price movements, adapting to market conditions for reliable signals. Whether you're scalping or riding long-term trends, this tool has got you covered! 💹✨
🔑 Key Features:
📊 Volatility Clustering with K-Means: Segments volatility into three levels (high, medium, low) using a K-Means algorithm for precise trend detection.
📈 Normalized Oscillator : Allows for customizable smoothing and normalization, ensuring the oscillator remains within a fixed range for easy interpretation.
🔄 Heiken Ashi Candles : Optionally visualize smoothed trends with Heiken Ashi-style candlesticks to better capture market momentum.
🔔 Alert System : Get notified when key conditions like trend shifts or volatility changes occur.
🎨 Customizable Appearance : Fully customizable colors for bullish/bearish signals, along with adjustable smoothing methods and lengths.
📚 How to Use:
⭐ Add the indicator to favorites by pressing the star icon. Customize settings to your preference:
👀 Watch the chart for trend signals and reversals. The oscillator will change color when trends shift, offering visual confirmation.
🔔 Enable alerts to be notified of critical trend changes or volatility conditions
⚙️ How It Works:
This script integrates SuperTrend with volatility clustering by analyzing ATR (Average True Range) to dynamically identify high, medium, and low volatility clusters using a K-Means algorithm . The SuperTrend logic adjusts based on the assigned volatility level, creating adaptive trend signals. These signals are then smoothed and optionally normalized for clearer visual interpretation. The Heiken Ashi transformation adds an additional layer of smoothing, helping traders better identify the market's true momentum. Alerts are set to notify users of key trend shifts and volatility changes, allowing traders to react promptly.

RSI (Kernel Optimized) | Flux Charts💎 GENERAL OVERVIEW
Introducing our new KDE Optimized RSI Indicator! This indicator adds a new aspect to the well-known RSI indicator, with the help of the KDE (Kernel Density Estimation) algorithm, estimates the probability of a candlestick will be a pivot or not. For more information about the process, please check the "HOW DOES IT WORK ?" section.
Features of the new KDE Optimized RSI Indicator :
A New Approach To Pivot Detection
Customizable KDE Algorithm
Realtime RSI & KDE Dashboard
Alerts For Possible Pivots
Customizable Visuals
❓ HOW TO INTERPRET THE KDE %
The KDE % is a critical metric that reflects how closely the current RSI aligns with the KDE (Kernel Density Estimation) array. In simple terms, it represents the likelihood that the current candlestick is forming a pivot point based on historical data patterns. a low percentage suggests a lower probability of the current candlestick being a pivot point. In these cases, price action is less likely to reverse, and existing trends may continue. At moderate levels, the possibility of a pivot increases, indicating potential trend shifts or consolidations.Traders should start monitoring closely for confirmation signals. An even higher KDE % suggests a strong likelihood that the current candlestick could form a pivot point, which could lead to a reversal or significant price movement. These points often align with overbought or oversold conditions in traditional RSI analysis, making them key moments for potential trade entry or exit.
📌 HOW DOES IT WORK ?
The RSI (Relative Strength Index) is a widely used oscillator among traders. It outputs a value between 0 - 100 and gives a glimpse about the current momentum of the price action. This indicator then calculates the RSI for each candlesticks, and saves them into an array if the candlestick is a pivot. The low & high pivot RSIs' are inserted into two different arrays. Then the a KDE array is calculated for both of the low & high pivot RSI arrays. Explaining the KDE might be too much for this write-up, but for a brief explanation, here are the steps :
1. Define the necessary options for the KDE function. These are : Bandwidth & Nº Steps, Array Range (Array Max - Array Min)
2. After that, create a density range array. The array has (steps * 2 - 1) elements and they are calculated by (arrMin + i * stepCount), i being the index.
3. Then, define a kernel function. This indicator has 3 different kernel distribution modes : Uniform, Gaussian and Sigmoid
4. Then, define a temporary value for the current element of KDE array.
5. For each element E in the pivot RSI array, add "kernel(densityRange.get(i) - E, 1.0 / bandwidth)" to the temporary value.
6. Add 1.0 / arrSize * to the KDE array.
Then the prefix sum array of the KDE array is calculated. For each candlestick, the index closest to it's RSI value in the KDE array is found using binary search. Then for the low pivot KDE calculation, the sum of KDE values from found index to max index is calculated. For the high pivot KDE, the sum of 0 to found index is used. Then if high or low KDE value is greater than the activation threshold determined in the settings, a bearish or bullish arrow is plotted after bar confirmation respectively. The arrows are drawn as long as the KDE value of current candlestick is greater than the threshold. When the KDE value is out of the threshold, a less transparent arrow is drawn, indicating a possible pivot point.
🚩 UNIQUENESS
This indicator combines RSI & KDE Algorithm to get a foresight of possible pivot points. Pivot points are important entry, confirmation and exit points for traders. But to their nature, they can be only detected after more candlesticks are rendered after them. The purpose of this indicator is to alert the traders of possible pivot points using KDE algorithm right away when they are confirmed. The indicator also has a dashboard for realtime view of the current RSI & Bullish or Bearish KDE value. You can fully customize the KDE algorithm and set up alerts for pivot detection.
⚙️ SETTINGS
1. RSI Settings
RSI Length -> The amount of bars taken into account for RSI calculation.
Source -> The source value for RSI calculation.
2. Pivots
Pivot Lengths -> Pivot lengths for both high & low pivots. For example, if this value is set to 21; 21 bars before AND 21 bars after a candlestick must be higher for a candlestick to be a low pivot.
3. KDE
Activation Threshold -> This setting determines the amount of arrows shown. Higher options will result in more arrows being rendered.
Kernel -> The kernel function as explained in the upper section.
Bandwidth -> The bandwidth variable as explained in the upper section. The smoothness of the KDE function is tied to this setting.
Nº Bins -> The Nº Steps variable as explained in the upper section. It determines the precision of the KDE algorithm.

Machine Learning Signal FilterIntroducing the "Machine Learning Signal Filter," an innovative trading indicator designed to leverage the power of machine learning to enhance trading strategies. This tool combines advanced data processing capabilities with user-friendly customization options, offering traders a sophisticated yet accessible means to optimize their market analysis and decision-making processes. Importantly, this indicator does not repaint, ensuring that signals remain consistent and reliable after they are generated.
Machine Learning Integration
The "Machine Learning Signal Filter" employs machine learning algorithms to analyze historical price data and identify patterns that may not be immediately apparent through traditional technical analysis. By utilizing techniques such as regression analysis and neural networks, the indicator continuously learns from new data, refining its predictive capabilities over time. This dynamic adaptability allows the indicator to adjust to changing market conditions, potentially improving the accuracy of trading signals.
Key Features and Benefits
Dynamic Signal Generation: The indicator uses machine learning to generate buy and sell signals based on complex data patterns. This approach enables it to adapt to evolving market trends, offering traders timely and relevant insights. Crucially, the indicator does not repaint, providing reliable signals that traders can trust.
Customizable Parameters: Users can fine-tune the indicator to suit their specific trading styles by adjusting settings such as the temporal synchronization and neural pulse rate. This flexibility ensures that the indicator can be tailored to different market environments.
Visual Clarity and Usability: The indicator provides clear visual cues on the chart, including color-coded signals and optional display of signal curves. Users can also customize the table's position and text size, enhancing readability and ease of use.
Comprehensive Performance Metrics: The indicator includes a detailed metrics table that displays key performance indicators such as return rates, trade counts, and win/loss ratios. This feature helps traders assess the effectiveness of their strategies and make data-driven decisions.
How It Works
The core of the "Machine Learning Signal Filter" is its ability to process and learn from large datasets. By applying machine learning models, the indicator identifies potential trading opportunities based on historical data patterns. It uses regression techniques to predict future price movements and neural networks to enhance pattern recognition. As new data is introduced, the indicator refines its algorithms, improving its accuracy and reliability over time.
Use Cases
Trend Following: Ideal for traders seeking to capitalize on market trends, the indicator helps identify the direction and strength of price movements.
Scalping: With its ability to provide quick signals, the indicator is suitable for scalpers aiming for rapid profits in volatile markets.
Risk Management: By offering insights into trade performance, the indicator aids in managing risk and optimizing trade setups.
In summary, the "Machine Learning Signal Filter" is a powerful tool that combines the analytical strength of machine learning with the practical needs of traders. Its ability to adapt and provide actionable insights makes it an invaluable asset for navigating the complexities of financial markets.
The "Machine Learning Signal Filter" is a tool designed to assist traders by providing insights based on historical data and machine learning techniques. It does not guarantee profitable trades and should be used as part of a comprehensive trading strategy. Users are encouraged to conduct their own research and consider their financial situation before making trading decisions. Trading involves significant risk, and it is possible to lose more than the initial investment. Always trade responsibly and be aware of the risks involved.

Machine Learning Support and Resistance [AlgoAlpha]🚀 Elevate Your Trading with Machine Learning Dynamic Support and Resistance!
The Machine Learning Dynamic Support and Resistance by AlgoAlpha leverages advanced machine learning techniques to identify dynamic support and resistance levels on your chart. This tool is designed to help traders spot key price levels where the market might reverse or stall, enhancing your trading strategy with precise, data-driven insights.
Key Features:
🎯 Dynamic Levels: Continuously adjusts support and resistance levels based on real-time price data using a K-means clustering algorithm.
🧠 Machine Learning: Utilizes clustering methods to optimize the identification of significant price zones.
⏳ Configurable Lookback Periods: Customize the training length and confirmation length for better adaptability to different market conditions.
🎨 Visual Clarity: Clearly distinguish bullish and bearish zones with customizable color schemes.
📉 Trailing and Fixed Levels: Option to display both trailing and fixed support/resistance levels for comprehensive analysis.
🚮 Auto-Cleaning: Automatically removes outdated levels after a specified number of bars to keep your chart clean and relevant.
Quick Guide to Using the Machine Learning Dynamic Support and Resistance Indicator
Maximize your trading with this powerful indicator by following these streamlined steps! 🚀✨
🛠 Add the Indicator: Add the indicator to favorites by pressing the star icon. Customize settings like clustering training length, confirmation length, and whether to show trailing or fixed levels to fit your trading style.
📊 Market Analysis: Monitor the dynamic levels to identify potential reversal points. Use these levels to inform entry and exit points, or to set stop losses.
How It Works
This indicator employs a K-means clustering algorithm to dynamically identify key price levels based on the historical price data within a specified lookback window. It starts by initializing three centroids based on the highest, lowest, and an average between the highest and lowest price over the lookback period. The algorithm then iterates through the price data to cluster the prices around these centroids, dynamically adjusting them until they stabilize, representing potential support and resistance levels. These levels are further confirmed based on a separate confirmation length parameter to identify "fixed" levels, which are then drawn as horizontal lines on the chart. The script continuously updates these levels as new data comes in, while also removing older levels to keep the chart clean and relevant, offering traders a clear and adaptive view of market structure.

Correlation Clusters [LuxAlgo]The Correlation Clusters is a machine learning tool that allows traders to group sets of tickers with a similar correlation coefficient to a user-set reference ticker.
The tool calculates the correlation coefficients between 10 user-set tickers and a user-set reference ticker, with the possibility of forming up to 10 clusters.
🔶 USAGE
Applying clustering methods to correlation analysis allows traders to quickly identify which set of tickers are correlated with a reference ticker, rather than having to look at them one by one or using a more tedious approach such as correlation matrices.
Tickers belonging to a cluster may also be more likely to have a higher mutual correlation. The image above shows the detailed parts of the Correlation Clusters tool.
The correlation coefficient between two assets allows traders to see how these assets behave in relation to each other. It can take values between +1.0 and -1.0 with the following meaning
Value near +1.0: Both assets behave in a similar way, moving up or down at the same time
Value close to 0.0: No correlation, both assets behave independently
Value near -1.0: Both assets have opposite behavior when one moves up the other moves down, and vice versa
There is a wide range of trading strategies that make use of correlation coefficients between assets, some examples are:
Pair Trading: Traders may wish to take advantage of divergences in the price movements of highly positively correlated assets; even highly positively correlated assets do not always move in the same direction; when assets with a correlation close to +1.0 diverge in their behavior, traders may see this as an opportunity to buy one and sell the other in the expectation that the assets will return to the likely same price behavior.
Sector rotation: Traders may want to favor some sectors that are expected to perform in the next cycle, tracking the correlation between different sectors and between the sector and the overall market.
Diversification: Traders can aim to have a diversified portfolio of uncorrelated assets. From a risk management perspective, it is useful to know the correlation between the assets in your portfolio, if you hold equal positions in positively correlated assets, your risk is tilted in the same direction, so if the assets move against you, your risk is doubled. You can avoid this increased risk by choosing uncorrelated assets so that they move independently.
Hedging: Traders may want to hedge positions with correlated assets, from a hedging perspective, if you are long an asset, you can hedge going long a negatively correlated asset or going short a positively correlated asset.
Grouping different assets with similar behavior can be very helpful to traders to avoid over-exposure to those assets, traders may have multiple long positions on different assets as a way of minimizing overall risk when in reality if those assets are part of the same cluster traders are maximizing their risk by taking positions on assets with the same behavior.
As a rule of thumb, a trader can minimize risk via diversification by taking positions on assets with no correlations, the proposed tool can effectively show a set of uncorrelated candidates from the reference ticker if one or more clusters centroids are located near 0.
🔶 DETAILS
K-means clustering is a popular machine-learning algorithm that finds observations in a data set that are similar to each other and places them in a group.
The process starts by randomly assigning each data point to an initial group and calculating the centroid for each. A centroid is the center of the group. K-means clustering forms the groups in such a way that the variances between the data points and the centroid of the cluster are minimized.
It's an unsupervised method because it starts without labels and then forms and labels groups itself.
🔹 Execution Window
In the image above we can see how different execution windows provide different correlation coefficients, informing traders of the different behavior of the same assets over different time periods.
Users can filter the data used to calculate correlations by number of bars, by time, or not at all, using all available data. For example, if the chart timeframe is 15m, traders may want to know how different assets behave over the last 7 days (one week), or for an hourly chart set an execution window of one month, or one year for a daily chart. The default setting is to use data from the last 50 bars.
🔹 Clusters
On this graph, we can see different clusters for the same data. The clusters are identified by different colors and the dotted lines show the centroids of each cluster.
Traders can select up to 10 clusters, however, do note that selecting 10 clusters can lead to only 4 or 5 returned clusters, this is caused by the machine learning algorithm not detecting any more data points deviating from already detected clusters.
Traders can fine-tune the algorithm by changing the 'Cluster Threshold' and 'Max Iterations' settings, but if you are not familiar with them we advise you not to change these settings, the defaults can work fine for the application of this tool.
🔹 Correlations
Different correlations mean different behaviors respecting the same asset, as we can see in the chart above.
All correlations are found against the same asset, traders can use the chart ticker or manually set one of their choices from the settings panel. Then they can select the 10 tickers to be used to find the correlation coefficients, which can be useful to analyze how different types of assets behave against the same asset.
🔶 SETTINGS
Execution Window Mode: Choose how the tool collects data, filter data by number of bars, time, or no filtering at all, using all available data.
Execute on Last X Bars: Number of bars for data collection when the 'Bars' execution window mode is active.
Execute on Last: Time window for data collection when the `Time` execution window mode is active. These are full periods, so `Day` means the last 24 hours, `Week` means the last 7 days, and so on.
🔹 Clusters
Number of Clusters: Number of clusters to detect up to 10. Only clusters with data points are displayed.
Cluster Threshold: Number used to compare a new centroid within the same cluster. The lower the number, the more accurate the centroid will be.
Max Iterations: Maximum number of calculations to detect a cluster. A high value may lead to a timeout runtime error (loop takes too long).
🔹 Ticker of Reference
Use Chart Ticker as Reference: Enable/disable the use of the current chart ticker to get the correlation against all other tickers selected by the user.
Custom Ticker: Custom ticker to get the correlation against all the other tickers selected by the user.
🔹 Correlation Tickers
Select the 10 tickers for which you wish to obtain the correlation against the reference ticker.
🔹 Style
Text Size: Select the size of the text to be displayed.
Display Size: Select the size of the correlation chart to be displayed, up to 500 bars.
Box Height: Select the height of the boxes to be displayed. A high height will cause overlapping if the boxes are close together.
Clusters Colors: Choose a custom colour for each cluster.

Machine Learning Adaptive SuperTrend [AlgoAlpha]📈🤖 Machine Learning Adaptive SuperTrend - Take Your Trading to the Next Level! 🚀✨
Introducing the Machine Learning Adaptive SuperTrend , an advanced trading indicator designed to adapt to market volatility dynamically using machine learning techniques. This indicator employs k-means clustering to categorize market volatility into high, medium, and low levels, enhancing the traditional SuperTrend strategy. Perfect for traders who want an edge in identifying trend shifts and market conditions.
What is K-Means Clustering and How It Works
K-means clustering is a machine learning algorithm that partitions data into distinct groups based on similarity. In this indicator, the algorithm analyzes ATR (Average True Range) values to classify volatility into three clusters: high, medium, and low. The algorithm iterates to optimize the centroids of these clusters, ensuring accurate volatility classification.
Key Features
🎨 Customizable Appearance: Adjust colors for bullish and bearish trends.
🔧 Flexible Settings: Configure ATR length, SuperTrend factor, and initial volatility guesses.
📊 Volatility Classification: Uses k-means clustering to adapt to market conditions.
📈 Dynamic SuperTrend Calculation: Applies the classified volatility level to the SuperTrend calculation.
🔔 Alerts: Set alerts for trend shifts and volatility changes.
📋 Data Table Display: View cluster details and current volatility on the chart.
Quick Guide to Using the Machine Learning Adaptive SuperTrend Indicator
🛠 Add the Indicator: Add the indicator to favorites by pressing the star icon. Customize settings like ATR length, SuperTrend factor, and volatility percentiles to fit your trading style.
📊 Market Analysis: Observe the color changes and SuperTrend line for trend reversals. Use the data table to monitor volatility clusters.
🔔 Alerts: Enable notifications for trend shifts and volatility changes to seize trading opportunities without constant chart monitoring.
How It Works
The indicator begins by calculating the ATR values over a specified training period to assess market volatility. Initial guesses for high, medium, and low volatility percentiles are inputted. The k-means clustering algorithm then iterates to classify the ATR values into three clusters. This classification helps in determining the appropriate volatility level to apply to the SuperTrend calculation. As the market evolves, the indicator dynamically adjusts, providing real-time trend and volatility insights. The indicator also incorporates a data table displaying cluster centroids, sizes, and the current volatility level, aiding traders in making informed decisions.
Add the Machine Learning Adaptive SuperTrend to your TradingView charts today and experience a smarter way to trade! 🌟📊
