Profitable Pair Correlation Divergence Scanner v6This strategy identifies divergence opportunities between two correlated assets using a combination of Z-Score spread analysis, trend confirmation, RSI & MACD momentum checks, correlation filters, and ATR-based stop-loss/take-profit management. It’s optimized for positive P&L and realistic trade execution.
Key Features:
Pair Divergence Detection:
Measures deviation between returns of two assets and identifies overbought/oversold spread conditions using Z-Score.
Trend Alignment:
Trades only in the direction of the primary asset’s trend using a fast EMA vs slow EMA filter.
Momentum Confirmation:
Confirms trades with RSI and MACD to reduce false signals.
Correlation Filter:
Ensures the pair is strongly correlated before taking trades, avoiding noisy signals.
Risk Management:
Dynamic ATR-based stop-loss and take-profit ensures proper reward-to-risk ratio.
Exit Conditions:
Automatically closes positions when Z-Score normalizes, or ATR-based exits are hit.
How It Works:
Calculate Returns:
Computes returns for both assets over the selected timeframe.
Z-Score Spread:
Calculates the spread between returns and normalizes it using moving average and standard deviation.
Trend Filter:
Only takes long trades if the fast EMA is above the slow EMA, and short trades if the fast EMA is below the slow EMA.
Momentum Confirmation:
Confirms trade direction with RSI (>50 for longs, <50 for shorts) and MACD alignment.
Correlation Check:
Ensures the pair’s recent correlation is strong enough to validate divergence signals.
Trade Execution:
Opens positions when Z-Score crosses thresholds and all conditions align. Positions close when Z-Score normalizes or ATR-based SL/TP is hit.
Plot Explanation:
Z-Score: Blue line shows divergence magnitude.
Entry Levels: Red/Green lines mark long/short thresholds.
Exit Zone: Gray lines show normalization zone.
EMA Trend Lines: Purple (fast), Orange (slow) for trend alignment.
Correlation: Teal overlay shows current correlation strength.
Usage Tips:
Use highly correlated pairs for best results (e.g., EURUSD/GBPUSD).
Run on higher timeframe charts (1h or 4h) to reduce noise.
Adjust ATR multiplier based on volatility to avoid premature stops.
Combine with alerts for automated notifications or webhook execution.
Conclusion:
The Profitable Pair Correlation Divergence Scanner v6 is designed for traders who want systematic, low-risk, positive P&L trading opportunities with minimal manual monitoring. By combining trend alignment, momentum confirmation, correlation filters, and dynamic exits, it reduces false signals and improves execution reliability.
Run it on TradingView and watch how it captures divergence opportunities while maintaining positive P&L across trades.
Mean

Bollinger Bands Mean Reversion using RSI [Krishna Peri]How it Works
Long entries trigger when:
- RSI reaches oversold levels, and
- At least one bullish candle closes inside the lower Bollinger Band
Short entries trigger when:
- RSI reaches overbought levels, and
- At least one bearish candle closes inside the upper Bollinger Band
This approach aims to capture exhaustion moves where price pushes into extreme deviation from its mean and then snaps back toward the middle band.
Important Disclaimer
This is a mean-reversion strategy, which means it performs best in sideways, ranging, or slowly oscillating market conditions. When markets shift into strong trends, Bollinger Bands expand and volatility increases, which may cause some signals to become inaccurate or fail altogether.
For best results, combine this script with:
- Price action
- Market structure
- Higher-timeframe trend context
- Previous day/week/month highs & lows
- Untested liquidity levels or imbalance zones
- Session timing (Asia, London, NY)
Using these confluences helps filter out low-probability trades and significantly improves consistency and precision.

Stochastic Hash Strat [Hash Capital Research]# Stochastic Hash Strategy by Hash Capital Research
## 🎯 What Is This Strategy?
The **Stochastic Slow Strategy** is a momentum-based trading system that identifies oversold and overbought market conditions to capture mean-reversion opportunities. Think of it as a "buy low, sell high" approach with smart mathematical filters that remove emotion from your trading decisions.
Unlike fast-moving indicators that generate excessive noise, this strategy uses **smoothed stochastic oscillators** to identify only the highest-probability setups when momentum truly shifts.
---
## 💡 Why This Strategy Works
Most traders fail because they:
- **Chase prices** after big moves (buying high, selling low)
- **Overtrade** in choppy, directionless markets
- **Exit too early** or hold losses too long
This strategy solves all three problems:
1. **Entry Discipline**: Only trades when the stochastic oscillator crosses in extreme zones (oversold for longs, overbought for shorts)
2. **Cooldown Filter**: Prevents revenge trading by forcing a waiting period after each trade
3. **Fixed Risk/Reward**: Pre-defined stop-loss and take-profit levels ensure consistent risk management
**The Math Behind It**: The stochastic oscillator measures where the current price sits relative to its recent high-low range. When it's below 25, the market is oversold (time to buy). When above 70, it's overbought (time to sell). The crossover with its moving average confirms momentum is shifting.
---
## 📊 Best Markets & Timeframes
### ⭐ OPTIMAL PERFORMANCE:
**Crude Oil (WTI) - 12H Timeframe**
- **Why it works**: Oil markets have predictable volatility patterns and respect technical levels
**AAVE/USD - 4H to 12H Timeframe**
- **Why it works**: DeFi tokens exhibit strong momentum cycles with clear extremes
### ✅ Also Works Well On:
- **BTC/USD** (12H, Daily) - Lower frequency but high win rate
- **ETH/USD** (8H, 12H) - Balanced volatility and liquidity
- **Gold (XAU/USD)** (Daily) - Classic mean-reversion asset
- **EUR/USD** (4H, 8H) - Lower volatility, requires patience
### ❌ Avoid Using On:
- Timeframes below 4H (too much noise)
- Low-liquidity altcoins (wide spreads kill performance)
- Strongly trending markets without pullbacks (Bitcoin in 2021)
- News-driven instruments during major events
---
## 🎛️ Understanding The Settings
### Core Stochastic Parameters
**Stochastic Length (Default: 16)**
- Controls the lookback period for price comparison
- Lower = faster reactions, more signals (10-14 for volatile markets)
- Higher = smoother signals, fewer trades (16-21 for stable markets)
- **Pro tip**: Use 10 for crypto 4H, 16 for commodities 12H
**Overbought Level (Default: 70)**
- Threshold for short entries
- Lower values (65-70) = more trades, earlier entries
- Higher values (75-80) = fewer but higher-conviction trades
- **Sweet spot**: 70 works for most assets
**Oversold Level (Default: 25)**
- Threshold for long entries
- Higher values (25-30) = more trades, earlier entries
- Lower values (15-20) = fewer but stronger bounce setups
- **Sweet spot**: 20-25 depending on market conditions
**Smooth K & Smooth D (Default: 7 & 3)**
- Additional smoothing to filter out whipsaws
- K=7 makes the indicator slower and more reliable
- D=3 is the signal line that confirms the trend
- **Don't change these unless you know what you're doing**
---
### Risk Management
**Stop Loss % (Default: 2.2%)**
- Automatically exits losing trades
- Should be 1.5x to 2x your average market volatility
- Too tight = death by a thousand cuts
- Too wide = uncontrolled losses
- **Calibration**: Check ATR indicator and set SL slightly above it
**Take Profit % (Default: 7%)**
- Automatically exits winning trades
- Should be 2.5x to 3x your stop loss (reward-to-risk ratio)
- This default gives 7% / 2.2% = 3.18:1 R:R
- **The golden rule**: Never have R:R below 2:1
---
### Trade Filters
**Bar Cooldown Filter (Default: ON, 3 bars)**
- **What it does**: Forces you to wait X bars after closing a trade before entering a new one
- **Why it matters**: Prevents emotional revenge trading and overtrading in choppy markets
- **Settings guide**:
- 3 bars = Standard (good for most cases)
- 5-7 bars = Conservative (oil, slow-moving assets)
- 1-2 bars = Aggressive (only for experienced traders)
**Exit on Opposite Extreme (Default: ON)**
- Closes your long when stochastic hits overbought (and vice versa)
- Acts as an early profit-taking mechanism
- **Leave this ON** unless you're testing other exit strategies
**Divergence Filter (Default: OFF)**
- Looks for price/momentum divergences for additional confirmation
- **When to enable**: Trending markets where you want fewer but higher-quality trades
- **Keep OFF for**: Mean-reverting markets (oil, forex, most of the time)
---
## 🚀 Quick Start Guide
### Step 1: Set Up in TradingView
1. Open TradingView and navigate to your chart
2. Click "Pine Editor" at the bottom
3. Copy and paste the strategy code
4. Click "Add to Chart"
5. The strategy will appear in a separate pane below your price chart
### Step 2: Choose Your Market
**If you're trading Crude Oil:**
- Timeframe: 12H
- Keep all default settings
- Watch for signals during London/NY overlap (8am-11am EST)
**If you're trading AAVE or crypto:**
- Timeframe: 4H or 12H
- Consider these adjustments:
- Stochastic Length: 10-14 (faster)
- Oversold: 20 (more aggressive)
- Take Profit: 8-10% (higher targets)
### Step 3: Wait for Your First Signal
**LONG Entry** (Green circle appears):
- Stochastic crosses up below oversold level (25)
- Price likely near recent lows
- System places limit order at take profit and stop loss
**SHORT Entry** (Red circle appears):
- Stochastic crosses down above overbought level (70)
- Price likely near recent highs
- System places limit order at take profit and stop loss
**EXIT** (Orange circle):
- Position closes either at stop, target, or opposite extreme
- Cooldown period begins
### Step 4: Let It Run
The biggest mistake? **Interfering with the system.**
- Don't close trades early because you're scared
- Don't skip signals because you "have a feeling"
- Don't increase position size after a big win
- Don't revenge trade after a loss
**Follow the system or don't use it at all.**
---
### Important Risks:
1. **Drawdown Pain**: You WILL experience losing streaks of 5-7 trades. This is mathematically normal.
2. **Whipsaw Markets**: Choppy, range-bound conditions can trigger multiple small losses.
3. **Gap Risk**: Overnight gaps can cause your actual fill to be worse than the stop loss.
4. **Slippage**: Real execution prices differ from backtested prices (factor in 0.1-0.2% slippage).
---
## 🔧 Optimization Guide
### When to Adjust Settings:
**Market Volatility Increased?**
- Widen stop loss by 0.5-1%
- Increase take profit proportionally
- Consider increasing cooldown to 5-7 bars
**Getting Too Few Signals?**
- Decrease stochastic length to 10-12
- Increase oversold to 30, decrease overbought to 65
- Reduce cooldown to 2 bars
**Getting Too Many Losses?**
- Increase stochastic length to 18-21 (slower, smoother)
- Enable divergence filter
- Increase cooldown to 5+ bars
- Verify you're on the right timeframe
### A/B Testing Method:
1. **Run default settings for 50 trades** on your chosen market
2. Document: Win rate, profit factor, max drawdown, emotional tolerance
3. **Change ONE variable** (e.g., oversold from 25 to 20)
4. Run another 50 trades
5. Compare results
6. Keep the better version
**Never change multiple settings at once** or you won't know what worked.
---
## 📚 Educational Resources
### Key Concepts to Learn:
**Stochastic Oscillator**
- Developed by George Lane in the 1950s
- Measures momentum by comparing closing price to price range
- Formula: %K = (Close - Low) / (High - Low) × 100
- Similar to RSI but more sensitive to price movements
**Mean Reversion vs. Trend Following**
- This is a **mean reversion** strategy (price returns to average)
- Works best in ranging markets with defined support/resistance
- Fails in strong trending markets (2017 Bitcoin, 2020 Tech stocks)
- Complement with trend filters for better results
**Risk:Reward Ratio**
- The cornerstone of profitable trading
- Winning 40% of trades with 3:1 R:R = profitable
- Winning 60% of trades with 1:1 R:R = breakeven (after fees)
- **This strategy aims for 45% win rate with 2.5-3:1 R:R**
### Recommended Reading:
- *"Trading Systems and Methods"* by Perry Kaufman (Chapter on Oscillators)
- *"Mean Reversion Trading Systems"* by Howard Bandy
- *"The New Trading for a Living"* by Dr. Alexander Elder
---
## 🛠️ Troubleshooting
### "I'm not seeing any signals!"
**Check:**
- Is your timeframe 4H or higher?
- Is the stochastic actually reaching extreme levels (check if your asset is stuck in middle range)?
- Is cooldown still active from a previous trade?
- Are you on a low-liquidity pair?
**Solution**: Switch to a more volatile asset or lower the overbought/oversold thresholds.
---
### "The strategy keeps losing money!"
**Check:**
- What's your win rate? (Below 35% is concerning)
- What's your profit factor? (Below 0.8 means serious issues)
- Are you trading during major news events?
- Is the market in a strong trend?
**Solution**:
1. Verify you're using recommended markets/timeframes
2. Increase cooldown period to avoid choppy markets
3. Reduce position size to 5% while you diagnose
4. Consider switching to daily timeframe for less noise
---
### "My stop losses keep getting hit!"
**Check:**
- Is your stop loss tighter than the average ATR?
- Are you trading during high-volatility sessions?
- Is slippage eating into your buffer?
**Solution**:
1. Calculate the 14-period ATR
2. Set stop loss to 1.5x the ATR value
3. Avoid trading right after market open or major news
4. Factor in 0.2% slippage for crypto, 0.1% for oil
---
## 💪 Pro Tips from the Trenches
### Psychological Discipline
**The Three Deadly Sins:**
1. **Skipping signals** - "This one doesn't feel right"
2. **Early exits** - "I'll just take profit here to be safe"
3. **Revenge trading** - "I need to make back that loss NOW"
**The Solution:** Treat your strategy like a business system. Would McDonald's skip making fries because the cashier "doesn't feel like it today"? No. Systems work because of consistency.
---
### Position Management
**Scaling In/Out** (Advanced)
- Enter 50% position at signal
- Add 50% if stochastic reaches 10 (oversold) or 90 (overbought)
- Exit 50% at 1.5x take profit, let the rest run
**This is NOT for beginners.** Master the basic system first.
---
### Market Awareness
**Oil Traders:**
- OPEC meetings = volatility spikes (avoid or widen stops)
- US inventory reports (Wed 10:30am EST) = avoid trading 2 hours before/after
- Summer driving season = different patterns than winter
**Crypto Traders:**
- Monday-Tuesday = typically lower volatility (fewer signals)
- Thursday-Sunday = higher volatility (more signals)
- Avoid trading during exchange maintenance windows
---
## ⚖️ Legal Disclaimer
This trading strategy is provided for **educational purposes only**.
- Past performance does not guarantee future results
- Trading involves substantial risk of loss
- Only trade with capital you can afford to lose
- No one associated with this strategy is a licensed financial advisor
- You are solely responsible for your trading decisions
**By using this strategy, you acknowledge that you understand and accept these risks.**
---
## 🙏 Acknowledgments
Strategy development inspired by:
- George Lane's original Stochastic Oscillator work
- Modern quantitative trading research
- Community feedback from hundreds of backtests
Built with ❤️ for retail traders who want systematic, disciplined approaches to the markets.
---
**Good luck, stay disciplined, and trade the system, not your emotions.**

PG DMean & Price Sync ver 9.4 - ConsolidatedPG DMean & Price Sync Strategy (SD Filter)
This strategy combines the momentum-oscillator properties of the Detrended Mean (DMean) with a Standard Deviation (SD) Price Filter for confirming trend direction, aiming to isolate high-conviction trades while actively managing risk.
🔑 Core Logic
DMean Momentum Signal: The strategy's primary engine is the DMean, which measures the percentage difference between the current closing price and a longer-term Moving Average (price_ma). It is then smoothed by a DMean Signal line (MA of the DMean).
Entry Signal: A trade is triggered when the DMean line crosses above (for Long) or below (for Short) its Signal Line, but it must clear a user-defined Dead Zone Threshold to confirm momentum commitment.
SD Filter Confirmation (Price Sync): A Standard Deviation Channel, based on a separate user-defined price source and period, is used to filter trades.
Long Filter: Allows Long entries only when the price is trading above the lower SD band, suggesting the current price action is stronger than the recent average volatility to the downside.
Short Filter: Allows Short entries only when the price is currently below the Filter Basis (SMA), confirming a bearish stance within the SD channel.
🛡️ Risk & Exit Management
Primary Exit: All trades are exited by reverse DMean Crossover/Crossunder, meaning the position is closed when the DMean momentum reverses against the open trade (e.g., DMean crosses under the Signal to exit a Long).
Hard Stop Loss (Short Trades): A mandatory percentage-based Hard Stop Loss is implemented only for short positions to protect against sudden upward price spikes, closing the trade if the loss exceeds the set percentage. (Note: This version does not include a Hard SL for Long trades).
📊 Performance Dashboard
A custom Performance Dashboard Table is displayed at the bottom right of the chart to provide real-time, at-a-glance comparison of the strategy's equity performance versus a simple Buy & Hold over the selected backtesting date range.

Buy The Dip - ENGThis script implements a grid trading strategy for long positions in the USDT market. The core idea is to place a series of buy limit orders at progressively lower prices below an initial entry point, aiming to lower the average entry price as the price drops. It then aims to exit the entire position when the price rises a certain percentage above the average entry price.
Here's a detailed breakdown:
1. Strategy Setup (`strategy` function):
`'거미줄 자동매매 250227'`: The name of the strategy.
`overlay = true`: Draws plots and labels directly on the main price chart.
`pyramiding = 15`: Allows up to 15 entries in the same direction (long). This is essential for grid trading, as it needs to open multiple buy orders.
`initial_capital = 600`: Sets the starting capital for backtesting to 600 USDT.
`currency = currency.USDT`: Specifies the account currency as USDT.
`margin_long/short = 0`: Doesn't define specific margin requirements (might imply spot trading logic or rely on exchange defaults if used live).
`calc_on_order_fills = false`: Strategy calculations happen on each bar's close, not just when orders fill.
2. Inputs (`input`):
Core Settings:
`lev`: Leverage (default 10x). Used to calculate position sizes.
`Investment Percentage %`: Percentage of total capital to allocate to the initial grid (default 80%).
`final entry Percentage %`: Percentage of the *remaining* capital (100 - `Investment Percentage %`) to use for the "semifinal" entry (default 50%). The rest goes to the "final" entry.
`Price Adjustment Length`: Lookback period (default 4 bars) to determine the initial `maxPrice`.
`price range`: The total percentage range downwards from `maxPrice` where the grid orders will be placed (default -10%, meaning 10% down).
`tp`: Take profit percentage above the average entry price (default 0.45%).
`semifinal entry price percent`: Percentage drop from `maxPrice` to trigger the "semifinal" larger entry (default -12%).
`final entry price percent`: Percentage drop from `maxPrice` to trigger the "final" larger entry (default -15%).
Rounding & Display:
`roundprice`, `round`: Decimal places for rounding price and quantity calculations.
`texts`, `label_style`: User interface preferences for text size and label appearance on the chart.
Time Filter:
`startTime`, `endTime`: Defines the date range for the backtest.
3. Calculations & Grid Setup:
`maxPrice`: The highest price point for the grid setup. Calculated as the lowest low of the previous `len` bars only if no trades are open. If trades are open, it uses the entry price of the very first order placed in the current sequence (`strategy.opentrades.entry_price(0)`).
`minPrice`: The lowest price point for the grid, calculated based on `maxPrice` and `range1`.
`totalCapital`: The amount of capital (considering leverage and `per1`) allocated for the main grid orders.
`coinRatios`: An array ` `. This defines the *relative* size ratio for each of the 11 grid orders. Later orders (at lower prices) will be progressively larger.
`totalRatio`: The sum of all ratios (66).
`positionSizes`: An array calculated based on `totalCapital` and `coinRatios`. It determines the actual quantity (size) for each of the 11 grid orders.
4. Order Placement Logic (`strategy.entry`):
Initial Grid Orders:
Runs only if within the specified time range and no position is currently open (`strategy.opentrades == 0`).
A loop places 11 limit buy orders (`Buy 1` to `Buy 11`).
Prices are calculated linearly between `maxPrice` and `minPrice`.
Order sizes are taken from the `positionSizes` array.
Semifinal & Final Entries:
Two additional, larger limit buy orders are placed simultaneously with the grid orders:
`semifinal entry`: At `maxPrice * (1 - semifinal / 100)`. Size is based on `per2`% of the capital *not* used by the main grid (`1 - per1`).
`final entry`: At `maxPrice * (1 - final / 100)`. Size is based on the remaining capital (`1 - per2`% of the unused portion).
5. Visualization (`line.new`, `label.new`, `plot`, `plotshape`, `plotchar`):
Grid Lines & Labels:
When a position is open (`strategy.opentrades > 0`), horizontal lines and labels are drawn for each of the 11 grid order prices and the "final" entry price.
Lines extend from the bar where the *first* entry occurred.
Labels show the price and planned size for each level.
Dynamic Coloring: If the price drops below a grid level, the corresponding line turns green, and the label color changes, visually indicating that the level has been reached or filled.
Plotted Lines:
`maxPrice` (initial high point for the grid).
`strategy.position_avg_price` (current average entry price of the open position, shown in red).
Target Profit Price (`strategy.position_avg_price * (1 + tp / 100)`, shown in green).
Markers:
A flag marks the `startTime`.
A rocket icon (`🚀`) appears below the bar where the `final entry` triggers.
A stop icon (`🛑`) appears below the bar where the `semifinal entry` triggers.
6. Exit Logic (`strategy.exit`, `strategy.entry` with `qty=0`):
Main Take Profit (`Full Exit`):
Uses `strategy.entry('Full Exit', strategy.short, qty = 0, limit = target2)`. This places a limit order to close the entire position (`qty=0`) at the calculated take profit level (`target2 = avgPrice * (1 + tp / 100)`). Note: Using `strategy.entry` with `strategy.short` and `qty=0` is a way to close a long position, though `strategy.exit` is often clearer. This exit seems intended to apply whenever any part of the grid position is open.
First Order Trailing Stop (`1st order Full Exit`):
Conditional: Only active if `trail` input is true AND the *last* order filled was "Buy 1" (meaning only the very first grid level was entered).
Uses `strategy.exit` with `trail_points` and `trail_offset` based on ATR values to implement a trailing stop loss/profit mechanism for this specific scenario.
This trailing stop order is cancelled (`strategy.cancel`) if any subsequent grid orders ("Buy 2", etc.) are filled.
Final/Semifinal Take Profit (`final Full Exit`):
Conditional: Only active if more than 11 entries have occurred (meaning either the "semifinal" or "final" entry must have triggered).
Uses `strategy.exit` to place a limit order to close the entire position at the take profit level (`target3 = avgPrice * (1 + tp / 100)`).
7. Information Display (Tables & UI Label):
`statsTable` (Top Right):
A comprehensive table displaying grouped information:
Market Info (Entry Point, Current Price)
Position Info (Avg Price, Target Price, Unrealized PNL $, Unrealized PNL %, Position Size, Position Value)
Strategy Performance (Realized PNL $, Realized PNL %, Initial/Total Balance, MDD, APY, Daily Profit %)
Trade Statistics (Trade Count, Wins/Losses, Win Rate, Cumulative Profit)
`buyAvgTable` (Bottom Left):
* Shows the *theoretical* entry price and average position price if trades were filled sequentially up to each `buy` level (buy1 to buy10). It uses hardcoded percentage drops (`buyper`, `avgper`) based on the initial `maxPrice` and `coinRatios`, not the dynamically changing actual average price.
`uiLabel` (Floating Label on Last Bar):
Updates only on the most recent bar (`barstate.islast`).
Provides real-time context when a position is open: Size, Avg Price, Current Price, Open PNL ($ and %), estimated % drop needed for the *next* theoretical buy (based on `ui_gridStep` input), % rise needed to hit TP, and estimated USDT profit at TP.
Shows "No Position" and basic balance/trade info otherwise.
In Summary:
This is a sophisticated long-only grid trading strategy. It aims to:
1. Define an entry range based on recent lows (`maxPrice`).
2. Place 11 scaled-in limit buy orders within a percentage range below `maxPrice`.
3. Place two additional, larger buy orders at deeper percentage drops (`semifinal`, `final`).
4. Calculate the average entry price as orders fill.
5. Exit the entire position for a small take profit (`tp`) above the average entry price.
6. Offer a conditional ATR trailing stop if only the first order fills.
7. Provide extensive visual feedback through lines, labels, icons, and detailed information tables/UI elements.
Keep in mind that grid strategies can perform well in ranging or slowly trending markets but can incur significant drawdowns if the price trends strongly against the position without sufficient retracements to hit the take profit. The leverage (`lev`) input significantly amplifies both potential profits and losses.

Consecutive Bearish Candle Strategy█ STRATEGY DESCRIPTION
The "Consecutive Bearish Candle Strategy" is a momentum-based strategy designed to identify potential reversals after a sustained bearish move. It enters a long position when a specific number of consecutive bearish candles occur and exits when the price shows strength by exceeding the previous bar's high. This strategy is optimized for use on various timeframes and instruments.
█ SIGNAL GENERATION
1. LONG ENTRY
A Buy Signal is triggered when:
The close price has been lower than the previous close for at least `Lookback` consecutive bars. This indicates a sustained bearish move, suggesting a potential reversal.
The signal occurs within the specified time window (between `Start Time` and `End Time`).
2. EXIT CONDITION
A Sell Signal is generated when the current closing price exceeds the high of the previous bar (`close > high `). This indicates that the price has shown strength, potentially confirming the reversal and prompting the strategy to exit the position.
█ ADDITIONAL SETTINGS
Lookback: The number of consecutive bearish bars required to trigger a Buy Signal. Default is 3.
Start Time and End Time: The time window during which the strategy is allowed to execute trades.
█ PERFORMANCE OVERVIEW
This strategy is designed for markets with frequent momentum shifts.
It performs best in volatile conditions where price movements are significant.
Backtesting results should be analysed to optimize the `Lookback` parameter for specific instruments.

4 Bar Momentum Reversal strategy█ STRATEGY DESCRIPTION
The "4 Bar Momentum Reversal Strategy" is a mean-reversion strategy designed to identify price reversals following a sustained downward move. It enters a long position when a reversal condition is met and exits when the price shows strength by exceeding the previous bar's high. This strategy is optimized for indices and stocks on the daily timeframe.
█ WHAT IS THE REFERENCE CLOSE?
The Reference Close is the closing price from X bars ago, where X is determined by the Lookback period. Think of it as a moving benchmark that helps the strategy assess whether prices are trending upwards or downwards relative to past performance. For example, if the Lookback is set to 4, the Reference Close is the closing price 4 bars ago (`close `).
█ SIGNAL GENERATION
1. LONG ENTRY
A Buy Signal is triggered when:
The close price has been lower than the Reference Close for at least `Buy Threshold` consecutive bars. This indicates a sustained downward move, suggesting a potential reversal.
The signal occurs within the specified time window (between `Start Time` and `End Time`).
2. EXIT CONDITION
A Sell Signal is generated when the current closing price exceeds the high of the previous bar (`close > high `). This indicates that the price has shown strength, potentially confirming the reversal and prompting the strategy to exit the position.
█ ADDITIONAL SETTINGS
Buy Threshold: The number of consecutive bearish bars needed to trigger a Buy Signal. Default is 4.
Lookback: The number of bars ago used to calculate the Reference Close. Default is 4.
Start Time and End Time: The time window during which the strategy is allowed to execute trades.
█ PERFORMANCE OVERVIEW
This strategy is designed for trending markets with frequent reversals.
It performs best in volatile conditions where price movements are significant.
Backtesting results should be analysed to optimize the Buy Threshold and Lookback parameters for specific instruments.

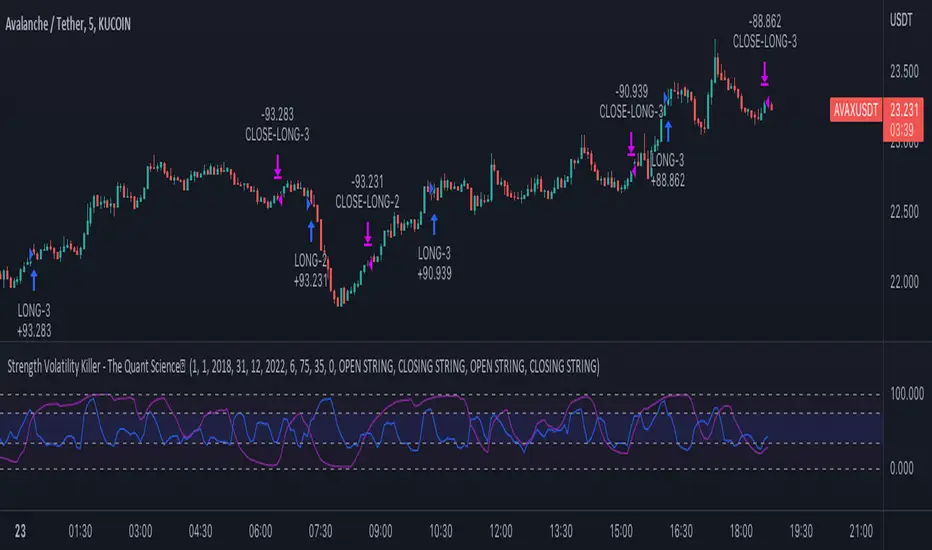
Strength Volatility Killer - The Quant ScienceStrength Volatility Killer - The Quant Science™ is based on a special version of RSI (Relative Strength Index), created with the simple average and standard deviation.
DESCRIPTION
The algorithm analyses the market and opens positions following three different volatility entry conditions. Each entry has a specific and personal exit condition. The user can setting trailing stop loss from user interface.
USER INTERFACE SETTING
Configures the algorithm from the user interface.
AUTO TRADING COMPLIANT
With the user interface, the trader can easily set up this algorithm for automatic trading.
BACKTESTING INCLUDED
The trader can adjust the backtesting period of the strategy before putting it live. Analyze large periods such as years or months or focus on short-term periods.
NO LIMIT TIMEFRAME
This algorithm can be used on all timeframes.
GENERAL FEATURES
Multi-strategy: the algorithm can apply long strategy or short strategy.
Built-in alerts: the algorithm contains alerts that can be customized from the user interface.
Integrated indicator: indicator is included.
Backtesting included: quickly automatic backtesting of the strategy.
Auto-trading compliant: functions for auto trading are included.
ABOUT BACKTESTING
Backtesting refers to the period 13 June 2022 - today, ticker: AVAX/USDT, timeframe 5 minutes.
Initial capital: $1000.00
Commission per trade: 0.03%
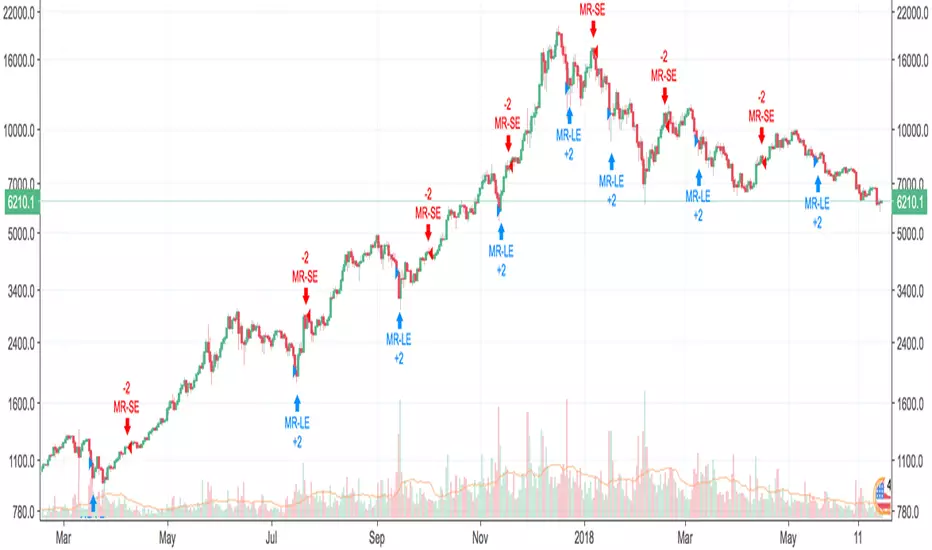
Mean Reverse Grid Algorithm - The Quant ScienceMean Reverse Grid Algorithm - The Quant Science™ is a dynamic grid algorithm that follows the trend and run a mean reverting strategy on average percentage yield variation.
DESCRIPTION
Trades on different price levels of the grid, following the trend. The grid consists of 10 levels, 5 higher and 5 lower. The grids together create a channel, this channel represents the total percentage change where the algorithm works. The channel also represents the average change yields of the asset, identified during analysis with the "Yield Trend Indicator".
The algorithm can be set long or short.
1. Long algorithm: opens long positions with 20% of the capital every time the price crossunder a lower grid, for a maximum total of 5 simultaneous trades. Trades are closed each time the price crossover a higher grid.
2. Short algorithm: opens short positions with 20% of the capital every time the price crossover a higher grid, for a maximum total of 5 simultaneous trades. Trades are closed each time the price crossunder a lower grid.
USER INTERFACE SETTING
The user configures the percentage value of each grid from the user interface.
AUTO TRADING COMPLIANT
With the user interface, the trader can easily set up this algorithm for automatic trading. Automating it is very simple, activate the alert functions and enter the links generated by your broker.
BACKTESTING INCLUDED
With the user interface, the trader can adjust the backtesting period of the strategy before putting it live. You can analyze large periods such as years or months or focus on short-term periods.
NO LIMIT TIMEFRAME
This algorithm can be used on all timeframes and is ideal for lower timeframes.
GENERAL FEATURES
Multi-strategy: the algorithm can apply either the long strategy or the short strategy.
Built-in alerts: the algorithm contains alerts that can be customized from the user interface.
Integrated grid: the grid indicator is included.
Backtesting included: automatic backtesting of the strategy is generated based on the values set.
Auto-trading compliant: functions for auto trading are included.
ABOUT BACKTESTING
Backtesting refers to the period 1 August 2022 - today, ticker: ETH/USDT, timeframe 1H.
Initial capital: $1000.00
Commission per trade: 0.03%

ETF 3-Day Reversion StrategyIntroduction: This strategy is a modification of the “3-day Mean Reversion Strategy” from the book "High Probability ETF Trading" by Larry Connors and Cesar Alvarez. In the book, the authors discuss a high-probability ETF mean reversion strategy for a 1-day time-frame with these simple rules:
The price must be above the 200 day SMA and below the 5 day SMA.
The low of today must be lower than the low of yesterday (must be true for 3 consecutive days)
The high of today must be lower than the high of yesterday (must be true for 3 consecutive days)
If the 3 rules above are true, then buy on the close of the current day.
Exit when the closing price crosses above the 5 day SMA.
In practice and in backtesting, I’ve found that the strategy consistently works better when using an EMA for the trend-line instead of an SMA. So, this script uses an EMA for the trend-line. I’ve also made the length of the exit EMA adjustable.
How it works:
The Strategy will buy when the buy conditions above are true. The strategy will sell when the closing price crosses over the Exit Moving Average
Plots:
Green line = Exit Moving Average (Default 5 Day EMA)
Blue line = 5 Day EMA (Used as Entry Criteria)
Disclaimer: Open-source scripts I publish in the community are largely meant to spark ideas that can be used as building blocks for part of a more robust trade management strategy. If you would like to implement a version of any script, I would recommend making significant additions/modifications to the strategy & risk management functions. If you don’t know how to program in Pine, then hire a Pine-coder. We can help!

[cache_that_pass] 1m 15m Function - Weighted Standard DeviationTradingview Community,
As I progress through my journey, I have come to the realization that it is time to give back. This script isn't a life changer, but it has the building blocks for a motivated individual to optimize the parameters and have a production script ready to go.
Credit for the indicator is due to @rumpypumpydumpy
I adapted this indicator to a strategy for crypto markets. 15 minute time frame has worked best for me.
It is a standard deviation script that has 3 important user configured parameters. These 3 things are what the end user should tweak for optimum returns. They are....
1) Lookback Length - I have had luck with it set to 20, but any value from 1-1000 it will accept.
2) stopPer - Stop Loss percentage of each trade
3) takePer - Take Profit percentage of each trade
2 and 3 above are where you will see significant changes in returns by altering them and trying different percentages. An experienced pinescript programmer can take this and build on it even more. If you do, I ask that you please share the script with the community in an open-source fashion.
It also already accounts for the commission percentage of 0.075% that Binance.US uses for people who pay fees with BNB.
How it works...
It calculates a weighted standard deviation of the price for the lookback period set (so 20 candles is default). It recalculates each time a new candle is printed. It trades when price lows crossunder the bottom of that deviation channel, and sells when price highs crossover the top of that deviation channel. It works best in mid to long term sideways channels / Wyckoff accumulation periods.

Hophop Reversion Strategy
█ OVERVIEW
Mean reversion is a financial term assuming that an asset's price will tend to converge to the average price over time.
Due to the trending nature of the crypto markets, mean reversion on a high timeframe could be pretty dangerous. When it comes to running mean reversion strategy on low timeframe, commission and slippage may cost more than strategy gains.
In this strategy, I tried to achieve being conservative in the trending market while avoiding trades if necessary and trading high probability reversion opportunities .
█ CONCEPTS
Strategy is build based on the combination of the momentum and the historical / implied volatility; when the price exceeds the potential volatility range, the strategy places the orders, and the target point is the mean of the expected range high and range low.
The range low and high lines displayed on the chart shows where to short or long, to make sure that the orders are limit orders; orders are placed 0.5% above/below the ranges!
Key information about the strategy
• All the orders are limit entry
• 0.02% commission is included in the backtest
• 30 ticks set for Verify Price Limit for Orders
• 30 ticks set for Slippage
• Initial version does not include the money management and hard stops hence you need to be extra cautious in trending markets
• Restricted to be used for BTC and ETH for 15 min timeframe
█ Ozet
Ortalamaya dönme, bir varlığın fiyatının zaman içinde ortalama fiyata yakınsama eğiliminde olacağını varsayan bir finansal terimdir.
Kripto piyasalarının trend egilimli doğası nedeniyle, yüksek zaman diliminde ortalamaya dönüş oldukça tehlikeli olabilir.
Ortalama geri dönüş stratejisini düşük zaman diliminde calistirmak söz konusu olduğunda, komisyon ve kayma, strateji kazanımlarından daha pahalıya mal olabilir.
Bu stratejide, gerektiğinde alım satımlardan kaçınırken ve yüksek olasılıklı ortalamaya dönüş fırsatlarını degerlendiren, trend olan piyasada ise isleme girerken temkinli olmasi uzerine calistim
█ Aciklama
Strateji, momentum ve tarihsel / zımni oynaklığın birleşimine dayalı olarak inşa edilmistir; fiyat potansiyel oynaklık aralığını aştığında, strateji emirleri verir ve hedef nokta, beklenen yüksek aralığın ve düşük aralığın ortalamasıdır.
Grafikte görüntülenen aralık alt ve üst satırları,
Stratejiye ait onemli bilgiler/b]
• Tüm emirler limit emirdir girişlidir
• Backtest performansinda %0.02 komisyon dahildir
• Limit Emir fiyat dogrulamasi icin 30 tick bekleme kullanilmistir
• Slippage için 30 tick bekleme kullanilmistir
• İlk sürüm para yönetimini ve stoploss içermez, bu nedenle trend olan piyasalarda ekstra dikkatli olmanız gerekir.
• 15 dakikalık zaman dilimi ile BTC ve ETH için kullanımla sınırlıdır
Emirlerin limit emir olduğundan emin olmak için nerede short veya long isleme girilecegini gosteren cizgilerin %0.5 üstünde/altında verilir!

Jaws Mean Reversion [Strategy]This very simple strategy is an implementation of PJ Sutherlands' Jaws Mean reversion algorithm. It simply buys when a small moving average period (e.g. 2) is below
a longer moving average period (e.g. 5) by a certain percentage and closes when the small period average crosses over the longer moving average.
If you are going to use this, you may wish to apply this to a range of investment assets using a screener for setups, as the amount signals are low. Alternatively, you may wish to tweak the settings to provide more signals.
Context can be found here:
LINK

Mean Reversion w/ Bollinger BandsThis is a more advanced version of my original mean reversion script.
It employs the famous Bollinger Bands.
This robot will buy when price falls below the lower Bollinger Band, and sell when price moves above the upper Bollinger Band.
I've only tested it on the S&P 500, though you could try it out on other assets to see the backtest performance.
During the recent COVID-19 bear market drop, it produced several buy signals on the S&P which I followed, and made some nice gains so far.
I still think this would make a better investing strategy (buy undervalued / sell over-valued), rather than a trading strategy.
I use this robot for my long term portfolio.

YJ Mean ReversionMean reversion strategy, based upon the price deviation (%) from a chosen moving average (bars). Do note that the "gains" are always relative to your starting capital, so if you set a smaller starting capital (e.g. $10000) your gains will look bigger. Also when the strategy tester has finished calculating, check the "Open P/L", as there could still be open trades.
Some Tips:
- Was designed firstly to work on an index like the S&P 500 , which over time tends to go up in value.
- Avoid trading too frequently (e.g. Daily, Weekly), to avoid getting eaten by fees.
- If you change the underlying asset, or time frame, tweaking the moving average may be necessary.
- Can work with a starting capital of just $1000, optimise the settings as necessary.
- Accepts floating point values for the amount of units to purchase (e.g. Bitcoin ).
- If price of units exceeds available capital, script will cancel the buy.
- Adjusted the input parameters to be more intuitive.

MCI and VCI - Modified CCI FormulasFor private peeps only
- Takes a modified version of the CCI formula into 2 parts
VCI - Volume Channel Index (Yellow Histogram)
- Measures accurate accumulation and distribution levels and times
MCI - Modified Channel Index
- Measures (when compared to VCI) levels where clearly buys are interested vs not interested.
Example:
If VCI > MCI
- Shows buyer's are more than interested in buying, you've either hit a bottom or heavy resistance
if MCI > VCI
- Show's buyer's aren't interested and will most likely result in a dump/lower price
Great for monitoring accumulation and distribution, these auto buy and sells look for the transition points over 0, works on EVERY commodity/stock/FOREX/Crypto
Results are from trading 1 BTC x25 leveraging. Not all trades will get in if put in at limit, but it does survive with profits after the massive 0.075 fee (results shown are after fees)

Nick's Momentum Trading Strategy - Beats Buy and Hold manifolds!This script works on the principle of short-term mean reversion and long term trend following, and uses minimal parameters to ensure no overfitting.
The scripts beats buy and hold for almost all major pairs that satisfy the following conditions:
- are trading on multiple exchanges as either ALTBTC or ALTUSD pairs
- have good volume available with them
- have an established history - (try not to use this script with really new pairs)
To run the script, follow these rules:
- script should be run on ALTBTC pair
- set first parameter such that when multiplied with resolution of chart, we get a whole day/week/month, etc. e.g. for a '4H' chart, set this to multiples of 6. The reason being that most algorithmic rebalancing in cryptosphere happens at these times, and we want to make effective use of this.
- set second parameter in the range of 1-6 - this is the smoothing factor (ema) we want to apply to our indicator (governed by our first parameter) - more smoothing = lesser trades. See what works for you.
- Last parameter is a filter condition. Just check/uncheck it once to see if market works better with this on or off.
- If script does not beat buy and hold on this pair (rarely), don't use script on this pair at all.
Access available only to friends. I do code trading strategies on request - so, let me know if you have a good set of rules to create a strategy.
Moving Average Mean Reversion StrategyA basic mean-reversion strategy. Shorts when the close is 10% above the MA, and goes long when it's 10% below the MA.
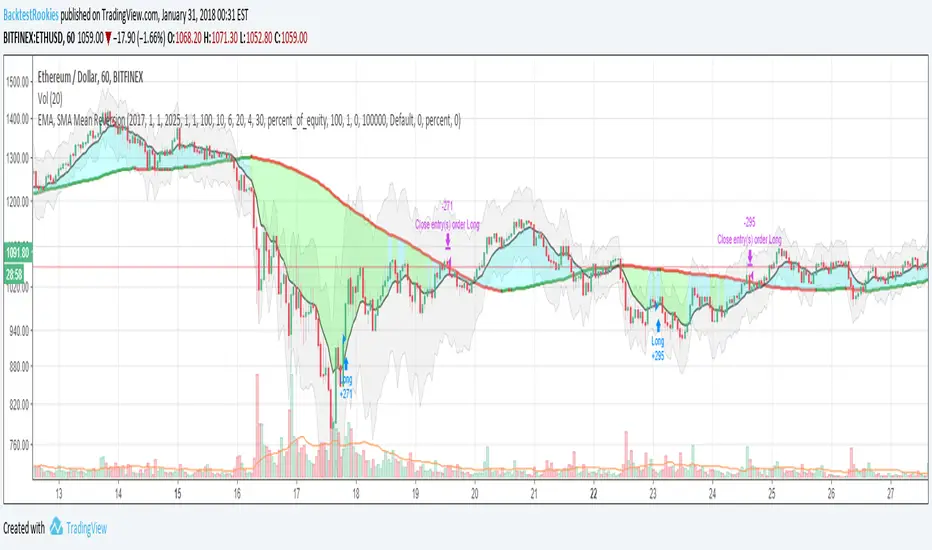
EMA, SMA Mean ReversionInvite Only: But everyone will be accepted
Invite-only in order to understand demand and interest in this type of strategy. All requests are welcome and will be accepted.
Full Source is available
A blog post containing full source code and commentary of the strategy is available on the backtest-rookies website. To comply with house rules, I cannot post a direct link here. (Hint add ".com" to backtest-rookies)
Overview
The strategy uses two moving averages to represent the historical mean and a slightly smoothed version of the current price action. It will place long or short trades when the fast EMA moves far away from the historical mean (the slow SMA).
Features
Set Backtest Date ranges
Enter when EMA is x% away from the mean
Independent inputs for the long and short side
Only enter when the EMA has started to reverse. (Input)
Optional Stop loss
Limit trades to a single direction to "Buy the dip" or "Sell the top"