Accumulation/Distribution Volume (ADV) [cI8DH]This is the simplified and optimized version of my original ADV indicator. It shows both regular volume bars and the accumulated/distributed (A/D) portion of them. The equation is elegant and intuitive. It calculates candle body to candle height ratio and multiplies it by volume: volume*(close-open)/(high-low). This is the building block of my three other indicators, ADL, ADP and ADMF.
- The volume bars has two shades of green and red. The dark shade shows amount of A/D and the light shade shows total volume (what you see on a regular volume indicator).
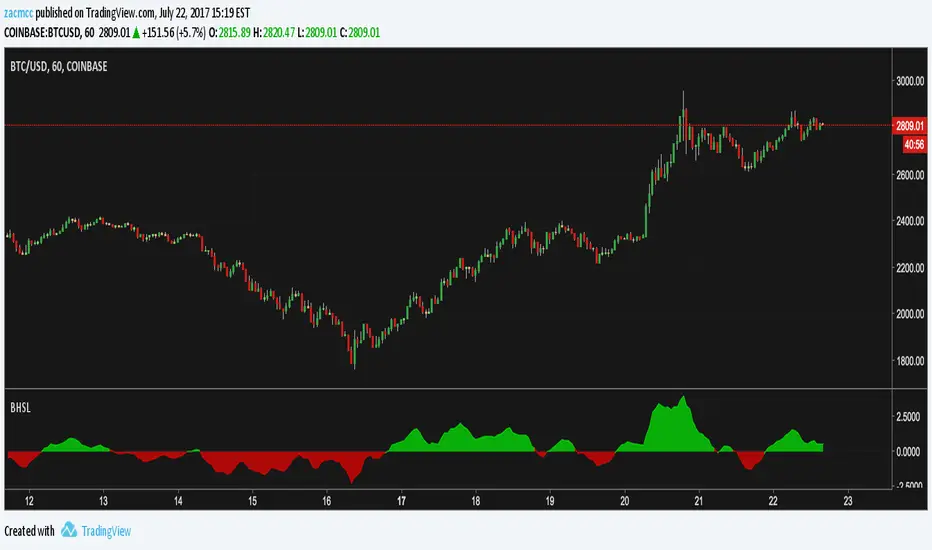
When money volume is enabled, volume is multiplied by price. As you can see in the chart below, trade volume in terms of USD was growing over the past years.
- Blue line is the moving average of A/D and the orange line is for total volume. When "Baseline Chart" option is enabled, this moving average is identical to ADMF indicator which can be a powerful indicator for assessing buy/sell pressure as well as money flow and volume divergences. You can turn off volume bars (from style menu) for better visibility or you can use the below indicators.
Please note that ADMF is now available as a part of ADP indicator as well and I recommend using the latter since ADP can also replace CMF and MFI indicators.
- If you change the aggregation to cumulative (while having money volume disabled), the gray line becomes identical to On Balance Volume (OBV) and the blue line identical to my ADL indicator. The latter I would argue is more accurate than Chaikin's ADL, William's A/D and OBV.
MFI

Accumulation/Distribution VolumeThis is a simple yet powerful indicator that can replace volume, Money Flow, Chaikin Money Flow, Price Volume Trend (PVT), Accumulation/Distribution Line (ADL), On Balance Volume (OBV).
When "Baseline Chart" option is disabled, it looks similar to regular volume. The volume bars has two shades of green and red. The dark shade shows amount of accumulation and the light shade shows total volume (what you see on a regular volume indicator). Blue line is the moving average (or cumulative total) of A/D and the gray line is for total volume.
When money volume is enabled, volume it multiplied by price. As you can see in the chart below, trade volume in terms of USD was declining after ATH. This is not the case in regular volume chart which shows instrument volume (chart above).
In Baseline view, the aggregation method you choose can turn it into different indicators. With EMA/SMA aggregation, blue and gray line shows buy/sell pressure. At 0, there is not buy or sell pressure.
If you turn off volume bars (from style menu), it gives you a reliable indicator to measure divergence. This should be more reliable than most other range-bound indicators (i.e. RSI, MFI, CMF). I will publish a TA about correctly measuring divergence (it's a must read even if you are a pro trader). Make sure that the length is set to a large number on smaller TFs such as 4h.
For following results, set aggregation to cumulative and turn off money volume:
When wick weight=0, the GRAY line is identical to OBV indicator.
When normalized by spread and wick weight=10, the BLUE line is identical to ADL (improved by true range).
When normalized by previous bar price, wick weight=0, the BLUE line is identical to PVT.
How I use this indicator:
- Baseline chart, replaced my regular volume indicator
- Mostly 4h TF for divergence
- EMA aggregation (and occasional cumulative aggregation) with length above 50. I change the length to 100 and 200 for confirmation.
- Wick weight=0 or max 2.
With this indicator, you can learn how different indicators are built and how they are different from each other. I will publish a TA to explain more about different indicators and their pros and cons.
I will publish this indicator without volume bars and additional options to make it range bound.

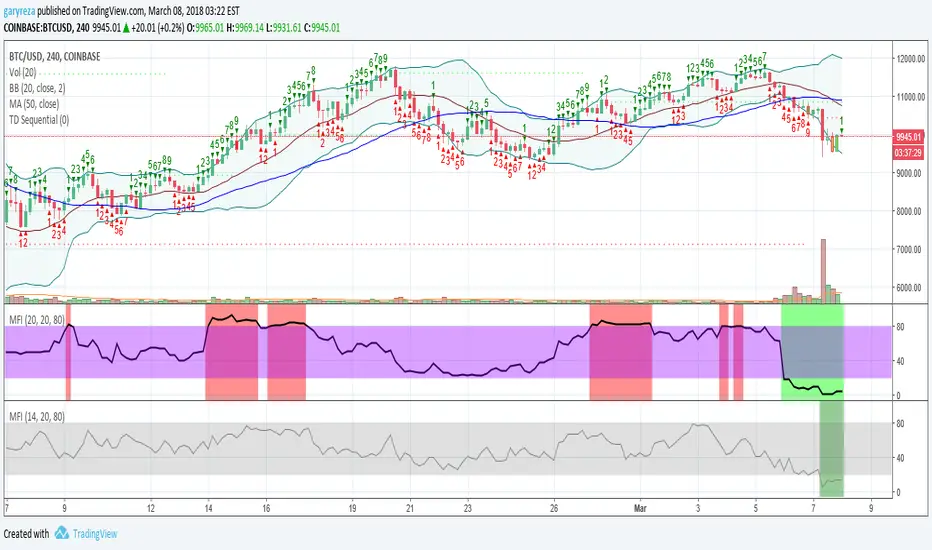
MFI (Money Flow Index) [m59]MFI with highlights when value is overbought/oversold and adjustable overbought/oversold thresholds. There is also an option to disregard candle wicks in the calculation in case that could be helpful.
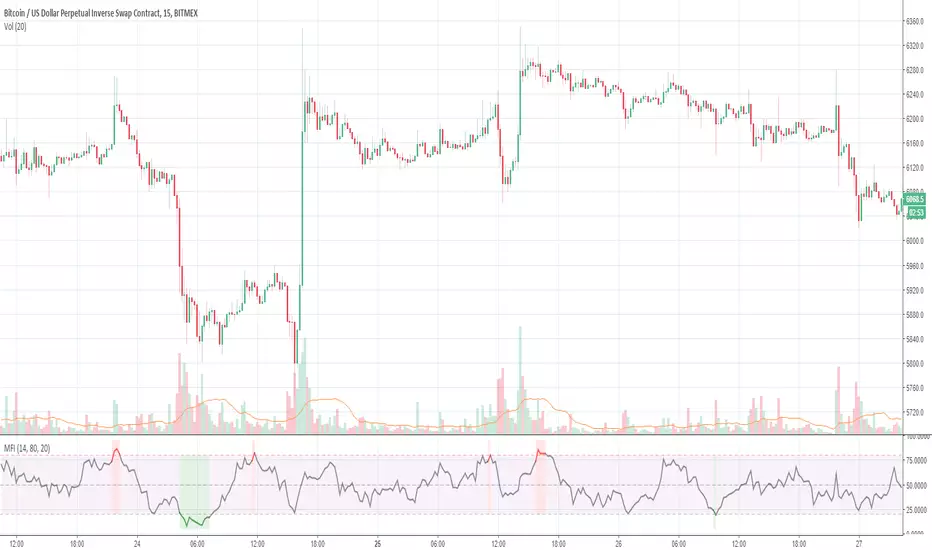
MFI (Money Flow Index) [m59]MFI with highlights when value is overbought/oversold and adjustable overbought/oversold thresholds. There is also an option to disregard candle wicks in the calculation in case that could be helpful.

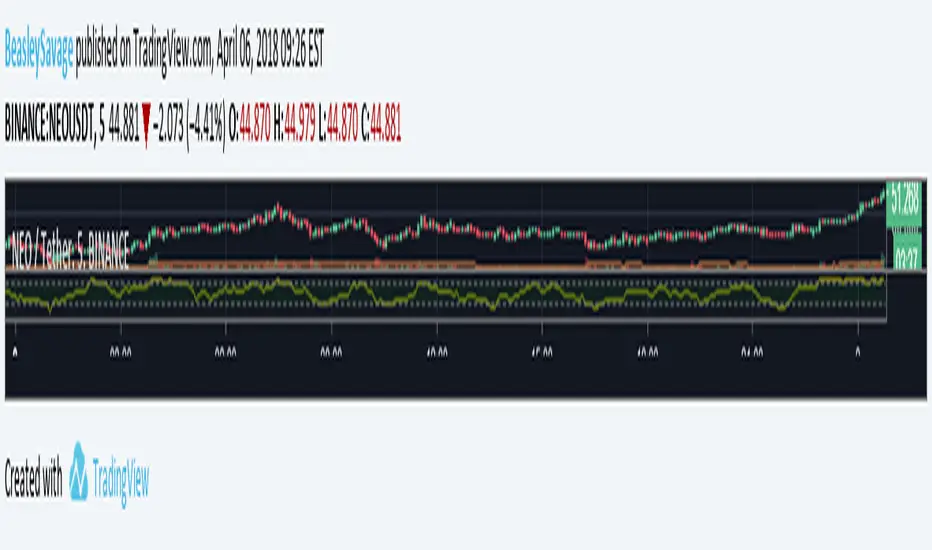
Money Flow Index + AlertsThis study is based on the work of TV user Beasley Savage ( ) and all credit goes to them.
Changes I've made:
1. Added a visual symbol of an overbought/oversold threshold cross in the form of a red/green circle, respectively. Sometimes it can be hard to see when a cross actually occurs, and if your scaling isn't set up properly you can get misleading visuals. This way removes all doubt. Bear in mind they aren't meant as trading signals, so DO NOT use them as such. Research the MFI if you're unsure, but I use them as an early warning and that particular market/stock is added to my watchlist.
2. Added 60/40 lines as the MFI respects these incredibly well in trends. E.g. in a solid uptrend the MFI won't go below 40, and vice versa. Use the idea of support and resistance levels on the indicator and it'll be a great help. I've coloured the zones. Strong uptrends should stay above 60, strong downtrends should stay below 40. The zone in between 40-60 I've called the transition zone. MFI often stays here in consolidation periods, and in the last leg of a cycle/trend the MFI will often drop into this zone after being above 60 or below 40. This is a great sign that you should get out and start looking to reverse your position. Hopefully it helps to spot divergences as well.
3. Added alerts based on an overbought/oversold cross. Also added an alert for when either condition is triggered, so hopefully that's useful for those struggling with low alert limits. Feel free to change the overbought/oversold levels, the alerts + crossover visual are set to adapt.
Like any indicator, don't use this one alone. It works best paired with indicators/techniques that contradict it. You'll often see a OB/OS cross, and price will continue on it's way for many weeks more. But MFI is a great tool for identifying upcoming trend changes.
Any queries please comment or PM me.
Cheers,
RJR

MFI + RSIMFI and RSI in the same indicator with the zones of the MFI overbuy and oversell coloured.
Enjoy it!!!

Relative Strength Index + MFI breachI allowed myself to take a piece of code of one of the indicators MFI present on Tradingview for the added to a RSI!
I made this srcipt to avoid cluttering the screen, so we can see the oversold / overbought of the MFI without having any additional indicator

Money Flow Index - Beasley SavageThe Money Flow Index indicator (MFI) is a tool used in technical analysis for measuring buying and selling pressure. This is done through analyzing both price and volume. The MFI's calculation generates a value that is then plotted as a line that moves within a range of 0-100, making it an oscillator. When the MFI rises, this indicates an increase in buying pressure. When it falls, this indicates an increase in selling pressure. The Money Flow Index can generate several signals, most notably: overbought and oversold conditions, divergences, and failure swings.
MFI v1.0 Normal and Dinamic (Totals)The normal MFI script use an RSI in the formula so the quantity of movments are not visible, this script allows you to see how much volume is being trade at the moment, so you can detect unusual levels, but you will no be allowed to see the RSI (0-100)* so I suggest to use this script with a normal MFI
Features:
+ Normal MFI length (14)
+ Green bars show the total of money trade of the bars that are going up
+ Red bars show the total of money trade when of the bars that are going down
+ Dinamic calculation (Optional)(Bellow)
Normal MFI use hlc3 ((high+low+close)/3) * (volume) to calculate each bar
The dinamic MFI: (This is an optional feature, if you dont active it you will use the normal MFI calculation)
(The information bellow is experimental and theorical only, you can use it or not in the script with the Dinamic option)
Dinamic MFI divides the bar and volume in three parts.
Volume is corresponding on each part ex. If the bar has not a top or lower wick the 100% of volume is in the middle... ex 2 If the 50% of the bar is a top wick, the 50% of volume is in the top wick
Top wick: Is calculated this way
If the bar is red (high-open)*volume of top wick
or
If the bar is green (high-close)*volume of top wick
Middle: Is calculated this way
If the bar is green (close-open)*volumemiddle
or
If the bar is red (open-close)*volumemiddle
Lower wick
If the bar is red (close-low)*volume of lower wick
or
If the bar is green (open- low)*volume of lower wick

RSI/MFI with Volatility Bands [GVD]This is an edit of the LAzyBear script.
The script is adjusted to show both the RSI and the MFI on 1 chart.

Money Flow Indicator (Chaikin Oscillator) Strategy Indicator plots Money Flow Indicator (Chaikin). This indicator looks
to improve on Larry William's Accumulation Distribution formula that
compared the closing price with the opening price. In the early 1970's,
opening prices for stocks stopped being transmitted by the exchanges.
This made it difficult to calculate Williams' formula. The Chaikin
Oscillator uses the average price of the bar calculated as follows
(High + Low) /2 instead of the Open.
The indicator subtracts a 10 period exponential moving average of the
AccumDist function from a 3 period exponential moving average of the
AccumDist function.
WARNING:
This script to change bars colors.

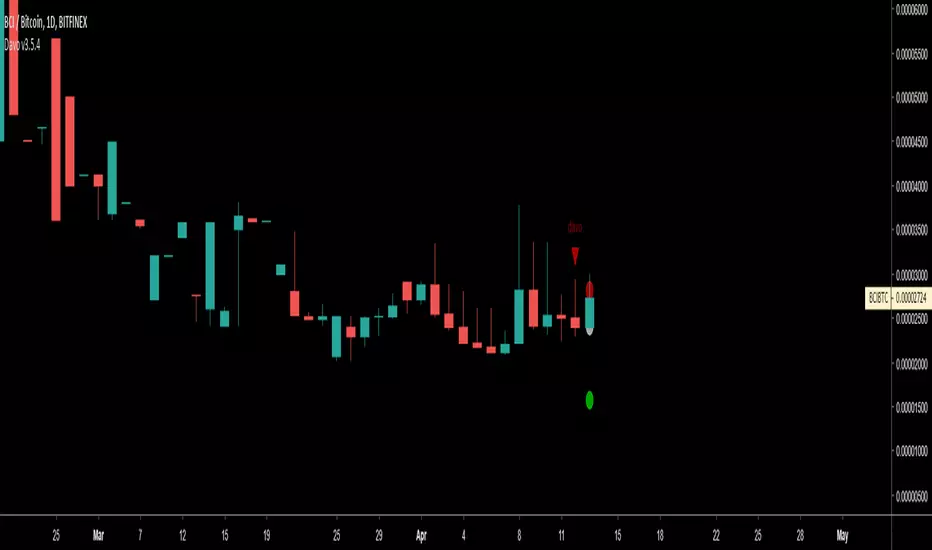
Dav-o meter (public)I decided to make this formerly invite only script public (you can find the invite only version here
If you are part of the invite only you don't need to change scripts. I will push improvements first on the invite only script but in time it will come to this version as well.
I would love to know your ideas and thoughts on how this indicator can be improved, so feel free to give any feedback.
Remember to give it a thumbs up if you like it.
Buy Low Sell High CompositeCombines RSI, EMA difference, and MacD into a single indicator. Buy when it's very red, sell when it's very green.
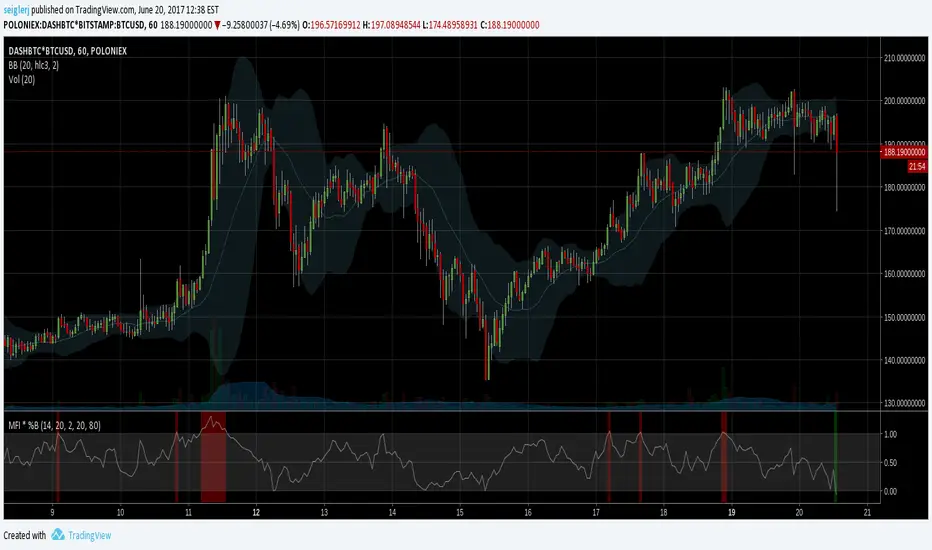
MFI * %B [seiglerj]Oscillator averaging Money Flow Index and Bollinger Bands' %B
Colored bars indicate buy or sell signals
I have no idea if this is the right way to combine these two, but I'm gonna try it and see what happens
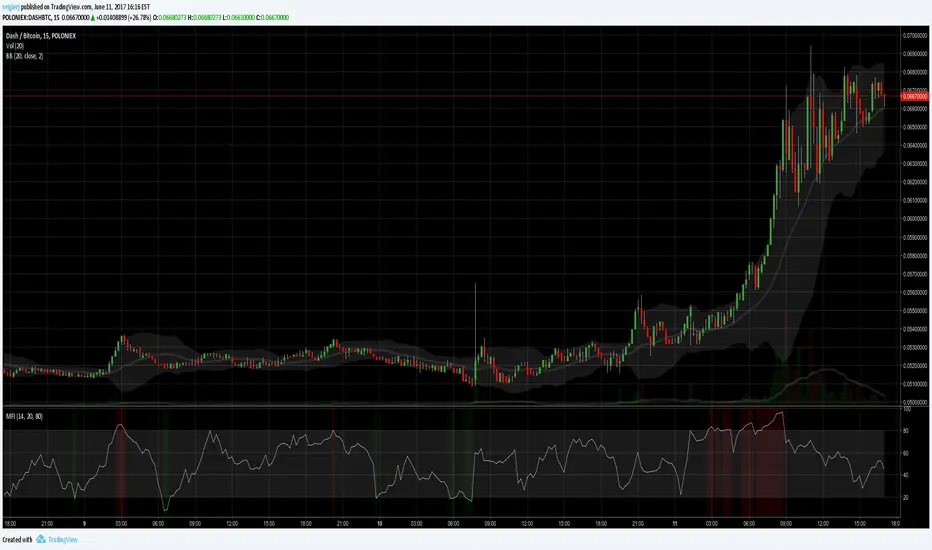
Inchart MFI signals [seiglerj]This is an inchart Money Flow indicator that puts triangles on the chart when Money Flow Index breaks out of the specified levels.

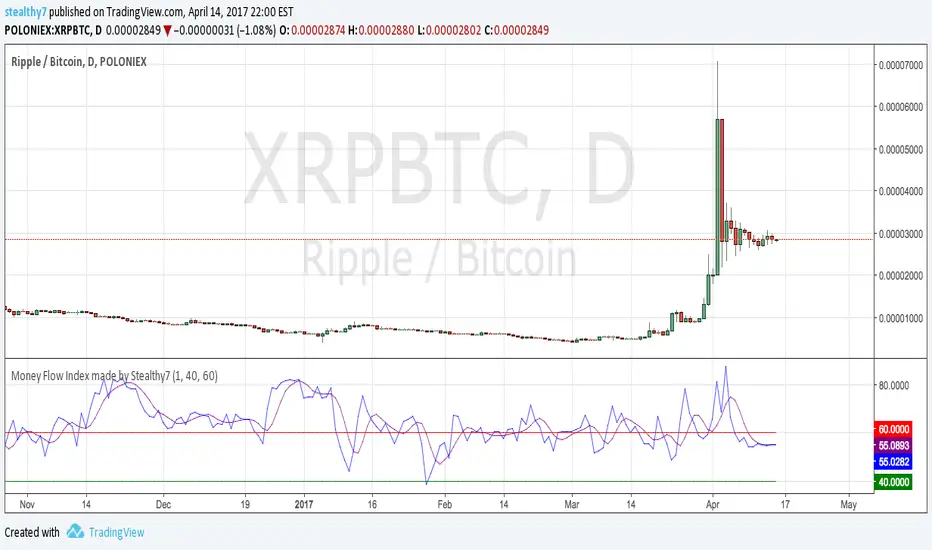
Money Flow Index made by Stealthy7Here is a quick Money Flow Index oscillator. I don't have any strategy for it. Please post any improvements.
Insync Index [LazyBear]BB Support + Histo mode
-------------------------------
Code: pastebin.com
Show enclosing BB
Show Insync as Histo:
v02 - Configurable levels
---------------------------------
Small update to allow configuring the 95/75/25/5 levels.
Latest source code: pastebin.com
v01 - orginal description
---------------------------------
Insync Index, by Norm North, is a consensus indicator. It uses RSI, MACD, MFI, DPO, ROC, Stoch, CCI and %B to calculate a composite signal. Basically, this index shows that when a majority of underlying indicators is in sync, a turning point is near.
There are couple of ways to use this indicator.
- Buy when crossing up 5, sell when crossing down 95.
- Market is typically bullish when index is above 50, bearish when below 50. This can be a great confirmation signal for price action + trend lines.
Also, since this is typical oscillator, look for divergences between price and index.
Levels 75/25 are early warning levels. Note that, index > 75 (and less than 95) should be considered very bullish and index below 25 (but above 5) as very bearish. Levels 95/5 are equivalent to traditional OB/OS levels.
The various values of the underlying components can be tuned via options page. I have also provided an option to color bars based on the index value.
More info: The Insync Index by Norm North, TASC Jan 1995
drive.google.com
List of my free indicators: bit.ly
List of my app-store indicators: blog.tradingview.com
(Support doc: bit.ly)

Market Facilitation Index (MFI) The Market Facilitation Index is an indicator that relates price range to
volume and measures the efficency of price movement. Use the indicator to
determine if the market is trending. If the Market Facilitation Index increased,
then the market is facilitating trade and is more efficient, implying that the
market is trending. If the Market Facilitation Index decreased, then the market
is becoming less efficient, which may indicate a trading range is developing that
may be a trend reversal.

3 more indicators: Inverse Fisher on RSI/MFI and CyberCycleSuggested by John Ehlers, IFT helps you to determine the exact oversold/overbought points in any oscillator-type indicators.
The 3 IFT based indicators in this chart are:
- Inverse Fisher on RSI (IFTRSI)
- Inverse Fisher on MFI (IFTMFI)
- Inverse Fisher on CyberCycle (IFTCC)
Suggested method to use any IFT indicator is to buy when the indicator crosses over –0.5 or crosses over +0.5 if it has not previously crossed over –0.5 and to sell short when the indicators crosses under +0.5 or crosses under –0.5 if it has not previously crossed under +0.5.
More info: www.mesasoftware.com
You can use these indicators by doing "Make it mine" (Click on "Share" to open the dialog box with this button).
Let me know what you think, would love to hear how these indicators are used and how effective these are for other instruments.
