NWOG/NDOG [NINE Θ]Overview
A professional-grade indicator for detecting and visualizing New Week Opening Gaps (NWOGs) and New Day Opening Gaps (NDOGs), essential concepts in ICT (Inner Circle Trader) methodology and analysis.
What Are Opening Gaps?
Opening gaps represent price inefficiencies created between trading sessions. When one session closes and the next session opens at a different price, the resulting "gap" creates a zone of unfilled orders and potential liquidity. These gaps often act as magnets for price, providing high-probability trading opportunities as the market seeks to rebalance these inefficiencies.
NWOG (New Week Opening Gap)
The gap between Friday's close and Sunday's open. These weekly imbalances are significant because they represent the collective repositioning of institutional traders over the weekend. NWOGs frequently serve as major support/resistance zones that can influence price action for days or even weeks. Due to their larger timeframe context, NWOGs typically carry more weight than daily gaps.
NDOG (New Day Opening Gap)
The gap between one session's close and the next session's open. Daily gaps occur more frequently than weekly gaps, offering more regular trading setups. While individually less significant than NWOGs, NDOGs provide valuable intraday reference points and often fill within the same trading session.
Features In Depth
Gap Detection & Visualization
The indicator automatically identifies and plots opening gaps as they form in real-time.
Automatic Detection: The indicator monitors session transitions and instantly identifies when a gap forms between the previous close and current open. NWOGs are detected on Sunday opens, while NDOGs are detected at each new daily session open (excluding Sundays, which are reserved for NWOG detection).
Bullish vs Bearish Classification: Each gap is automatically classified based on its direction:
Bullish Gap (Gap Up): Current open is higher than previous close, indicates overnight buying pressure
Bearish Gap (Gap Down): Current open is lower than previous close, indicates overnight selling pressure
The indicator uses distinct color schemes for bullish and bearish gaps, making it easy to identify gap direction at a glance. Current/most recent gaps use the "new" color settings, while historical gaps use the standard color settings.
Historical Tracking: Track up to 20 gaps of each type simultaneously. The "Historical Count" setting controls how many gaps remain visible on your chart. Older gaps are automatically removed as new ones form, keeping your chart clean while maintaining relevant historical context.
Visual Customization:
Toggle gap boundary lines (HIGH/LOW) on or off independently from the background fill
Choose line styles: solid (⎯⎯⎯), dashed (----), or dotted (····)
Adjust line thickness from 1-4 pixels
Enable/disable background fill with customizable transparency
Set colors independently for current vs historical gaps
Consequent Encroachment (C.E.)
The Consequent Encroachment represents the 50% midpoint of a gap — a critical level in ICT methodology.
Why C.E. Matters: In smart money concepts, the C.E. level represents the point of maximum efficiency within an imbalance. Price often gravitates toward this level as it seeks to rebalance the gap. Many traders use C.E. as their primary target when trading gap fills, or as a key level for entries and stop placement.
C.E. Display Options:
Independent color settings for current vs historical gaps
Separate line style and thickness controls
Can be shown/hidden independently from gap boundaries
Quarter Levels (25% and 75%): For traders who want additional precision, the indicator offers optional quarter levels at 25% and 75% of the gap range. These levels can serve as:
Partial profit targets
Scaling entry points
Additional support/resistance zones within the gap
Fill Tracking & Percentage
The indicator provides sophisticated fill tracking to monitor how much of each gap has been "filled" by subsequent price action.
How Fill Percentage Works:
For bullish gaps (gap up): Measures how far price has retraced DOWN from the gap's high toward its low
For bearish gaps (gap down): Measures how far price has retraced UP from the gap's low toward its high
The fill percentage updates in real-time as price moves through the gap zone, giving you instant feedback on gap fill progress.
Fill Detection Methods:
Wicks: Uses the full candle range (high/low) — more sensitive, detects fills earlier
Bodies: Uses only open/close prices — more conservative, requires stronger commitment
Visual Fill Indicators: The fill percentage is displayed with intuitive symbols:
〇 0-24% filled — Gap is largely untouched
◔ 25-49% filled — Minor fill in progress
◑ 50-74% filled — C.E. level has been reached
◕ 75-99% filled — Gap nearly complete
⬤ 100% filled — Gap fully filled
Hide Filled Gaps: Enable this option to automatically remove gaps from your chart once they reach 100% fill. This keeps your chart focused on active, unfilled gaps that still represent potential trading opportunities.
Projection Levels
When price breaks out of a gap zone, projection levels provide potential targets based on the gap's size.
How Projections Work: Once price closes above a gap's high (for upward projections) or below a gap's low (for downward projections), the indicator calculates extension levels using the gap's range as a measuring unit. These projections function similarly to Fibonacci extensions but are anchored to the gap's dimensions.
Projection Direction:
Upward Projections: Triggered when price closes above the gap's high — levels project above the gap
Downward Projections: Triggered when price closes below the gap's low — levels project below the gap
Customizable Multipliers: Define your own projection levels using the "Projection Levels" input. Enter comma-separated values representing multiples of the gap size:
Default: 0.5,1,2,2.5
Example custom: 0.618,1,1.618,2,2.618 (Fibonacci-based)
Each value creates a projection line at that multiple of the gap range
Projection Display Options:
Side: Display projections on the Left (extending back from gap formation) or Right (extending forward)
Color, Style, Thickness: Full visual customization
Labels: Show multiplier values at each projection level
"Extend Until Tapped" Feature: When enabled (Left side only), projection lines stop extending once price touches them. This creates a visual record of which levels have been reached and when, helping you track projection performance over time. Untapped projections continue extending until they're reached.
Labels & Formatting
Comprehensive labeling options help you quickly identify and reference gaps on your chart.
Label Format Options:
Gap Type: Simple label showing "NWOG" or "NDOG"
Gap Type + Date: Includes the full date with day of week (e.g., "NWOG Monday, November 3, 2025")
Gap Type + Date + Filled Percent: Adds the fill percentage and symbol (e.g., "NWOG Monday, November 3, 2025 ")
Label Positioning:
When Show Levels is ON: Separate labels appear at the HIGH and LOW boundaries
When Show Levels is OFF: A single label appears at the C.E. (midpoint) level
Label Customization:
Text size: Tiny, Small, Normal, or Large
Text color and background color (set background transparency to 100 for no background)
Tooltips provide detailed information including all price levels and fill percentage
Hide Historical Labels: Enable this option to hide labels and projection text on all gaps except the most recent. Lines remain visible, but text clutter is reduced — useful when tracking many historical gaps.
Status Table
An optional summary table provides at-a-glance information about all active gaps.
Table Contents: For each active gap, the table displays:
Gap Type: NWOG or NDOG with date
HIGH: Upper boundary of the gap
LOW: Lower boundary of the gap
C.E.: Consequent Encroachment (50% level)
% Filled: Current fill percentage with visual symbol
Display Settings:
Position: 9 positions available (Top/Middle/Bottom × Left/Center/Right)
Size: Tiny, Small, or Normal text
Gap Count: Control how many NWOGs and NDOGs appear in the table (1-3 each)
Adaptive Theming: The table automatically detects your chart's background color and adjusts text colors for optimal readability on both light and dark themes.
Smart Filtering: The table only shows unfilled gaps (or gaps not hidden by the "Hide Filled" setting), keeping the display focused on actionable information.
Alert System
Stay informed of key gap events without constantly monitoring your charts.
Gap Formation Alerts: Receive an alert the moment a new gap is detected. The alert includes:
Gap direction (Bullish/Bearish)
Gap type (NWOG/NDOG)
Symbol name
Example: "Bullish NWOG formed on AMEX:SPY "
Gap Filled Alerts: Get notified when a gap reaches 100% fill. This is valuable for:
Confirming trade targets have been reached
Identifying when gaps are no longer active reference points
Example: "NWOG filled on AMEX:SPY "
Projection Level Alerts: Receive alerts when price reaches your defined projection levels. Each level only alerts once, preventing spam. Useful for:
Taking profits at projection targets
Identifying extended moves beyond the gap
Example: "NWOG 2x projection reached on AMEX:SPY "
General Settings
Gap Offset: Controls how many bars the gap lines extend to the right of the current candle (0-15 bars). A higher offset keeps labels and lines visible further into the future, while a lower offset keeps the display tighter to current price action.
Tips
NWOG Priority: NWOGs typically hold more significance than NDOGs due to their weekly timeframe. When NWOG and NDOG levels conflict, consider giving more weight to the NWOG.
Unfilled Historical Gaps: Gaps from days or weeks ago can still influence current price action. Don't ignore older unfilled gaps — they often become relevant when price returns to those zones.
Session Context: Pay attention to which session created the gap. Gaps formed during high-volume sessions (like NYSE open) may carry more significance than gaps from lower-volume periods.
Gap Size Matters: Larger gaps represent more significant imbalances and often provide stronger support/resistance. Smaller gaps may fill quickly and offer less reliable levels.
Clean Chart Option: Use "Hide Historical Labels" combined with the status table to maintain a clean chart while still having access to all gap information.
Requirements
Intraday Timeframes Only: This indicator works exclusively on intraday timeframes (minutes, hours). Gap detection requires session open/close data that is only available on intraday charts.
Sufficient Historical Data: Ensure your chart has enough historical bars loaded for accurate gap tracking, especially if using higher historical count settings.
Session-Based Markets: The indicator is optimized for markets with distinct trading sessions (stocks, futures, forex). 24/7 markets like crypto may show fewer or different gap patterns.
Disclaimer
For Educational and Informational Purposes Only
This indicator is provided as a technical analysis tool for educational and informational purposes only. It is not intended as, and should not be construed as, financial advice, investment advice, trading advice, or any other type of advice.
No Guarantees: Past performance of any trading strategy, indicator, or methodology is not indicative of future results. The identification of gaps, projections, and fill levels does not guarantee that price will behave in any predicted manner. Markets are inherently unpredictable, and no technical indicator can accurately predict future price movements.
Risk Warning: Trading financial instruments involves substantial risk of loss and is not suitable for all investors. You should carefully consider your investment objectives, level of experience, and risk appetite before trading. Never trade with money you cannot afford to lose.
Not Financial Advice: The creator of this indicator (NINE) is not a licensed financial advisor, broker, or dealer. Nothing in this indicator or its documentation should be interpreted as a recommendation to buy, sell, or hold any financial instrument.
Your Responsibility: You are solely responsible for your own trading decisions. Always conduct your own research and due diligence before making any trading or investment decisions. Consider consulting with a qualified financial professional before trading.
No Liability: The creator assumes no responsibility or liability for any errors, inaccuracies, or omissions in this indicator or its documentation. The creator shall not be held liable for any losses, damages, or costs arising from the use or inability to use this indicator.
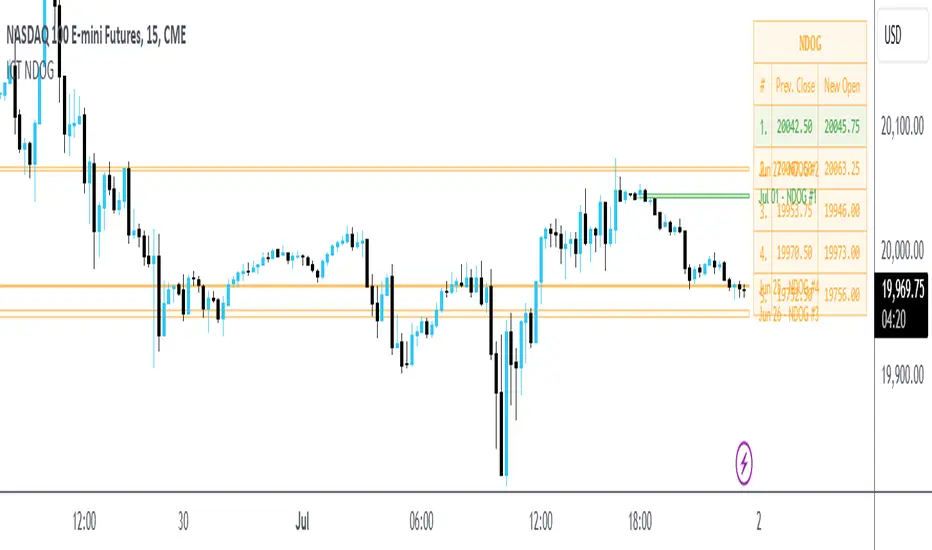
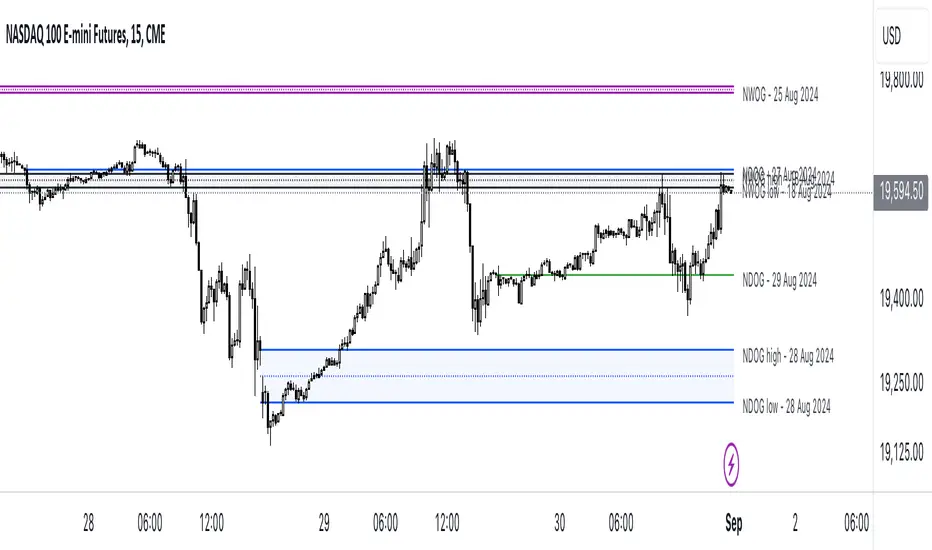
Ndog

NWOG & NDOG - Opening Gaps 🧪 [Pro +] | cephxsNWOG & NDOG - OPENING GAPS 🧪
Smart Gap Detection with Intelligent Filtering
Visualizes New Week Opening Gaps (NWOGs) and New Day Opening Gaps (NDOGs) with built-in intelligence to show you only what matters. No more cluttered charts with gaps from 3 months ago that price will never revisit.
The Display chart is on default settings with the size filter set to "Juicy Gaps only"
THE PROBLEM WITH GAP INDICATORS
Most gap indicators dump every single gap on your chart and call it a day. You end up with 100+ boxes cluttering your screen, half of which are miles away from current price and the other half are so tiny they're basically noise.
This one's different (That's what they all say).
SMART FILTERING (THE GOOD STUFF)
Two filters work together to keep your chart clean:
Size Filter: Uses ATR-based detection to filter out insignificant gaps
- Filter None: Show everything (if you really want chaos)
- Filter Insignificant: Hide the micro-gaps that don't matter
- Juicy Gaps Only: Only show gaps worth paying attention to (Mostly for HTF trading)
Distance Filter: Only displays gaps within range of current price
- Really Close: 0.5 ATR - tight focus on immediate levels
- Balanced: 1 ATR - sweet spot for most traders
- Slightly Far: 3 ATR - wider view for swing traders
- ✨ Or just turn off the filter by distance and it becomes like other indicators ✨
The magic: gaps appear and disappear as price moves toward or away from them. Old gaps that price has left behind fade out, and gaps that become relevant fade back in. Remove auto scaling if price is not trending and gaps keep flashing in and out.
GAP TYPES EXPLAINED
New Week Opening Gaps (NWOGs):
The gap between Friday's close and Monday's open. These form over the weekend when markets are closed and often act as significant support/resistance.
Two classifications:
Void Gaps: Gap direction aligns with Friday's candle direction (continuation)
Overlap Gaps: Gap direction conflicts with Friday's candle (potential reversal)
New Day Opening Gaps (NDOGs):
The gap between one day's close and the next day's open. Smaller but frequent - useful for intraday traders looking for fill targets.
FEATURES
Automatic Week/Day Detection: Handles forex (17:00 ET open) and futures (18:00 ET open) correctly
DST-Aware: Uses New York timezone with automatic daylight saving adjustments
50% Equilibrium Line: Marks the midpoint of each gap - key level for entries
Days Ago Labels: Shows how old each gap is at a glance
Extension Modes: Choose between live-extending boxes or fixed-width boxes
Separate Color Schemes: Different colors for void vs overlap NWOGs, bullish vs bearish NDOGs
INPUTS
NWOG/NDOG Display
Show NWOGs / NDOGS: Master toggle
Extension Modes:
Maximum NWOGs: Limit displayed gaps
Show Void/Overlap Gaps: Toggle each type independently
Filter Settings
Size Filter:
Only Show Near Price: Enable/disable distance filtering
Distance Filter: Really Close / Balanced / Slightly Far
Styling
Box Transparency: Fill and border opacity
Midline Style: Solid / Dotted / Dashed
Label Style: Simple ("NWOG, 5d ago") or Descriptive ("NWOG (Void Bull), 5d ago")
Label Size: Tiny / Small / Normal / Large
RECOMMENDED SETTINGS
For intraday (1m-15m):
Size Filter: Filter Insignificant
Distance Filter: Really Close or Balanced
Show NDOGs: On
Maximum NDOGs: 5-10
For swing trading (1H-4H):
Size Filter: Juicy Gaps Only
Distance Filter: Balanced or Slightly Far
Show NWOGs: On
Maximum NWOGs: 10-20
TIMEFRAME NOTES
Works on daily timeframe and below. Above daily, the indicator disables itself since NWOG/NDOG gap detection requires daily open/close data.
ASSET SUPPORT
Automatically handles different market open times:
Forex:
Futures:
Stocks/indices:
FAQ
Why do gaps appear and disappear?
That's the distance filter working. As price moves, gaps that were far away become relevant and appear. Gaps that price leaves behind disappear. This keeps your chart focused on actionable levels.
What's the difference between void and overlap gaps?
Void gaps continue Friday's direction (trend continuation). Overlap gaps conflict with Friday's direction and don't actually have a volume gap in price. Different traders prefer different types so i chose to differentiate them.
Why can't I see any gaps?
Check your filter settings. "Juicy Gaps Only" with "Really Close" distance filter is very selective. Try "Filter Insignificant" with "Balanced" for more gaps. Or simply turn off the filter if you are on an asset that has very few/no gaps... The indicator has gone through rigorous testing.
DISCLAIMER
This indicator is for educational purposes only. Opening gaps are one tool among many - they don't guarantee fills or reversals. Always use proper risk management and never trade based on a single indicator. Past gap fills don't guarantee future performance. Do your own analysis.
CHANGELOG
Pro +: Added smart size/distance filtering, void/overlap classification, NDOG support, DST-aware timezone handling. Tradingview handles the actual time shift.
Base: Initial NWOG visualization
Made with ❤️ by cephxs
ICT NDOG/NWOGICT NDOG / NWOG — Opening Gap Visualizer
Plots daily (NDOG) and weekly (NWOG) opening gaps.
An opening gap is the price range between the previous close and the new session’s open.
Features:
• Optional border lines at gap high/low.
• Optional Consequent Encroachment line (50%).
• Optional Quadrant lines (25% and 75%).
• Color customization
• Custom NDOG and NWOG amount (separated)
*Also included in ICT ULT (All In One) Indicator
*Feel free to suggest improvement in the comments

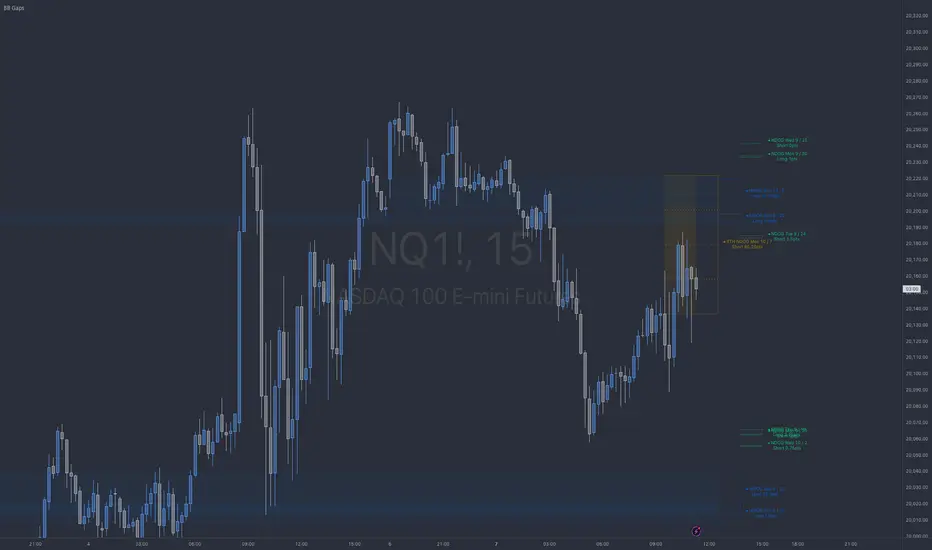
NWOG/NDOG by OutOfOptionsNew Week Opening Gap (NWOG) and New Day Opening Gap (NDOG)
NWOG and NDOG represent price imbalances formed when markets skip over certain levels at the start of a new week or trading day. These gaps often serve as magnets for price action throughout the week or day, drawing prices back to fill them while also functioning as key support or resistance zones. They are particularly relevant in futures markets, though less so in equities.
Consequent Encroachment (CE)
The CE, which is the midpoint of an NWOG or NDOG, frequently emerges as a critical level—especially if the gap remains unbalanced. In such cases, it can exert a strong pull on price, encouraging retracement or consolidation.
Indicator Features
This indicator allows you to display any number of NWOGs and NDOGs directly on your chart, with complete customization of their visual appearance. You can assign distinct colors to the most recent gaps for easy identification. Unlike other tools, it includes a filtering option to exclude minor gaps that may lack significance. Additionally, the "Smart" mode intelligently positions price labels to ensure they remain visible and uncluttered at all times.
How Does it Work
The indicator tracks all daily closes and new day opens, capturing the two values representing the top/bottom of NDOG/NWOG. I If the day begins on a Sunday, the gap is identified as NWOG; otherwise, it is classified as NDOG. A key feature of the indicator is that it avoids duplicating NDOGs that are also NWOGs.
Next, the indicator applies the size filter setting (if set above 0) to skip minor gaps. Valid gaps are then displayed on the screen using a style configured in the indicator settings for the most recent NDOG/NWOG.
To prevent the chart from becoming cluttered, the indicator limits the number of NWOG/NDOGs shown. When a new NWOG/NDOG is added, it checks the total displayed, and if this exceeds the configured limit, the oldest NWOG/NDOG is removed. Additionally, the indicator updates the display style of the previous NWOG/NDOG to the generic (non-last) style as specified in the settings.
For labels showing NWOG/NDOG price ranges and CE, the indicator offers a "Smart" option that dynamically positions labels 10 bars from the last candle and adjusts them every 5 candles. Otherwise, labels are placed at the end of the week for NWOGs and at the end of the following day for NDOGs.

ICT x Vihapa 4 in 1Indicator Description:
This indicator is designed to provide comprehensive market structure and session-based insights. It includes:
NWoG / NDoG Levels: Displays New Week Opening Gap (NWoG) and New Day Opening Gap (NDoG) for market context.
Key Opening Price Levels: Highlights significant time-based price levels, including 00:00, 08:30, 09:30, and 13:00.
Previous Key Levels: Marks critical historical levels such as the previous week's high and low, previous day’s high and low, and 4-hour highs and lows.
Trading Sessions: Clearly distinguishes major market sessions including the Asian, London, and New York sessions.
This indicator serves as a valuable tool for traders seeking to align their strategies with institutional price behavior and time-based market dynamics.

BB NWOG - NDOG - RTH NDOGThe BB Gaps Indicator is a comprehensive tool designed for traders looking to track and visualize significant opening gaps within various market sessions, including:
• New Day Opening Gaps (NDOGs): These gaps form between the closing price of the previous day and the opening price of the new day, providing insight into potential liquidity pools or imbalances.
• RTH New Day Opening Gaps (RTH NDOGs): This focuses on gaps that occur during Regular Trading Hours (RTH), capturing gaps between session closures and the next day’s open, ideal for intraday traders.
• New Week Opening Gaps (NWOGs): These gaps track the price differential between the last candle of the week and the first candle of the new trading week, providing a broader market perspective for swing traders.
Key Features:
• Dynamic Plotting: Visualize gaps with customizable extensions, box fills, and mid-range (50%) or quarter-range (25%, 75%) levels.
• Sidecar Labels: Handy sidecar labels display the gap information right on the chart for easy reference.
• Multiple Session Support: Track gaps across different trading sessions (Daily, RTH, Weekly) with adjustable plot extensions and fill styles.
• Configurable Limits: Set a maximum number of gaps to plot, ensuring your chart remains clean and clutter-free.
ICT NWOG/NDOG Gaps [TradingFinder] New Opening Gaps🔵 Introduction
🟣 Understanding ICT Opening Gaps
In the realm of technical analysis, mastering the art of recognizing market behavior and pinpointing key price levels is vital for making sound trading decisions. Among the array of tools available, the concept of opening gaps stands out for its ability to provide crucial insights.
The ICT (Inner Circle Trader) methodology offers a distinctive approach to understanding the importance of New Day Opening Gaps (NDOG), New Week Opening Gaps (NWOG), and New Monthly Opening Gaps (NMOG).
These gaps, representing the price differences between the close of a previous period and the open of the next, serve as key reference points that can greatly impact price movements.
The ICT trading approach highlights these gaps as potential zones of support and resistance. Prices often respond to these areas, either bouncing off or passing through and then retesting them. Within these gaps, significant levels such as the high and low are particularly important.
Additionally, the Event Horizon PD Array (EHPDA) concept, which is an intermediate level calculated from the average of neighboring NWOGs or NDOGs, adds another layer to this analysis.
This guide delves into ICT's New Daily, Weekly, and Monthly Opening Ranges, showing how these gaps can be effectively utilized in trading. By grasping the nuances of these gaps, traders can better forecast market behavior, identify key support and resistance levels, and refine their trading strategies.
🟣 The Gaps
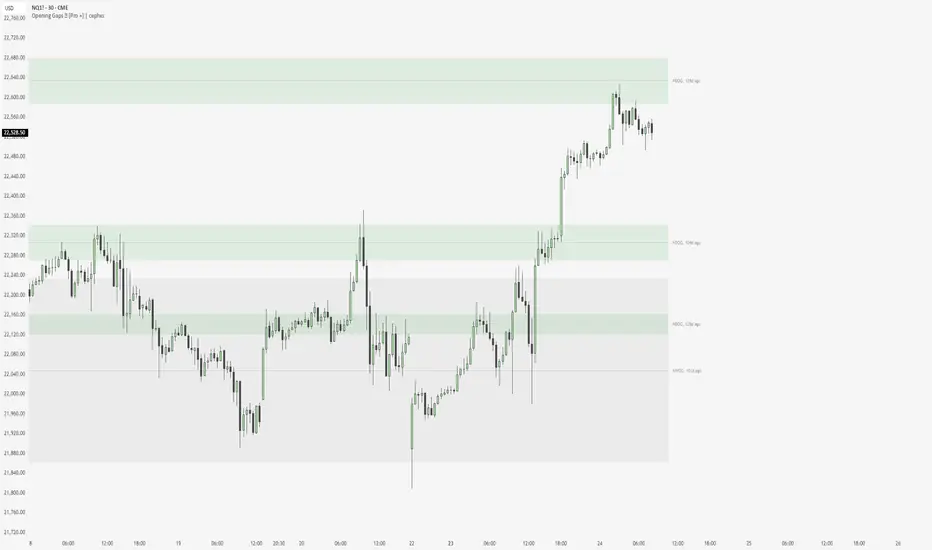
1. New Week Opening Gap (NWOG) : The NWOG is the price gap between Friday's closing price and Sunday's opening price. This gap is particularly crucial for traders who monitor weekly trends. Depending on the direction of the gap, the NWOG often serves as a pivotal support or resistance level.
2. New Day Opening Gap (NDOG) : The NDOG signifies the price difference between the closing price of the previous day and the opening price of the current day. Much like the NWOG, the NDOG is a key reference point for intraday traders.
Prices typically react to these levels, either reversing or continuing through the gap after a retest. NDOGs are instrumental in identifying short-term support and resistance levels, aiding traders in making decisions based on daily price movements.
3. New Monthly Opening Gap (NMOG) : The NMOG represents the gap between the closing price of the previous month and the opening price of the current month.
This gap is especially valuable for traders focusing on long-term trends and macroeconomic factors. As with NWOGs and NDOGs, the NMOG can act as a significant support or resistance level.
🔵 How to Use
Identifying Support and Resistance : Opening gaps often indicate potential zones where prices might reverse or find support/resistance. For example, if a new day opens below the previous day’s close (creating a NDOG), this gap could act as resistance, prompting traders to consider short positions if the price retests this level without breaking through.
Conversely, if the price opens above the previous day’s close, the gap might serve as support, offering a potential entry point for long trades.
Gap Fill Strategy : A popular strategy associated with opening gaps is the "gap fill" approach, where traders anticipate that the price will eventually return to fill the gap.
For instance, if there’s a significant NDOG at market open, a trader might expect the price to retrace back to the previous day’s close, effectively "filling" the gap. This strategy is particularly effective in markets that exhibit mean-reverting behavior.
Combining Gaps with Other Indicators : Traders often enhance their analysis of NDOG, NWOG, and NMOG by integrating other technical indicators. Aligning gap levels with tools such as Fibonacci retracements, moving averages, or existing support and resistance zones can provide additional confirmation for trade entries and exits.
🔵 Setting
Show and Color : You can control the display or non-display of the range as well as the color of the range.
Max Opening Range Update Method : You can control the number of ranges that are updated. If it is "All", all ranges that are not mitigated will be displayed. If "Custom", the ranges will be updated based on the number you specify.
Max Opening Range Update : The number of ranges to update.
🔵 Conclusion
The ICT New Daily, Weekly, and Monthly Opening Ranges provide traders with a systematic approach to understanding market dynamics and identifying critical support and resistance levels.
By analyzing these gaps, traders can gain deeper insights into potential price movements, spot high-probability trade setups, and strengthen their overall trading strategy. Whether you are focused on short-term day trading or long-term market trends, incorporating NDOG, NWOG, and NMOG analysis into your trading plan can be a powerful addition to your toolkit.

ICT New Day Opening GapNew Day Opening Gap
The New Day Opening Gap (NDOG) is defined by The Inner Circle Trader (ICT) as the separation in time/price that is caused by the 1-hour break that occurs each day in the futures market. The opening price of the gap is the very first tick that occurs at the 6:00pm restart; then we look at the 5:00pm closing price of the previous session. This New Day Opening Gap forms every day from Monday to Friday, but it does not include the gap between Friday's close and Sunday's open (because that is instead referred to as a New Week Opening Gap).
This is an example of a New Day Opening Gap (NDOG) for Wednesday, May 22, 2024 in CME_MINI:ES1!
How To Use NDOG
When an NDOG forms, it can be extended into future price action. One way to use these gaps is to look for it to be filled in by price action. Another usage for these gaps is to look for support & resistance to come in at the high and low of these NDOGs (as well as the midpoint).
Disclaimer
This indicator is mainly intended to work for Futures markets, and specifically the following Index Futures markets: E-mini S&P 500 Futures, E-mini NASDAQ-100 Futures, E-mini DOW Futures.
Given that, the indicator still supports various other markets/assets out-of-the-box, such as other types of Futures Markets, Forex markets, Stocks, Options, and more. The main difference will be that other markets may have NDOGs forming at different times, rather than the 5pm-6pm gap that occurs in the Index Futures.
Indicator Features
This indicator is 100% custom-built, not using code from any other existing NDOG plotting indicators. The purpose of this indicator was to overcome many shortcomings from other existing indicators. Therefore, this indicator has many UNIQUE features, such as:
Ability to maintain accuracy of the closing/opening prices even when changing chart settings (e.g., toggling ETH/RTH sessions, toggling BACK-ADJUSTMENT on futures contracts, toggling SETTLEMENT prices, etc.).
Draw up to 25 previous NDOGs, even on ultra-low timeframes like the 1-minute or 1-second chart.
Automatically or manually choose which NDOGs to hide/show on the chart.
Highly customizable, including a different color scheme to easily distinguish between the Current and Previous NDOGs.
Modified price values to correctly display prices that use a format like 109'32 (e.g., Bond Futures or Wheat Futures).
Helpful tooltips to provide more detailed information about the NDOGs or about the current Input Settings.
Error Messages
There are some conditions which can cause the script to fail and display an error message (by clicking the red exclamation mark next to the indicator.)
Error messages:
Use a Standard Chart Type : this will occur when using a non-standard chart such as Heikin Ashi, Renko, Point & Figure, etc.
Use a Daily or Lower Timeframe : this error will appear when using a higher timeframe chart like weekly or monthly, because it can clutter the chart since NDOGs can form every day.
NDOG was not detected : this means that no NDOG was found, for example if the chart did not have enough bars/candles (e.g., some Options markets).
Exceeded the maximum lookback for Bar Replay mode : when using bar replay mode; this can depend on the amount of historical bars available in different account subscription types.
Unable to Activate Bar Replay mode : if the indicator could not be used in Bar Replay mode.
Restart Bar Replay : if the indicator works in Bar Replay but it detected an error that would cause NDOGs to be plotted incorrectly.
NDOG was not detected. Toggle "Error Handling" Option at your own discretion : this is more of a warning message that will appear when the indicator does not detect any actual gap between the days (e.g., Forex markets where it is continuously traded through each day, without any gap forming in between). But the warning can be dismissed by toggling the checkbox at the bottom of the Indicator's Input Settings.
This is an example of what a script error would look like.
Indicator Settings
Most settings are self-explanatory or have a tooltip with information on what the setting does, so this section will only briefly cover the available settings.
The "Extend to End of Week" option is enabled by default, which will extend each NDOG only up to the end of the week that it belongs to. This option can be toggled OFF to automatically extend all NDOGs to the right-most candle on the chart.
Previous NDOGs: Between 1 and 25 previous NDOGs can be displayed. The checkbox can be toggled to quickly hide all previous NDOGs (but the same effect would be reached by setting the value to 0).
Hide Current NDOG: the current NDOG (colored in Green in the example above), can be optionally hidden from being plotted.
These settings are used to customize the visual style of the most recent NDOG (also known as the "Current" NDOG). Note: the exact same set of settings are available for the Previous NDOGs. The text next to each NDOG can be optionally hidden to clean the chart a little.
These are settings to customize the appearance of the Price Table on the right, including the ability to hide it completely.
One of 7 available overlap handling options can be used to filter which NDOGs are plotted on the chart. By default, the "None" option will be selected, meaning that all valid NDOGs are plotted on the chart.
Date Format : select the format of the date that is shown next to each NDOG.
Timezone : choose the timezone for the NDOG closing/opening date-times that are displayed (only in tooltips when you hover over an NDOG label).
NDOG Label : choose the details to display next to each NDOG (e.g., date, or NDOG number, or both).
Price Format : only two options: Auto/Decimal. "Auto" uses custom processing to allow displaying values such as 109'32 for Bond futures.
This option can be toggled to allow displaying NDOGs for markets that may not have an actual gap between days, such as Forex markets, or BTC/USD (which is traded 24/7). Note: this option must be used at your own discretion because the opening/closing times for the NDOGs are not guaranteed to be accurate.
Tooltips
The indicator provides additional details about an NDOG when you hover over a row in the Price Table.
Note: the same information can be found by hovering over the Text Label that is to the right of each NDOG.
Overlap Handling
The tooltip next to "Select a Strategy" in the options will provide details on each overlap handling strategy. Additionally, when a strategy is selected, a new row in the Price Table will appear; hovering over that will show details about the currently selected strategy, as well as any suggestions in case the inputs were invalid. When a strategy hides an NDOG, the number in the Price Table will be replaced with an "Eye" icon, indicating that it is not currently plotted on the chart.
Available strategies are:
Option 1 (Gradients) : select the percentage opacity to shade NDOGs in. The more recent NDOGs will be closer to the maximum opacity defined, while the older NDOGs will appear more transparent, closer to the minimum opacity defined. Note: only affects previous NDOGs, not the current NDOG.
Option 2 (Week Extension) : select the number of weeks to extend each NDOG up to. Note: this will override the "Extend to End of Week" setting, regardless whether it is toggled ON or OFF.
Option 3 (Nested Gaps) : hides nested gaps, i.e., NDOGs that are enclosed within another NDOG. Note: this option is only available when the "Extend to End of Week" setting is disabled .
Option 4 (Intersecting Gaps) : hides intersecting/overlapping gaps, i.e., NDOGs that overlap one another (this may also include, but is not limited to, nested gaps). The drop-down next to this option allows choosing the priority of which NDOGs to hide first. Note: this option is only available when the "Extend to End of Week" setting is disabled .
Option 5 (Gap Width) : the chart will only show NDOGs that have a width between the defined parameters. This can be useful to filter out NDOGs that are deemed "insignificant". For example, the Inner Circle Trader will generally filter out of his analysis any NDOGs that are less than a point (4 ticks) for Index futures.
Option 6 (Close Proximity) : the chart will only show the NDOGs that are within a certain range from the market price. This can be useful when plotting multiple NDOGs while using auto-scaling on the chart. By only showing nearby NDOGs, it will prevent the auto-scaling from having to compress the candles to fit the far-away NDOGs onto the screen.
Option 7 (CSV) : this option is used if none of the others suit you well; it allows specifically choosing which NDOGs to hide or show on the chart.
This is an example that chooses the Overlap Handling Strategy Option 6. Note that in this example, the tooltip in the price table shows a warning that the Input Number should be increased to plot some NDOGs on the chart.
Tips
Chart settings can be toggled to "Scale price chart only" to prevent the auto-scaling of TradingView from compressing the chart if there are NDOGs that are far away from the current market action.
If you change a lot of indicator settings such as NDOG color schemes, you can save the settings as the Default to prevent your settings from resetting the next time you use the indicator.
ICT NWOG/NDOG [Source Code] (fadi)New Week Opening Gap (NWOG) and New Day Opening Gap (NDOG) are areas on the chart where price tend to react to and has the potential of moving from one gap to the next. These gaps can act as support and resistance zones where price can bounce of, or go through and retest. Areas of interest are the high, low, the Consequent Encroachment (C.E.), which is the middle between high and low of each gap.
Event Horizon is the 50% distance between two NWOGs and price tend to react to, and could act as Premium/ Discount between two NWOGs.
New Week Opening Gap (NWOG)
The difference between Friday close, and Sunday open. Consequent Encroachment (C.E.) is the area between two NWOGs.
Settings NWOG
- The Colors in the form of Current/Previous and line style for NWOG
- Background color to use for Current/Previous
- Number of NWOGs to use by the indicator (ICT recommends using minimum of 5)
- Extend Configuration:
-- Always Extend all NWOGs
-- Above and below only Shows the immediate two NWOGs that are above and below current price. These two NWOGs are recalculated as price moves
-- Any that is near current price Any NWOG that is near the current price, this can result in multiple NWOGs being displayed, with some overlapping
- Event Horizon only applicable when using the "Above and below only settings"
-- Show Date label and type of gap
New Day Opening Gap (NDOG)
The difference between Yesterday's close and Today's open.
Settings NDOG
- The Colors in the form of Current/Previous and line style for NDOG
- Background color to use for Current/Previous
- Number of NDOGs to use by the indicator, default is 1 but price tend to react to previous ones as well
- Extend Configuration:
-- Always Extend all NDOGs
-- Above and below only Shows the immediate two NDOGs that are above and below current price. These two NDOGs are recalculated as price moves
-- Any that is near current price Any NDOG that is near the current price, this can result in multiple NDOGs being displayed, with some overlapping
-- Show Date label and type of gap
Other Settings
Number of candles to use in calculation is used to calculate the size of the candles in order to derive the distance from current price. If current candle sizes is more important than over longer period of time then use 14 or near that number
Factor multiplier for distance test is the number above times X value. Lower timeframes require a higher number than a larger timeframe. If day trading, a value between 10 and 20 is probably best. If swing trading, a value between 5 and 10 is probably best.
Buffer How many candles beyond current price to extend the gaps by. this is helpful to provide cleaner view of the price action

NDOG & Dynamic Event Horizon° (Experimental)The ICT concept of New Day Opening Gaps (NDOG) is simply an imbalance that may manifest at Daily Opening time. This gap in price is formed by the Close at 5PM EST and the open at 6PM EST.
According to ICT's studies, this gap in price holds a lot of significance when it comes to price action, acting as a magnet or a point of reference during the day (and following days/weeks).
This script applies the supporting concepts of New Week Opening Gaps (Event Horizon and OTE areas) to NDOGs, mimicking my NWOG & Dynamic Event Horizon° indicator. Equally to the latter, this script dynamically selects the most relevant NDOG Dealing Range and plots their EH and OTE levels automatically.
// Please refer to the NWOG indicator post linked above for more information about these concepts
Available Alerts:
– Cross Below Event Horizon
– Cross Above Event Horizon
– New NDOG Range Established
Important Remarks:
– This is purely an experiment, and has not been taught by ICT publicly in any way. Treat this material accordingly.
– Note that although these work on all timeframes, the lower in resolution one goes, the less gaps will be available due to data availability.
– This indicator works on charts that have the NDOG already present in chart (i.e. no crypto assets, unless one looks at CME crypto futures such as BTC1! and ETH1! ).
– The dollar index's NDOGs have a slightly different timestamp, however this has been taken care of and will allow to be plotted ONLY for the TVC:DXY ticker.
TrandingView struggles to display the indicator correctly for the default view, check out its accurate appearance here:

ICT NWOG/NDOG (fadi)New Week Opening Gap (NWOG) and New Day Opening Gap (NDOG) are areas on the chart where price tend to react to and has the potential of moving from one gap to the next. These gaps can act as support and resistance zones where price can bounce of, or go through and retest. Areas of interest are the high, low, the Consequent Encroachment (C.E.), which is the middle between high and low of each gap.
Event Horizon is the 50% distance between two NWOGs and price tend to react to, and could act as Premium/ Discount between two NWOGs.
New Week Opening Gap (NWOG)
The difference between Friday close, and Sunday open. Consequent Encroachment (C.E.) is the area between two NWOGs.
Settings NWOG
- The Colors in the form of Current/Previous and line style for NWOG
- Background color to use for Current/Previous
- Number of NWOGs to use by the indicator (ICT recommends using minimum of 5)
- Extend Configuration:
-- Always Extend all NWOGs
-- Above and below only Shows the immediate two NWOGs that are above and below current price. These two NWOGs are recalculated as price moves
-- Any that is near current price Any NWOG that is near the current price, this can result in multiple NWOGs being displayed, with some overlapping
- Event Horizon only applicable when using the "Above and below only settings"
New Day Opening Gap (NDOG)
The difference between Yesterday's close and Today's open.
Settings NDOG
- The Colors in the form of Current/Previous and line style for NDOG
- Background color to use for Current/Previous
- Number of NDOGs to use by the indicator, default is 1 but price tend to react to previous ones as well
- Extend Configuration:
-- Always Extend all NDOGs
-- Above and below only Shows the immediate two NDOGs that are above and below current price. These two NDOGs are recalculated as price moves
-- Any that is near current price Any NDOG that is near the current price, this can result in multiple NDOGs being displayed, with some overlapping
Other Settings
Number of candles to use in calculation is used to calculate the size of the candles in order to derive the distance from current price. If current candle sizes is more important than over longer period of time then use 14 or near that number
Factor multiplier for distance test is the number above times X value. Lower timeframes require a higher number than a larger timeframe. If day trading, a value between 10 and 20 is probably best. If swing trading, a value between 5 and 10 is probably best.
Buffer How many candles beyond current price to extend the gaps by. this is helpful to provide cleaner view of the price action
ICT NWOG/NDOG GapsThis indicator reveals the new week opening gaps (NWOG) and new day opening gaps (NDOG) as well as the most recent Regular Trading Hour (RTH) Gap. The NWOG is the gap between Friday's closing price and Sunday's opening price. The NDOG is the gap between the opening price and closing price of the previous day. These gaps can be draws on liquidity as well as general reference points of where the market is and has been.
The RTH gap is the difference between the NY Open price at 9:30AM EST and the previous day's closing price during Regular Trading Hours. This gap can also give you an idea of where the market is headed.
ICT Opening Gaps [MK]
The indicator plots levels which can act as magnets to price. The levels are gap areas which are used within the ICT (The Inner Circle Trader) trading system.
The indicator plots 5 areas of interest:
1: Daily Volume Imbalances - Referencing the Daily chart, boxes are calculated from close to open between all candles. Candles which have only 'wicks' between the close and open prices are considered 'volume imbalances. The boxes can then be shown on LTFs to aid in decision making for intraday traders. Imbalances can be limited to a maximum amount shown and mitigated imbalances can be removed from the chart. All colors can be customised.
Volume Imbalance example:
2: NWOG - New Week Opening Gap - Plotted from Friday Close at 1659 to Sunday Opening at 1800 (EST). The current NWOG can be displayed on its own, or previous weeks can also be shown (ICT recommends the previous 4 weeks also). Boxes are plotted with a midline and all colors can be customised.
New Week Opening Gaps example:
3. NDOG - New Day Opening Gaps - Plotted from day close at 1659 (EST) to restart at 1800 (EST). All colors can be customised. These gaps can be very small so line widths of 3+ are recommended if the lines are to be seen on HTFs
New Day Opening Gap example:
4. New Opening Gap - Plotted from close at 1659 to Session open at 0930 (EST). These areas can possibly be closed/filled after opening at some time. The indicator will draw box to the right of price which shows if the Opening Gap is UP or DOWN. The box will change color to show up or down, or text alone can be used instead of the box. All colors can be customised.
New Opening Gap Box example:
5. 0930 Opening Line - Draws a horizontal line from the opening price at 0930 (EST) to the last bar on the chart. This is the level used to calculate the New Opening Gap. All colors can be customised.
0930 Opening Line example:

Weekly Opening Gap (cryptonnnite)In the context of general equities, opening price that is substantially higher or lower than the previous day's closing price, usually because of some extraordinarily positive or negative news. Opening gap using as a potential target which market usually trades to.
