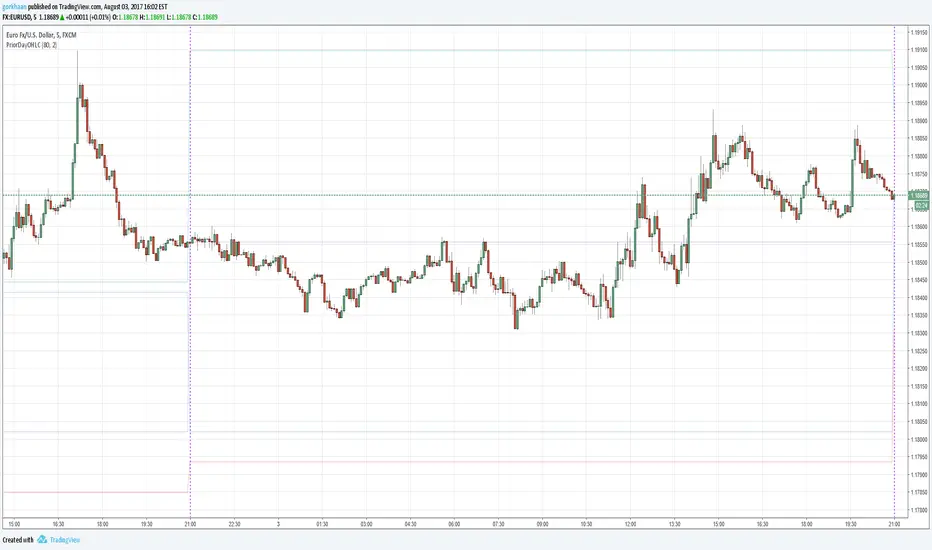
Previous OHLC LevelsQuick dirty code for personal use. Plots previous OHLC levels based on a selected time-frame on the chart.
Not bad if you want to see different time-frame levels.
Fill function can serve to highlight the daily range (high-low or open-close) on non-standard charts
Uses base code from JayRogers
Ohlc

Multi Bar OHLC Compare Panel (Floating Grid)Multi Bar OHLC Compare Panel by RagingRocketBull 2019
version 1.0
This indicator lets you compare OHLCV values from several specified bars. Bars can be dynamic/persistent.
You can also use it as an alternate OHLC panel if you don't like small font of the native TradingView panel.
It uses Pinescript v4 to output data dynamically as string labels in a horiz/vertical grid.
Features:
- Floating Panel with customizable horiz/vertical layout and grid spacing
- Support for up to 5 OHLC bars (highlighted with markers)
- Outputs Bar #/index, OHLCV, Bar Change Value/%, Exchange/Ticker, Timeframe, Timestamp strings
- Dynamic (fixed offset)/Persistent bars (fixed time)
- Show/Hide parts of strings
- Full output string customization, including text size, date/time format and delimiters
- 2 Anchor points for panel offset: cur bar high or range high
- Bar Change can change color
Usage:
- specify at least 1 bar index as OHLC source
- select anchor point to position the panel
- select horiz/vertical grid layout
- adjust horiz/vertical spacing
- customize output strings as needed
Notes:
- this indicator uses Pinescript v3 Compatibity Framework
- both bars 1,2 are required for log scale adjustment to work
- you can't attach the panel to screen's top/bottom and must use offset/anchor because, unlike plotshape, string labels don't support yloc=yloc.top/bottom, only yloc.above/belowbar
- you can't precisely align strings in a grid because there's no label.get_width/height to calculate mid/left points, only get_x/y/text. Alignment will break depending on string length, zoom and change color option on/off
- bar change is rendered as a separate label when change color is enabled (2 panels total) and merged into the main panel when disabled (single panel)
- you can't change the order of strings as playing with the natural order of things isn't the best of ideas
- you can modify the script to compare up to 50 OHLC bars, but do you need that much power? Of course, you do.
- you can't set color/style for string labels in Style UI, so a few extra settings were added.
- bar index is limited to 5000 for free accounts (10000 for paid), will show an error when exceeded, also when it exceeds the total number of bars in history
- in persistent bars mode all bars with index > 0 are considered persistent, bar 0 always remains a dynamic bar
- persistent bars' offset is reset: in replay mode on exit or when price reaches cur bar, or when panel layout is changed from h to v in both replay/realtime modes
- initial pos of each persistent bar relative to the first realtime bar anchor doesn't change during session - new persistent bars introduced during session are attached to the most recent cur bar anchor
P.S. Everything is proceeding as I have foreseen

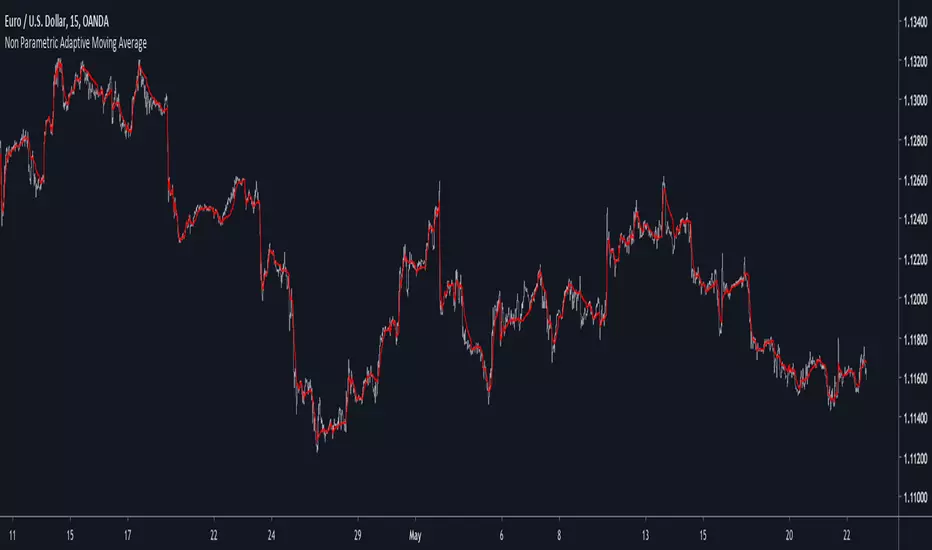
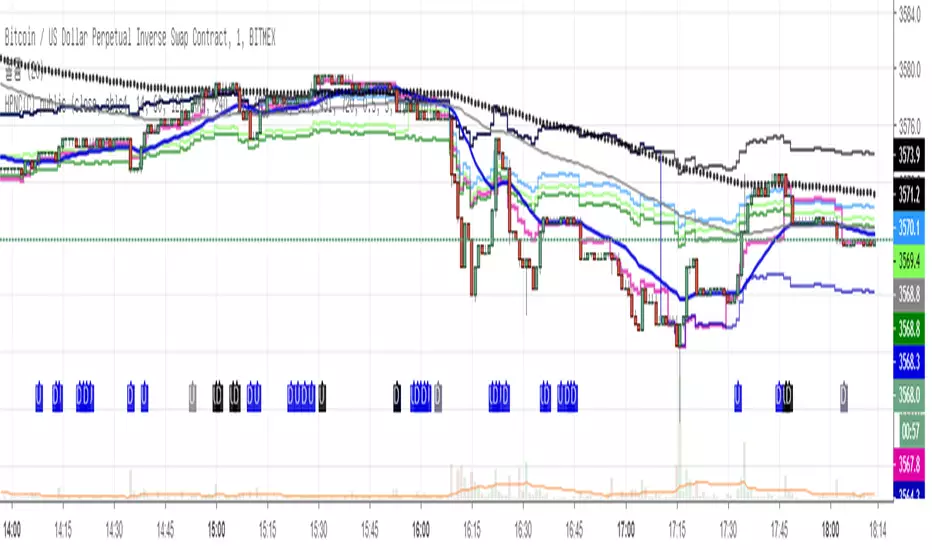
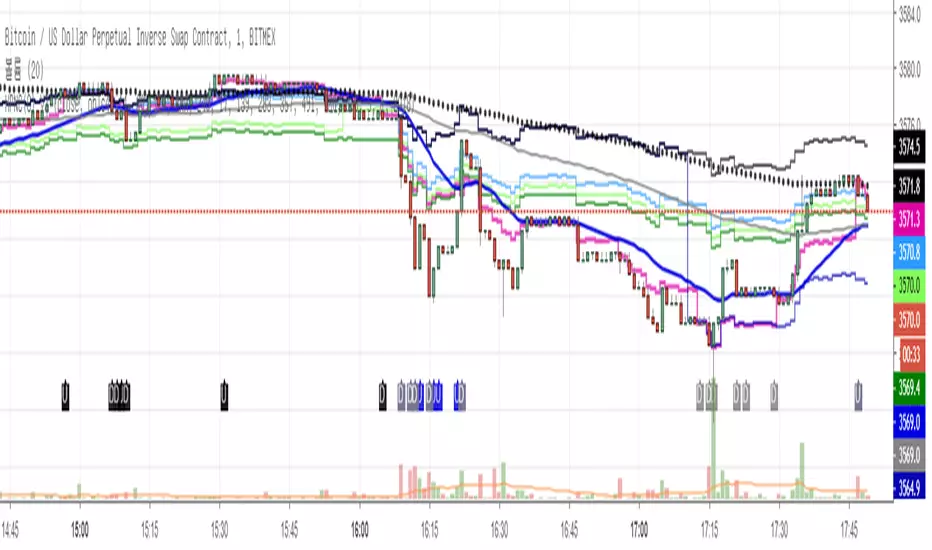
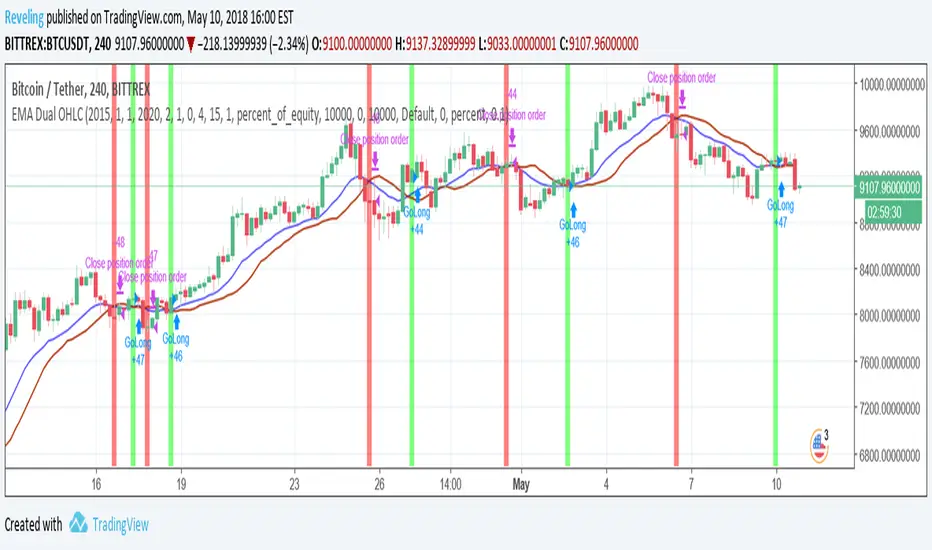
Non Parametric Adaptive Moving AverageIntroduction
Not be confused with non-parametric statistics, i define a "non-parametric" indicator as an indicator who does not have any parameter input. Such indicators can be useful since they don't need to go through parameter optimization. I present here a non parametric adaptive moving average based on exponential averaging using a modified ratio of open-close to high-low range indicator as smoothing variable.
The Indicator
The ratio of open-close to high-low range is a measurement involving calculating the ratio between the absolute close/open price difference and the range (high - low) , now the relationship between high/low and open/close price has been studied in econometrics for some time but there are no reason that the ohlc range ratio may be an indicator of volatility, however we can make the hypothesis that trending markets contain less indecision than ranging market and that indecision is measured by the high/low movements, this is an idea that i've heard various time.
Since the range is always greater than the absolute close/open difference we have a scaled smoothing variable in a range of 0/1, this allow to perform exponential averaging. The ratio of open-close to high-low range is calculated using the vwap of the close/high/low/open price in order to increase the smoothing effect. The vwap tend to smooth more with low time frames than higher ones, since the indicator use vwap for the calculation of its smoothing variable, smoothing may differ depending on the time frame you are in.
1 minute tf
1 hour tf
Conclusion
Making non parametric indicators is quite efficient, but they wont necessarily outperform classical parametric indicators. I also presented a modified version of the ratio of open-close to high-low range who can provide a smoothing variable for exponential averaging. I hope the indicator can help you in any way.
Thanks for reading !
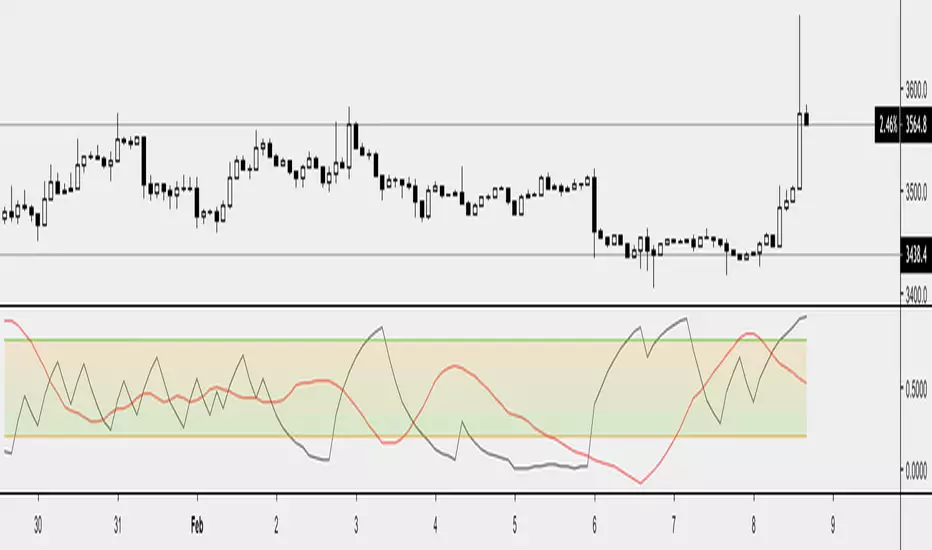
Japanese Correlation CoefficientIntroduction
This indicator was asked and named by a trading meetup participant in Sevilla. The original question was "How to estimate the correlation between the price and a line as easy as possible", a question who got little attention. I previously proposed a correlation estimate using a modification of the standard score (see at the end of the post) for the estimation of a Savitzky-Golay moving average (LSMA) of order 1, however something faster could maybe be done and this is why i accepted the challenge.
Japanese Correlation
Correlation is defined as the linear relationship between two variables x and y , if x and y follow the same direction then the correlation increase else decrease. The correlation coefficient is always equal or below 1 and equal or above -1, it also have to be taken into account that this coefficient is quite smooth. Smoothing is not a problem, scaling however require more attention, high price > closing price > low price, therefore scaling can be done. First we smooth the closing/high/low price with a simple moving average of period p/2 , then we take the difference of the smoothed close with the smoothed close p/2 bars back, this result is then divided by the difference between the highest smoothed high's with the lowest smoothed low's over period p/2 .
Since we use information provided by candlesticks (close/high/low) i have been asked to publish this estimator with the name Japanese correlation coefficient , this name don't imply the use of data from Japanese markets, "Japanese" is used because of the candlestick method coming from Japan.
Comparison
I compare this estimation with the correlation coefficient provided in pinescript by the correlation function.
The estimation in orange with the original correlation coefficient using n as independent variable in blue with both length = 50.
comparison with length = 200.
Conclusion
I have shown that it is possible to roughly estimate the correlation coefficient between price and a linear function by using different price information. Correlation can be further estimated by using homogeneous bridge OHLC volatility estimators thus making able the use of different independent variables. I really hope you like this indicator and thanks to the meetup participant asking the question, i had a lot of fun making the indicator.
An alternative method

Daily OHLC UpdatedThis plots the daily OHLC values as well as a few other options.
The base indicator plots and colors a daily open line. When line is green close is above open. When line is red close is below day open.
You can also turn on background highlighting.
Background will be green (default) If close is above day open
Background will be red (default) If close is below day open
There is also an option to turn on indicators on the bottom of your chart:
Arrow up will be green (default) If close is above day open
Arrow down will be red (default) If close is below day open
Next version will be adding alerts.

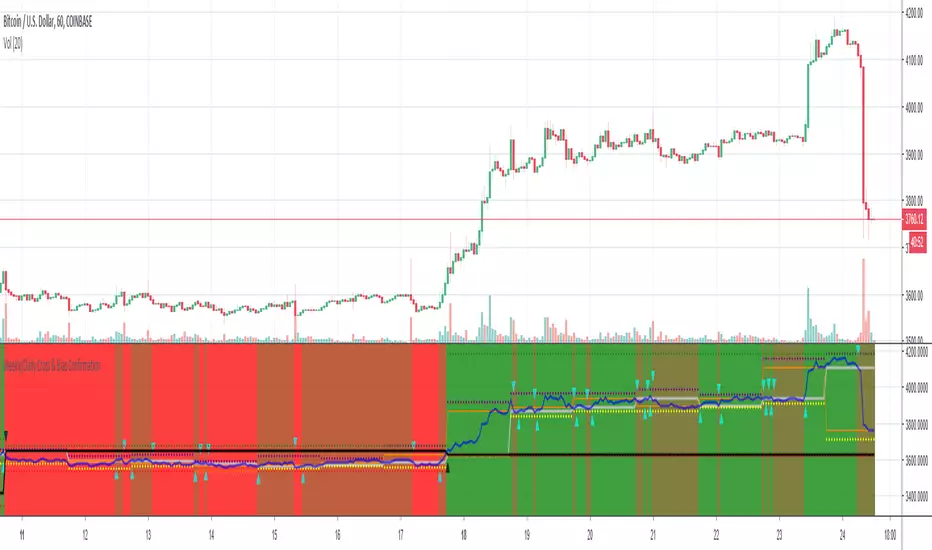
Weekly/Daily Cross & Bias ConfirmationThis indicator plots the weekly and daily open in addition to a current close price line.
It also signals when price closes above or below the daily and weekly opens.
Also, the bull/bear bias is painted on this indicator as well.
Black is the weekly open
Silver is the daily open
Weekly is default black arrows. Up is going above open, down is going below
Daily is default aqua arrows. Up is going above, down is going below
Weekly OHLC Plus 3 Weekly TF EMAsPlots weekly OHLC (with option to turn on monthly Open and Close) and 3 Weekly resolution EMAs (customizable).
This indicator is a combination of a few I've created/updated here on TV.
First part plots Weekly OHLC with an option to plot monthly open and close.
This indicator also plots on your chart 3 EMAs (customizable) from the Weekly timeframe (resolution).
The default settings (all EMAs)
200 - Orange
50 - Purple
20 - Black
There is no smoothing so the EMA line will appear jagged.

Monthly OHLCThis indicator displays the monthly Open, High, Low and Close price on a chart.
Very helpful indicator for starting your trading week (I use it every week in FOREX, Crypto, and Equities).
In conjunction using this on the Weekly & Daily timerfame with a 200, 10 and 5 EMA you can start your week off with a probable bull or bear bias.
Rogers & Satchell Volatility EstimationFirst off, a huge thank you to the following people:
theheirophant: www.tradingview.com
alexgrover: www.tradingview.com
NGBaltic: www.tradingview.com
The Rogers & Satchell function is a volatility estimator that outperforms other estimators when the underlying follows a geometric Brownian motion with a drift (historical data mean returns different from zero). As a result, it provides a better volatility estimation when the underlying is trending. However, the Rogers & Satchell estimator does not account for jumps in price (gaps). It assumes no opening jump. The function uses the open, close, high, and low price series in its calculation and it has only one parameter, which is the period to use to estimate the volatility.
This script allows you to transform the volatility reading. The intention of this is to be able to compare volatility across different assets and timeframes. Having a relative reading of volatility also allows you to better gauge volatility within the context of current market conditions.
For the signal lie I chose a repulsion moving average to remove choppy crossovers of the estimator and the signal. This may have been a mistake, so in the near-future I might update so that the MA can be selected. Let me know if you have any opinions either way.
Want to Learn?
If you'd like the opportunity to learn Pine but you have difficulty finding resources to guide you, take a look at this rudimentary list: docs.google.com
The list will be updated in the future as more people share the resources that have helped, or continue to help, them. Follow me on Twitter to keep up-to-date with the growing list of resources.
Suggestions or Questions?
Don't even kinda hesitate to forward them to me. My (metaphorical) door is always open.

SadLittleThings Price Compare With Offset MTF by RRBSadLittleThings Price Compare With Offset MTF by RagingRocketBull 2018
Version 1.0
This indicator lets you compare multiple assets across different timeframes, supports offsets and alpha multipliers.
Standard TradingView Compare doesn't have Offset/Timeframe/Multiplier options, hence this indicator.
Features:
- compare current asset's price with 2 custom ext OHLC sources
- plot sources as lines/bars/candles
- use offset:
- for lines - both positive/negative offsets, unlimited
- for bars/candles - only positive offsets <= 5000
- specify timeframe for each source
- uses timeframe textbox instead of input resolution dropdown to allow for 240 120 and other custom TFs
- support for timeframes in H: H, 2H, 4H etc
- show/hide sources
- colorize sources
- convert source price to 1000s, mlns, or blns using alpha multiplier
- total bars counter
Notes on using offsets:
- Max offset is defined by study max_bars_back which is limited to 5000 for free accounts. This variable specifies the number of history bars an indicator can access.
- if you see the 'internal server study error' => one of the indexes of ohlc series is out of bounds (i.e. close ) => decrease the offset <= 5000 or switch to line type
- you will be limited only by the total number of bars in history (n) +/- 1 full screen of empty bars
- you can't scroll past the beginning of history - 1 empty screen and past the end of history + 1 empty screen to be able to still see the line with applied offset
- before applying a large offset, scroll back long enough to make sure you have enough history loaded
- if you have a long history the indicator will get slower, its UI less responsive. Reloading the page may fix that.
- you will not see source's history past the beginning of the current asset - open the chart with the longest history first (i.e. BLX, not COINBASE)
- Make sure that the Left Price Scale shows up with Auto Fit Data enabled. You can reattach the indicator to a different scale in Style.
- you may not be able to plot intraday TFs < current TF, because free accounts are limited to TFs >= D1 (i.e. D, 2D, 3D, W), but you can still plot, say, H4+ on a lower TF H1 chart
1. uses plot*, security, change

Weekly OHLC UpdatedWeekly OHLC first edit is to include a standard style.
From here we'll be adding a few moving averages and a few other things I find helpful in both in crypto and FOREX trading.

Price Open/High/Low/CloseAnother indicator that shows Open, High, Low, Close on multiple timeframes.
It can be used to discover possible support/resistance areas on lower timeframes.
Other indicators may do the same thing but just added some custom timeframes
Is Open equal to High or LowMany people are watching opening price on each time axis. Opening price is very important.
This indicator displays OHLC Open as a line in multiple time frame.
If open is close to high or low, the color of the line changes.
The fact that they are close means the strength of the market flow and the firmness of that price range.
Note:
The color of the line will not be fixed until bar is closed.
And when using, please set arbitrary coefficient according to each market.
Coefficient e.g.
EURUSD: 0.00005
BTCUSD: 1
DJI: 5
BTCJPY: 100
USDJPY: 0.01
NI225: 2

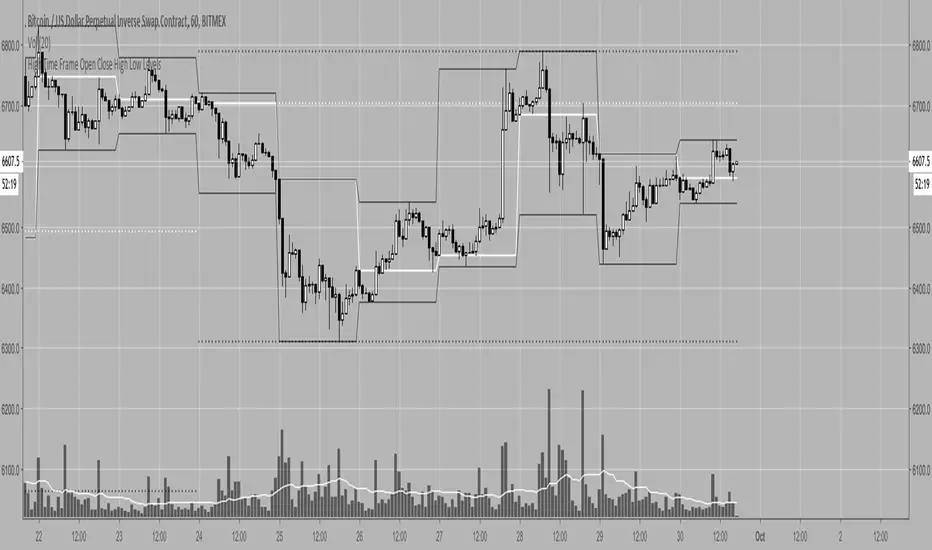
High Time Frame Open Close High Low LevelsGives you the OHLC levels of the weekly and daily candles as levels in whatever timeframe you're on so you can have a macro view in lower timeframes without having to switch timeframes constantly.
You may toggle the visibility of all the daily or weekly levels as well as each individual open/close/high/low.
The line styles and colors are customizable.


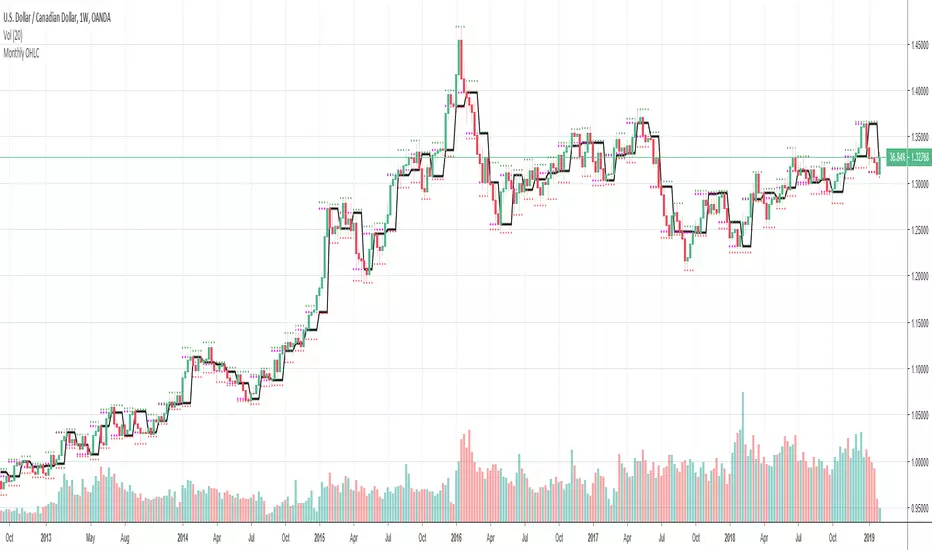
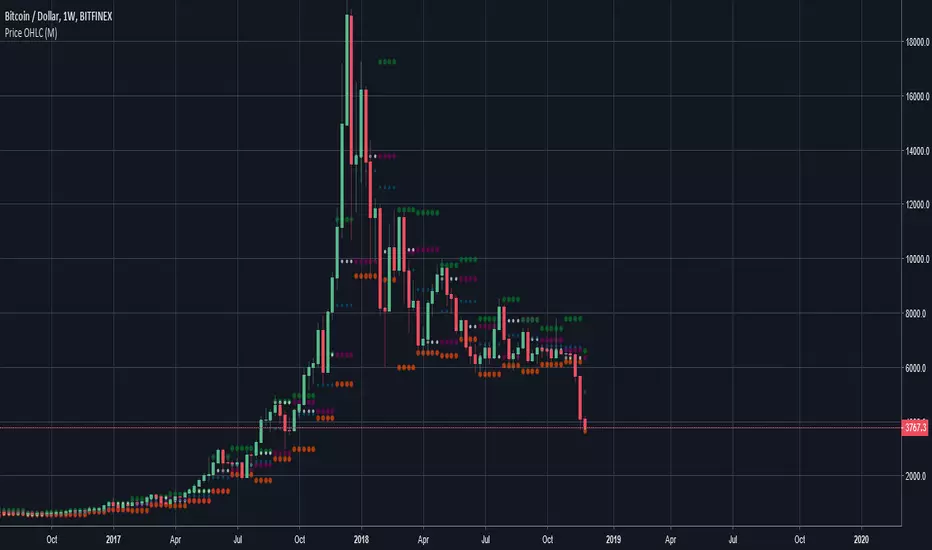
OHLC Daily Resolution BandsShout out to nPE- for the idea.
Bands made with stdev from 10 day OHLC.
Keeps resolution to daily, so you can use bands as daily pivots for day trading.
Upper band 1=yesterday close + 0.5 std(ohlc,10)
Upper band 1=yesterday close + 1 std(ohlc,10)
Mid=yesterday close
Lower band 1=yesterday close - 0.5 std(ohlc,10)
Lower band 2=yesterday close - 1 std(ohlc,1

Previous Daily Open/High/Low/CloseThis indicator plots the previous day's open, high, low and close levels on the chart
Published by Luke (DisciplinedTrader.co.uk)