Bollinger Bands Strategy (MA type)The types of moving averages that Mr. Kıvanç Özbilgiç uses in his indicators and especially the "MACD Reloaded" and "SuperTrended Moving Averages" indicators gave me an idea.
Better results can be obtained in different time frames by increasing the range of Moving averages used in Bollinger Bands.
It is a trial and educational work only.
מתנדים

rsisma imkind dailyrsi 14
sma 8
time fram : weekly and daily
rsi 14
sma 8
time fram : weekly and daily
rsi 14
sma 8
time fram : weekly and daily
rsi 14
sma 8
time fram : weekly and daily

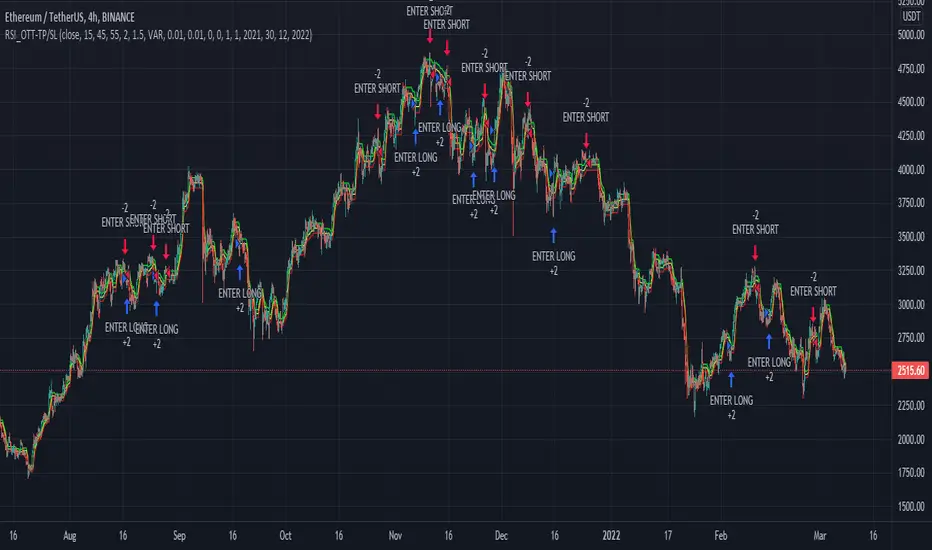
RSI_OTT - TP/SLWhile creating this strategy, I was inspired by "ott(by Anıl Özekşi)" and "RSI + Bollinger Double Strategy(by ChartArt)".
Basically, the strategy uses ott bands instead of bollinger bands in the "RSI+Bollinger Double Strategy".
User can select take profit, stop loss, position direction(long, short or both) and the other ott parameters via interface.
OTT-Stoch-TP/SLThis strategy combines stochastic oscillator and OTT (OTT is originally owned by Anıl Özekşi).
The strategy is triggered at fast OTT and slow OTT crossing points. User can select the "Evaluate Stoch OTT" option which is validate the crossing points through stochastic oscillator.
In the same way, user can select "take profit", "stop loss" and position direction(long, short or both) via interface.
By the way, Stoch OTT is not classic Stochastic oscillator. Actually, it is also combined classic stochastic oscillator and OTT for long term validation to base strategy.

RSI_Boll-TP/SLThis strategy is originally "Bollinger + RSI , Double Strategy (by ChartArt)"
I added just TP/SL exit point, position direction selection(long, short or both) and time window into that strategy.

Chanu Delta RSI StrategyThis strategy is built on the Chanu Delta RSI , which indicates the strength of the Bitcoin market. The problem with the previous Chanu Delta Strategy was that it was simply based on the price difference between the two Bitcoin markets, so there was no universality. However, this new Chanu Delta RSI strategy solves the problem by introducing an RSI that compares the price difference trend.
When the Chanu Delta RSI hits “Bull Level” and “Bear Level” and closes the candle, long and short signals are triggered respectively. The example shown on the screen is a default setting optimized for a 4-hour candlestick strategy based on the Bybit BTCUSDT futures market. You can use it by adjusting the setting value and modifying it to suit you.
This strategy is selectable from both reference and large amplitude BTCUSD markets in order to enable fine backtesting. I recommend using BYBIT:BTCUSDT for the reference market and COINBASE:BTCUSD for the large amplitude market.
(Note) Using the "Chanu Delta RSI" to know the current indicator value in real time, it is convenient to predict the signal of the strategy.
(Note) Because the Chanu Delta RSI represents the price difference based on the Bybit BTCUSDT futures market, backtesting is possible from March 2020.
_____________________________________________________________
이 전략은 비트코인 시장의 강점을 나타내는 Chanu Delta RSI를 기반으로 합니다. 기존 Chanu Delta 전략의 문제점은 단순히 두 비트코인 시장의 가격차를 기준으로 하여 보편성이 없었다는 점이다. 하지만 이번 새로운 Chanu Delta RSI 전략은 가격차이 추세를 비교하는 RSI를 도입해 문제를 해결했습니다.
Chanu Delta RSI가 "Bull Level"과 "Bear Level"에 도달하고 봉마감하면 롱, 숏 신호가 각각 트리거됩니다. 화면에 보이는 예시는 Bybit BTCUSDT 선물 시장을 기반으로 한 4시간 캔들스틱 전략에 최적화된 기본 설정입니다. 설정값을 조정하여 자신에게 맞게 수정하여 사용하시면 됩니다.
이 전략은 정밀한 백테스팅을 가능하게 하기 위해 참조 및 큰 진폭 BTCUSD 시장에서 모두 선택할 수 있습니다. 참조 시장에는 BYBIT:BTCUSDT를 사용하고 큰 진폭 시장에는 COINBASE:BTCUSD를 사용하는 것이 좋습니다.
(주) "Chanu Delta RSI"를 이용하여 현재 지표 값을 실시간으로 알 수 있어 전략의 시그널을 예측하는데 편리합니다.
(주) Chanu Delta RSI는 바이비트 BTCUSDT 선물시장을 기준으로 가격차이를 나타내므로 2020년 3월부터 백테스팅이 가능합니다.

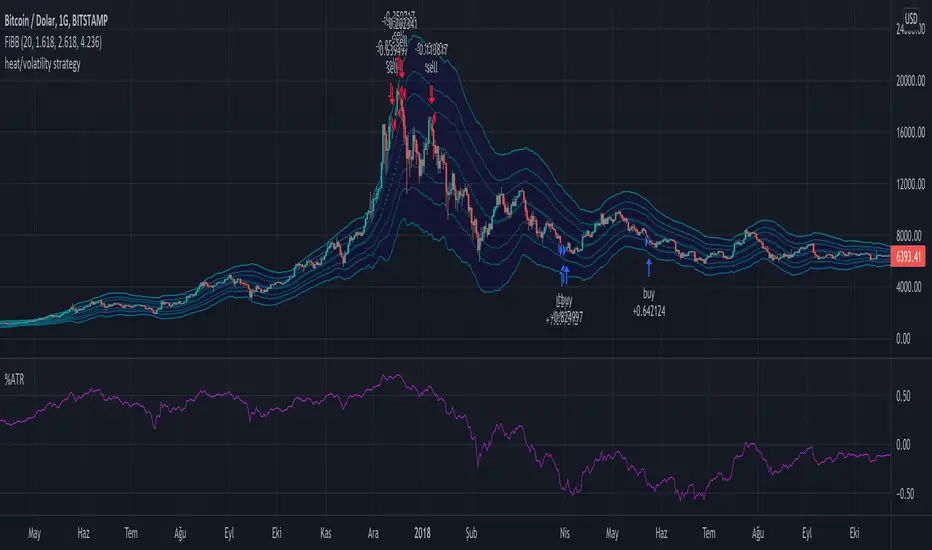
Long Term Heat/Volatility - Accumulation/Distribution v1This is a strategy specifically made for 1D BTC/USD with the aim of capturing cycle tops and bottoms. It's mainly based on two indicators: 21d average of ATR (volatility) and (BTC.price - 180d sma)/BTC.price (heat). The strategy only signals buys or sells after occurrences of high volatility, followed by extremely high or low heat values. It's optimized for utilizing accumulation and distribution at lower and higher prices respectively with respect to last 14 days. 2nd version will include dynamic dollar cost averaging during the accumulation and distribution periods.
STR:EMA Oscilator [Azzrael]Strategy based on EMA and EMA Oscilator
(EMA - close) + Std Dev + Factor = detecting oversell/overbuy
Long only!
Pyramiding - sometimes, depends on ...
There're 2 enter strategies in one script:
1 - Classic, buy on entering to OverSell zone (more profitable ~> 70%)
2 - Crazy, buy on entering to OverBuy zone (catching trend and pyramiding, more net profit)
Exit - crossing zero of (EMA - close)

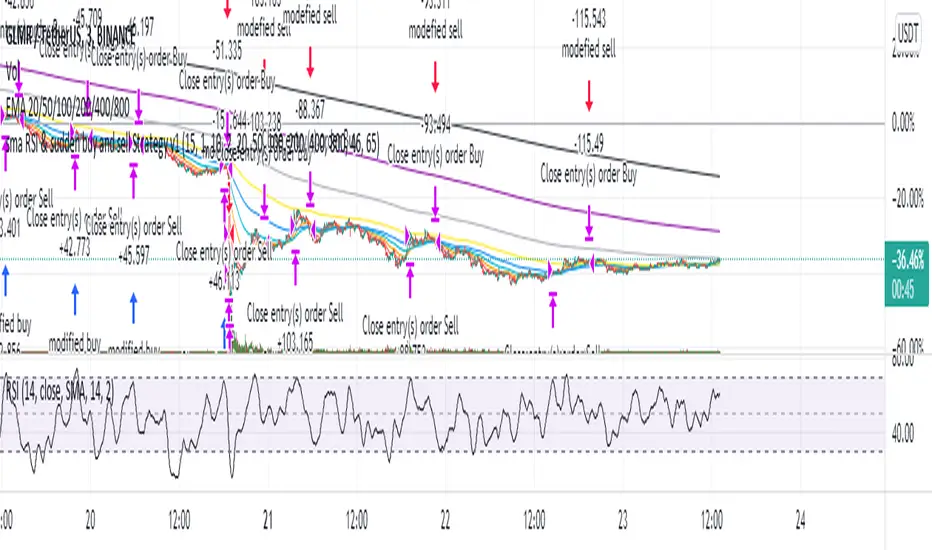
sma RSI & sudden buy and sell Strategy v1This strategy uses mostly three things:-
1. average RSI (sma rsi over a period)
2. sudden buy and sudden sell (usually to infer the change in trend or direction)
3. various EMAs ( used as a filter)
I mostly build it to work on a 3min crypto chart but it should work on any timeframe or any symbol.
Settings - Length -RSI length (hardly needed to be changed but sometimes it doubles the net profit)(+/-2)
instant length - a sudden increase or decrease in the price calculated by the length of RSI (+/-10)
Bars - No of candles to verify before starting /closing the strategy (+/-20)
Lookbackno2 - another variable to verify ema opening/closing (hardly needed to change)
emas - values of different EMAs (you can change if you want but I don't recommend it though)
over40 and over60 - the value of overbuying and overselling(+/-10)
In future, I will probably add ADX or use machine learning to filter out results
It works well considering 0.05% commission per entry and exit (total of 1% per trade)
you can message me for any query or suggestions.
BTC Cap Dominance RSI StrategyThis strategy is based on the BTC Cap Dominance RSI indicator, which is a combination of the RSI of Bitcoin Market Cap and the RSI of Bitcoin Dominance. The concept of this strategy is to get a good grasp of the bitcoin market flow by combining bitcoin dominance as well as bitcoin market cap.
BTC Cap Dominance (BCD) RSI is defined as:
BCD RSI = (BTC Cap RSI + BTC Dominance RSI) / 2
Case 1 (Bull market):
Both Cap RSI and Dominance RSI values are high
Case 2 (Neutral market):
Cap RSI is high but Dominance RSI is low
Cap RSI is low but Dominance RSI is high
Case 3 (Bear market):
Both Cap RSI and Dominance RSI values are low
When the BCD RSI value closes the candle above the Bull level, it triggers a long signal and when the value closes below the Bear level, it triggers a short signal.
(Note) Please note that TradingView's market cap symbols (CRYPTOCAP:TOTAL and CRYPTOCAP:TOTAL2) started in January 2020, so strategy backtesting is possible from this point on.
(Note) Since the real-time BCD RSI value does not come out with this strategy, it is recommended to use it together because the current value can be known and the long-short signal can be predicted in advance by using a separate BCD RSI Index together.
If "Use Combination of dominance RSI ?" is not checked in addition to the recommended default value of the strategy, the recommended values are Length (14), Bull level (74), Bear level (25).
_______________________________________________________________________
이 전략은 비트코인 시가총액의 RSI와 비트코인 도미넌스 RSI를 조합하여 만든 BTC Cap Dominance RSI 지표를 기반으로 만들어졌습니다. 이 전략의 컨셉은 비트코인 시가총액뿐만 아니라 비트코인 도미넌스를 조합함으로써 비트코인 시장 흐름을 잘 파악할 수 있도록 하는 것입니다.
BTC Cap Dominance (BCD) RSI는 다음과 같이 정의하였습니다.
BCD RSI = (BTC Cap RSI + BTC Dominance RSI) / 2
Case 1 (강세 장):
Cap RSI와 Dominance RSI 값 모두 높은 경우
Case 2 (횡보 장):
Cap RSI는 높지만 Dominance RSI는 낮은 경우
Cap RSI는 낮지만 Dominance RSI는 높은 경우
Case 3 (약세 장):
Cap RSI와 Dominance RSI 값 모두 낮은 경우
BCD RSI 값이 Bull level 위에서 캔들 마감할 경우 long 신호를 트리거하고 Bear level 아래에서 캔들 마감할 경우 short 신호를 트리거합니다.
(주의) 트레이딩뷰의 시가총액 심볼들 (CRYPTOCAP:TOTAL과 CRYPTOCAP:TOTAL2)이 2020년 1월부터 시작하였으므로 이 시점부터 전략 백테스팅이 가능한 점을 유의하십시오.
(주의) 이 전략은 실시간 BCD RSI 값이 나오지 않기 때문에 별도의 BCD RSI Index를 함께 사용하면 현재 값을 알 수 있어 롱숏 신호를 사전에 예측할 수 있으므로 함께 사용하기를 권장합니다.
전략의 추천 기본값 외에 "Use Combination of dominance RSI ?"를 체크하지 않는 경우 권장하는 값은 Length (14), Bull level (74), Bear level (25) 입니다.

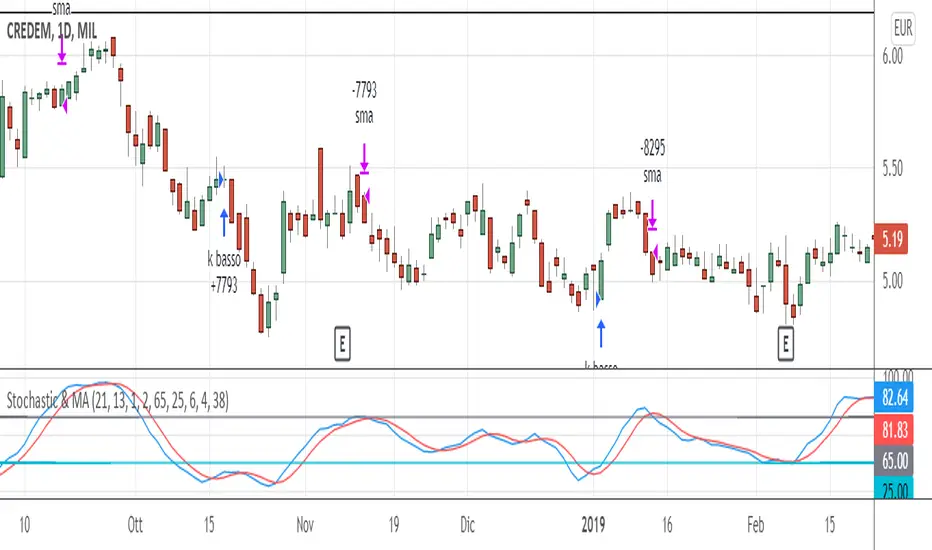
Stochastic & MAThis trading system comes from the experience of having a "fast" signal for entry at low prices (such as the stoscastic) and then "following" the stock with a "slower" indicator such as the exponential moving average. Both the input and output signals are filtered.
The use of the trading system only carries out long operations and has been tested on shares and ETFs, including indices, on daily bases (End Of Day).
ENTRY CONDITION: when stochastic's k is higher than d (on the default value of 21 periods) we enter the lower part of the oversold, to which we apply a filter or the confirmation that the closing of the day of the crossing is higher than that of the n -th previous bar (the 2nd previous bar recommended).
Other default settings are k = 6 and d = 4; the oversold level is also customizable (recommended = 25).
EXIT CONDITIONS: once the entry has "gone well", we follow the upward trend of the stock not with a stochastic oscillator - which tends to exit too soon, especially in case of strong trends - but with a simple moving average exponential (by default at 38 periods). Also in this case a filter is added, that is, k must be> to a filter threshold (recommended = 65) which is used to distinguish the decline between a "physiological" tracking. "(k drops" slowly "together with the approach of prices to the moving average) from a more" violent "tracking (prices are below the moving average and k consequently fall" suddenly ", in a few bars).
MONEY MANAGEMENT: 13% stop loss inserted (the physiological level of tracking of the shares is generally max 8-12% so we also consider a 1% margin due to trading). For more volatile stocks, the level can be extended to 20%.
LEVERAGE: the default value is equal to 1, but it is advisable, for simulations on shares, to use higher levers (x2, x3, ...) if you trade the relative CFD or on the index in case of buying and selling of Leveraged ETFs (e.g. LEVMIB which is 2x leveraged ETFs on Italian index).
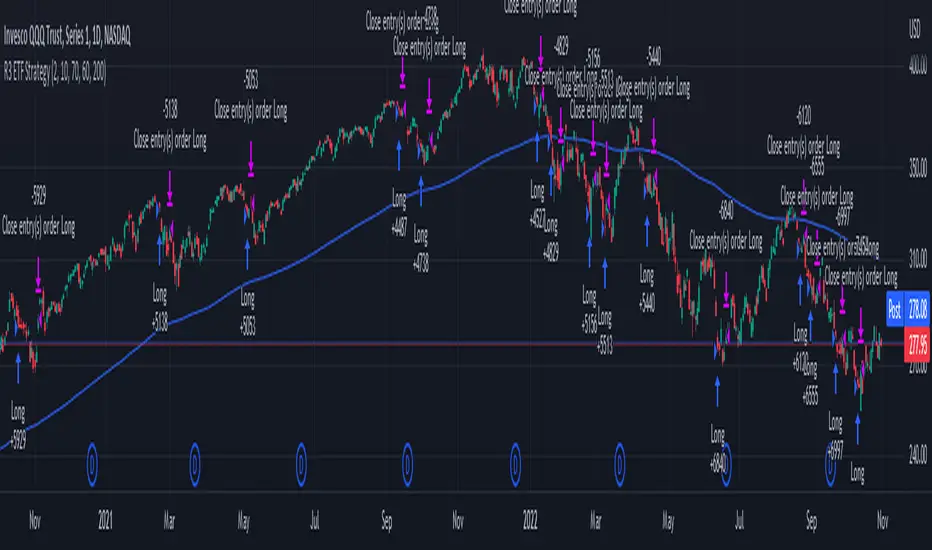
R3 ETF StrategyThis strategy is a modification of the “R3 Strategy” from the book "High Probability ETF Trading" by Larry Connors and Cesar Alvarez. This RSI strategy is for a 1-day time-frame and has these 3 simple rules:
Criteria:
The price must be above the 200 day moving average.
The 2-period (day) RSI drops 3 days in a row.
The 2-period RSI must have been below 60 3 days ago and below 10 today.
Entry and Exit:
If the 3 rules above are true, then buy on the close of the current day.
Exit on the day's close when the RSI crosses above 70.
How it works :
The Strategy will buy when the buy conditions above are true. The strategy will sell when the RSI crosses above 70. The RSI period/length, and RSI entry/exit criteria thresholds have all been coded to be adjustable with inputs.
Plots :
Blue line = 200 Day EMA (Used as Entry Criteria)
Disclaimer: Open-source scripts I publish in the community are largely meant to spark ideas that can be used as building blocks for part of a more robust trade management strategy. If you would like to implement a version of any script, I would recommend making significant additions/modifications to the strategy & risk management functions. If you don’t know how to program in Pine, then hire a Pine-coder. We can help!
Acrypto - Weighted StrategyHello traders!
I have been developing a fully customizable algo over the last year. The algorithm is based on a set of different strategies, each with its own weight (weighted strategy). The set of strategies that I currently use are 5:
MACD
Stochastic RSI
RSI
Supertrend
MA crossover
Moreover, the algo includes STOP losses criteria and a taking profit strategy. The algo must be optimized for the desired asset to achieves its full potential. The 1H and 4H dataframe give good results. The algo has been tested for several asset (same dataframe, different optimization values).
Important note:
Backtest the algorithm with different data stamps to avoid overfitting results
Best,
Alberto

3SmmaCrossUp + Fractal + RSIThis script is a combination of 3 smoothed moving averages, and RSI. When moving averages are aligned upward (downward) and RSI is above (below) 50 and a down (up) William fractal appears, it enters long (short) position. Exiting from long and short entries are defined by StopLoss and TargetProfit.

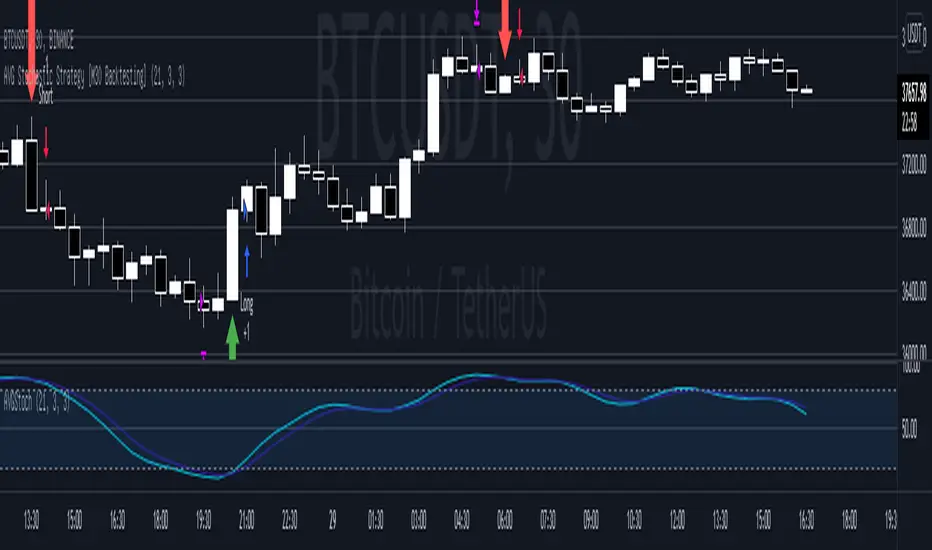
AVG Stochastic Strategy [M30 Backtesting]1. AVG Stochastic Calculate
1.1 AVG %K is calculated by apply EMA with smooth K period on Average of Original Stochastic %k & %d
+ avg_k=ema((%k+%d)/2,smoothK)
1.2 AVG %D is calculated by apply EMA with %d period on AVG %K
+ avg_d=ema(avg_k,periodD)
2. Parameter
+ %K Length: 21
+ %K Smoothing: 3
+ %D Smoothing: 3
+ Symbol: BTC/USDT
+ Timeframe: M30
+ Pyramiding: Maximum 3 orders at the same direction.
3. Signal
3.1 Buy Signal
+ Entry: AVG %K crossover AVG %D and AVG %D < 20
+ Exit: AVG %D > 80
3.2 Sell Signal
+ Entry: AVG %K crossunder AVG %D and AVG %D > 80
+ Exit: AVG %D < 20
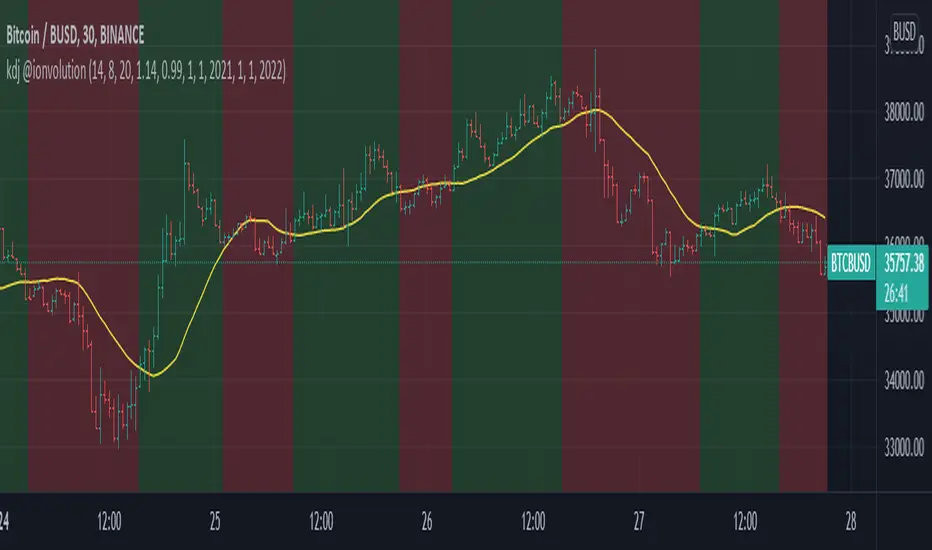
KDJ Strategy @ionvolutionBuys if there is crossover in J and D and the crossover is above an SMA defined as an input parameter
Sells if the close is below the SMA or there is a crossunder in J and D
The KDJ calculation is done using ll21LAMBOS21 script. I added start date, end date, stop loss margin and stop profit margin to ease the simulation on diferent conditions of the market.
Tested on BTCBUSD pair. Gives good results in 30m candles with K period = 7 and D period = 3, but also works fine with K period = 14 and D period = 8. It works fine when market is bullish and gives false signals in flat markets. I just developed long strategy, as it is developed to operate in SPOT trading.
TEMA/HMA/VWMACD - Short Strategy 4HAs we can discover by studying the history of BTCUSD, the fall is always swift. Confirmation of this - today's collapse. In this strategy, an attempt is made to catch such drop by using quick entry and quick exit.
Let's describe what this strategy consists of:
• TEMA (you can find this strategy separately on this page or on platform)
• VWMACD
• HMA
• Take-profit and Stop-losses
Logic:
Firstly we VWMACD (the difference between VWMACD and simple MACD is only in the way of calculating moving average) and plot it as a histogram.
Then HMA is adding as a trend filter. For easy understanding let's plot it now on chart separately.
Next step is to create and add TEMA. After it is needed to subtract slow TEMA from fast TEMA and plot this value around 0 on histogram. This is the main decision for the implementation of the short trade.
ENTRY the trade:
When VMACD is below 0 and price (src = close) is below the HMA and TEMA below 0.
CLOSE the trade:
When VWMACD is upper than 0 or price is upper than HMA or TEMA is upper than 0
You can find more strategies on tradingammo.pro.

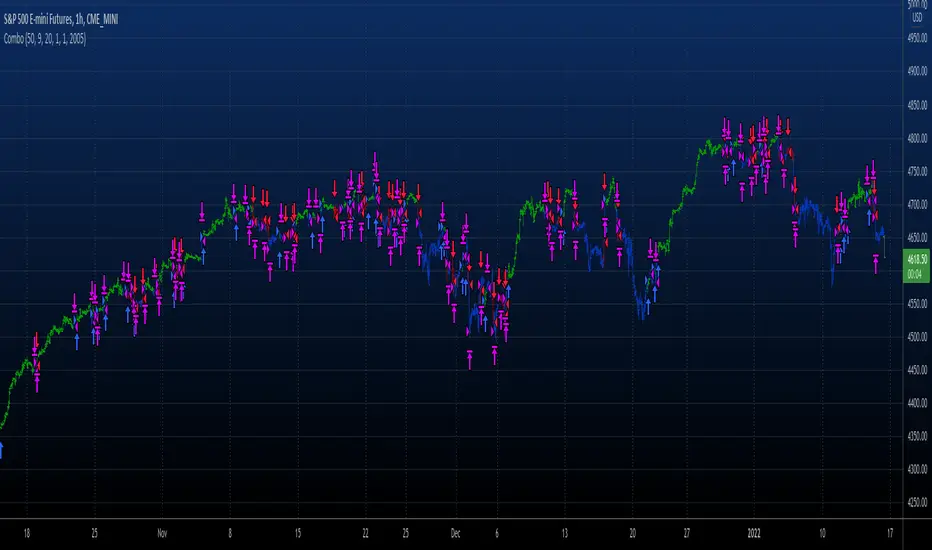
Combo 2/20 EMA & Accelerator Oscillator (AC) This is combo strategies for get a cumulative signal.
First strategy
This indicator plots 2/20 exponential moving average. For the Mov
Avg X 2/20 Indicator, the EMA bar will be painted when the Alert criteria is met.
Second strategy
The Accelerator Oscillator has been developed by Bill Williams
as the development of the Awesome Oscillator. It represents the
difference between the Awesome Oscillator and the 5-period moving
average, and as such it shows the speed of change of the Awesome
Oscillator, which can be useful to find trend reversals before the
Awesome Oscillator does.
WARNING:
- For purpose educate only
- This script to change bars colors.

RSI StrategyThis RSI strategy will allow you to go long when RSI is overbought and go short when RSI is oversold. You can also change the checked boxes to reverse this. Uncheck "Overbought Go Long & Oversold Go Short" and check "Overbought Go Short & Oversold Go Long" to use this reversed option.
You can also choose to use an ema filter as an additional qualifier for entry. Uncheck "No EMA Filter" and check "Use EMA Filter" if you want to use it.
Be sure to enter slippage and commission into the properties to give you realistic results.
I've also built in backtesting date ranges and the ability to trade only within certain times of day and have it close all trades at the end of that time frame. This is especially useful for day trading stocks. To specify a time from use the format 0930-1100 or whatever your trading hours will be. Check off "Enable Close Trade At End Of Time Frame" to close the trade at the end of your trading hours.
You can also specify a % based take profit and stop loss. Also keep in mind that the way this code is designed if you use the stop loss and/or take profit and it reaches either target and closes, then it will immediately re-enter if the condition for long or short entry is true.
Finally there's custom alert fields so you can send custom alert messages for strategy entry and exit for use with automated trading services. Simply enter your messages in the fields within the strategy properties and then put {{strategy.order.alert_message}} in your alert message body and it will dynamically pull in the appropriate message.

Combo 2/20 EMA & Absolute Price Oscillator (APO) This is combo strategies for get a cumulative signal.
First strategy
This indicator plots 2/20 exponential moving average. For the Mov
Avg X 2/20 Indicator, the EMA bar will be painted when the Alert criteria is met.
Second strategy
The Absolute Price Oscillator displays the difference between two exponential
moving averages of a security's price and is expressed as an absolute value.
How this indicator works
APO crossing above zero is considered bullish, while crossing below zero is bearish.
A positive indicator value indicates an upward movement, while negative readings
signal a downward trend.
Divergences form when a new high or low in price is not confirmed by the Absolute Price
Oscillator (APO). A bullish divergence forms when price make a lower low, but the APO
forms a higher low. This indicates less downward momentum that could foreshadow a bullish
reversal. A bearish divergence forms when price makes a higher high, but the APO forms a
lower high. This shows less upward momentum that could foreshadow a bearish reversal.
WARNING:
- For purpose educate only
- This script to change bars colors.
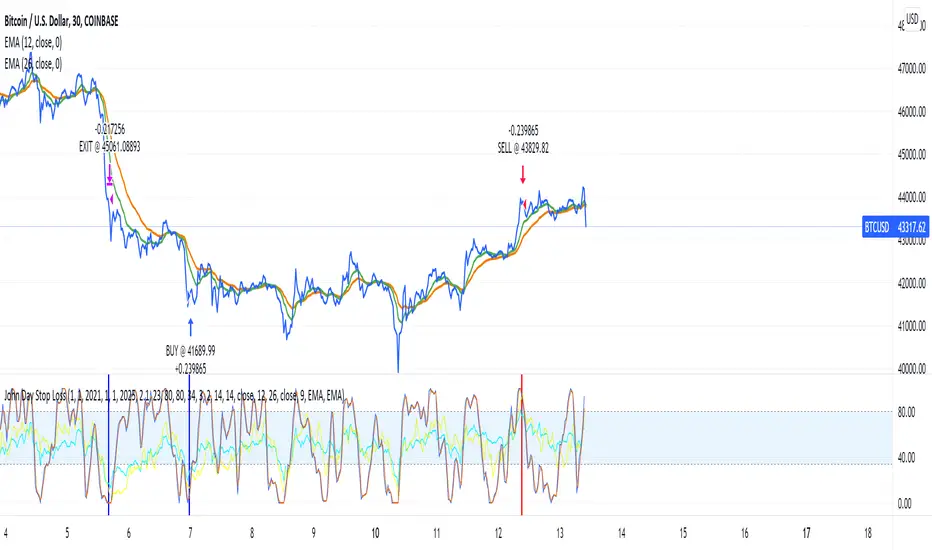
BTC 30m ScriptWhat are your thoughts on this script? I connected it to Coinbase Pro via AWS lambda for auto-trading. I'm waiting for BTC to start bullish again before turning it on in production. Thoughts? Thank you! John
MA Bollinger Bands + RSI This script uses the standard deviation of a given moving average along with an RSI direction.
When: rsi crossover neutral line + price crossover lower deviation boundary => long
When: rsi crossunder neutral line + price crossunder upper deviation boundary => short

Divergence for Many Indicators v4 STHello Traders.
This is the Strategy version of Divergence for Many Indicators v4, an easy and comfortable indicator.
- - - -
*It's been modified a little bit from the original.
*I got permission from the original author.
*I'm not good at English, I'm sorry.
- - - -
< 4 things to check >
1. Since repainting is not performed, the first imprinted signal can be accurately seen.
2. It does not respond to continuous diversions.
3. If the opposite diversity is not imprinted, caution is required as it is designed not to indicate liquidation. Be careful when reading the figures shown in the strategy tester.
4. Added stop loss and take propirane.
< What changed? >
1. pivot period 5 - > 9
2. Money Flow index and Chaikin Money Flow are released.
- - - -
KOR SUB
< 4가지 확인 사항 >
1. 리페인팅이 없으므로 첫 번째로 각인된 신호를 정확히 볼 수 있습니다.
2. 연속된 다이버젼스에 대해서는 반응하지 않습니다.
3. 반대의 다이버젼스가 각인되지 않으면 청산 표시를 하지 않도록 설계되어 있으므로 주의를 요합니다.
4. 스탑 로스와 테이크 프로핏 항목을 추가하였습니다.
< 무엇이 변경되었나? >
1. 피봇 페리어드 값이 조금 수정되었습니다.
2. MFI & CMF 가 체크 해제된 상태입니다.
THANK YOU ^^
