מתנדים

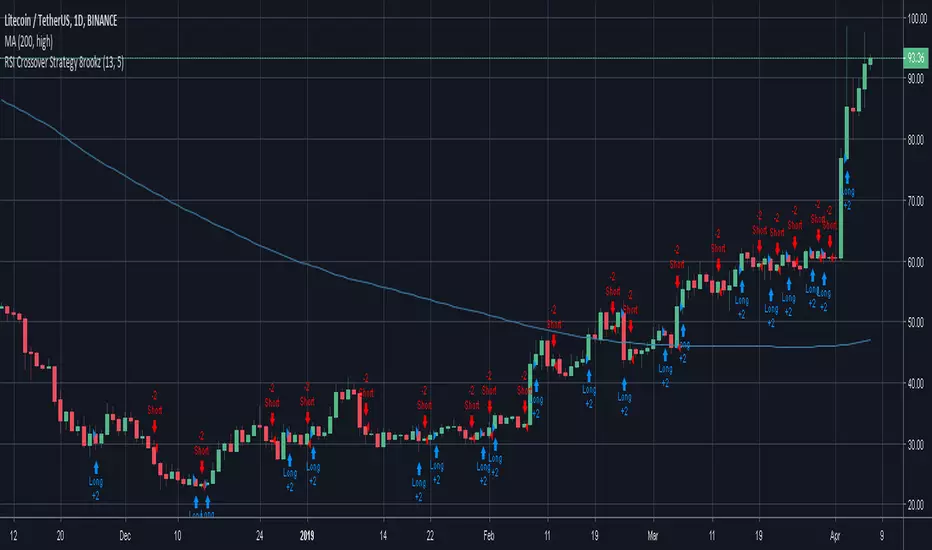
RSI Crossover Strategy 8rookzRSI Crossover Strategy
used to create entry points for increasing relative strength
Noro's DD StrategyIf a drawdown is more than 5% - to open long position
If a candle is green - to close a long position

Stochastic Strategy of BiznesFilosofThis strategy allows you to test the stochastic indicator, as well as adjust it to a specific trading pair. The parameters indicated in the books are too approximate and have nothing to do with modern reality. The optimal parameters for Bitcoin are now set. You can customize better for yourself. This strategy allows you to make settings.
===
Эта стратегия позволяет протестировать индикатор стохастик, а также настроить его на конкретную торговую пару. Параметры, указанные в книжках слишком приблизительные и не имеют ничего общего с современной реальностью. Сейчас установлены оптимальные параметры для биткоина. Вы же можете настроить лучше под себя. Это стратегия позволяет сделать в настройках.

Custom 15m stratThis strategy is using multiple powerful indicators to generate low-timeframe signals. The script is best used on the 15 min timeframe but with correct parameters it can be rather sucesfull on higher timeframes too.


Commodity Selection Index Backtest The Commodity Selection Index ("CSI") is a momentum indicator. It was
developed by Welles Wilder and is presented in his book New Concepts in
Technical Trading Systems. The name of the index reflects its primary purpose.
That is, to help select commodities suitable for short-term trading.
A high CSI rating indicates that the commodity has strong trending and volatility
characteristics. The trending characteristics are brought out by the Directional
Movement factor in the calculation--the volatility characteristic by the Average
True Range factor.
Wilder's approach is to trade commodities with high CSI values (relative to other
commodities). Because these commodities are highly volatile, they have the potential
to make the "most money in the shortest period of time." High CSI values imply
trending characteristics which make it easier to trade the security.
The Commodity Selection Index is designed for short-term traders who can handle
the risks associated with highly volatile markets.
WARNING:
- For purpose educate only
- This script to change bars colors.

Flow Trend Indicator StrategyImplemented the trend indication part of the CHOP_LRSI indicator as a strategy.

Tangram Bot 2 - SmartbotPrimeira Versão do Script Tangram Bot 2 da Smartbot para tradingview.
A intenção é agilizar e fazer um teste prévio e rápido do setup.
O resultado indicado aqui jamais corresponderá a um resultado real. É apenas uma ferramenta de estudo.
Ainda falta fazer e melhorar a parte de gestão de risco.
Caso queria fazer alguma sugestão ao cógido para melhorar a gestão de risco ou caso tenha encontrado algum erro, favor comunicar.
O tangram bot 2 combina o uso de até dez Indicadores de Análise Técnica com Gerenciamento de Risco (stop gain, stop loss, stop móvel, realização parcial, bloqueio de reversões, lucro máximo por dia e prejuízo máximo por dia) e Filtros Diversos (sentido das operações, uso do after-market, bloqueio de nova entrada após saída, hora inicial e hora final para negociação). São utilizados os indicadores Médias Móveis, HiLo Activator, MACD, ADX, Estocástico, VWAP, IFR, Bandas de Bollinger, Stop ATR e SAR Parabólico

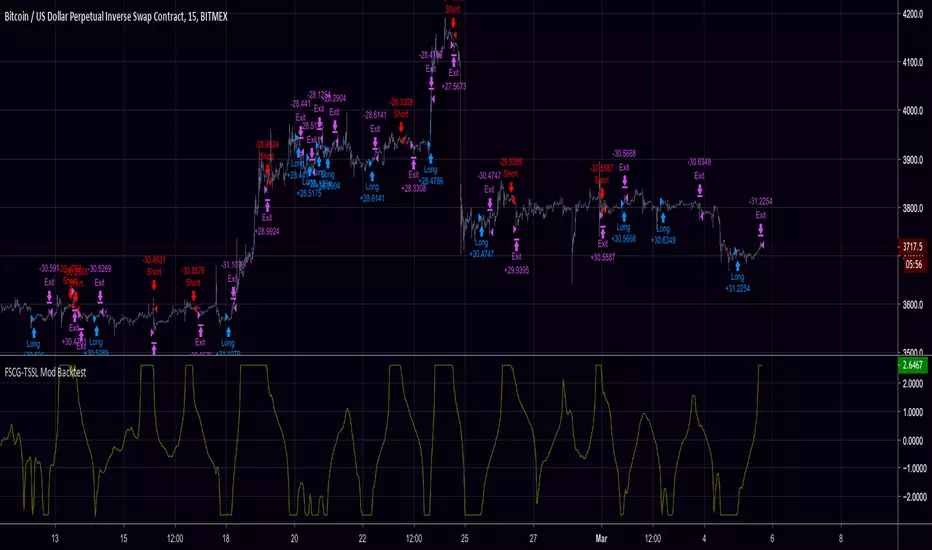
FSCG-TSSLA modification of dasanc's "Fisher Stochastic Center of Gravity"
Added:
- Thresholds for Buy/Sell Signals
- Trailing Stop / Stop Loss
- Backtest Range
Support the open-source community.
Screw you people selling open-source scripts to newbies.
Tip Jar: 3KNZq8mE24MuBmpDJVF31bBy8zc9beDiZo
Contact me for collaborations and let's take things to the next level!
Do NOT contact me for alert scripts or paid-custom work, I don't work for clients.
Simple Stock StrategyThis is a simple and easy to use strategy for low-volatility stocks. It prints a BUY or SELL signal to alert you that certain conditions have been met. I use it as a time saver to help identify which charts I need to look at. You can adjust the inputs and properties to suit your needs. I would suggest allowing two or three orders.
BUY Signals
MACD Above 0
SMA Cross
Big Green Candles
SELL Signals
Profit Target %
Stop Loss %

Fisher Transform Multi-Timeframe Backtest (No Trailing)This is the Backtester without Trailing Stops
Credits to mortdiggiddy

Fisher Transform Multi-Timeframe (Backtest)This is the Backtest Strategy for mortdiggiddy's "Fisher Transform Multi-Timeframe"
For more details check his study:

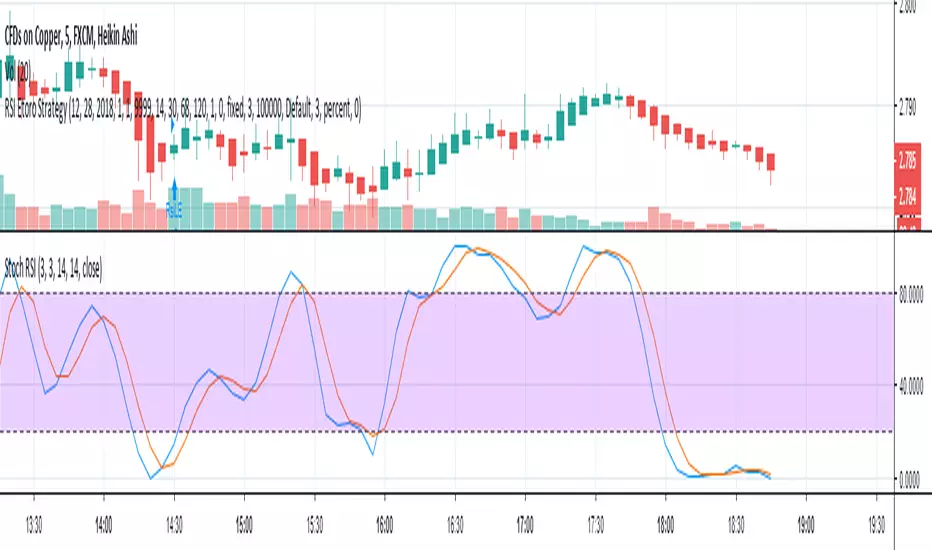
RSI Etoro StrategyTmp (WIP) just for my bro Manu ;)
BTW "Used" on COPPER
Not Good because only one indicator: miss several phenomenon so go to SL stupidly... And fine tuning of parameters is too sensible: it should be adjusted following feedback from other indicators...
Good thing is it takes into account the etoro context (SL at 50%, spread of 3 ticks) and you can back test with any period you want (usefull because parameters depends on "moods")

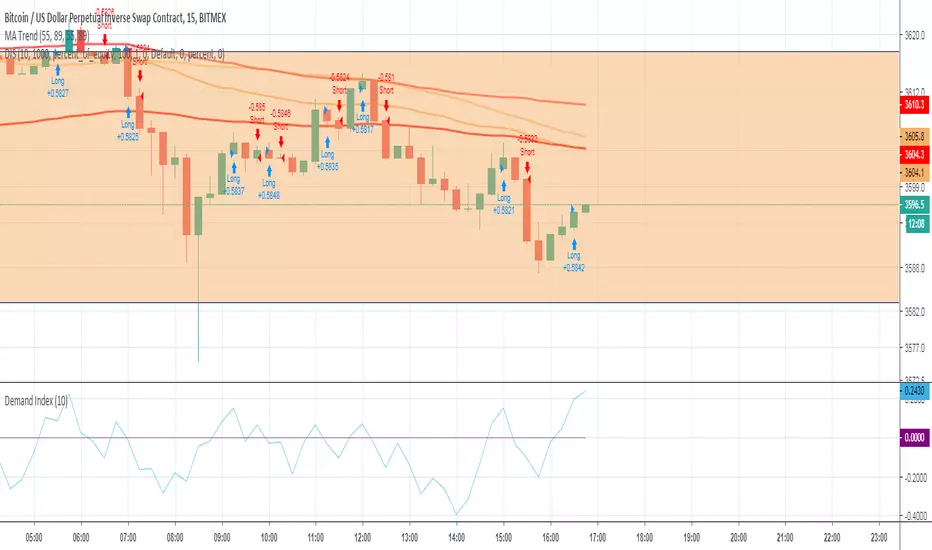
Demand Index StrategyDemand Index Strategy
Goes Long if Indicator is > 1
Goes Short if Indicator is < 1
I have no clue how and when to use it.
Please message me if you found something.

SARSI Reversal StrategySimple reversal strategy based on 'Parabolic Stop and Reverse' and 'Relative Stength Index' indicators.

Powerfull strategy MACD+RSI+STOCH ATR stop best on Crude OilMy strategy uses a combination of three indicators MACD Stochastic RSI .
The Idea is to buy when ( MACD > Signal and RSI > 50 and Stochastic > 50) occures at the same time the BUY STop we place on previous day HIGH
and sell (short) when the opposite condition occurs we place SELL STOP on previous day LOW
We exit on Take profit or Stop loss which is calculated by ATR (10) or on the opposite signal "Volatility breakout"
This strategy works well on stocks, commodities and cryptos especially during market breaking up after consolidation
The best results are on Daily charts , so its NOT a scalping strategy. But it can work also on 1H charts.
The strategy does not have any stops and profit targets, so we can take all the market can give us at the moment.
The exit point only when MACD goes under Signal
Its Preformance is significantly better with "buy stop on High.1 and sell stop on Low.1" idea and exit on "volatility price breakout"
So, use it, trade it.
If it will help you to imprive your trading results, please donate me
BTC: 12kd1F8buWisUBdq27BBwRkUvzW7Ey3og

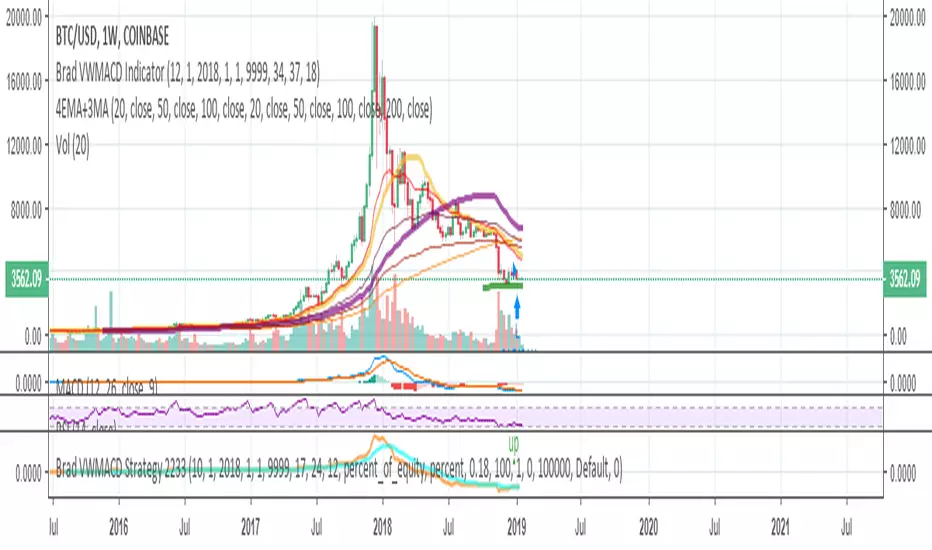
Brad VWMACD Strategy 2233Volume Weighted MACD. DO NOT USE AS STANDALONE. THEY ARE GUNNING FOR yOUR MONeY. Or if you use standalone, use only small fraction of your funds. NOT FINANCIAL ADVICE, PAST RESULTS OFTEN ARE COUNTER TO FUTURE RESULTS. What worked in the past is usually what will NOT work in future.
I tried not to overtune this and it works great some months, terrible other months. EDUCATIONAL PURPOSES ONLY!!!!!!!!!!
Current settings are for 4-hour charts, BTCUSD Coinbase.
Powerfull strategy MACD + RSI + Stoch buy on High exit on ATRMy strategy uses a combination of three indicators MACD Stochastic RSI .
The Idea is to buy when ( MACD > Signal and RSI > 50 and Stochastic > 50) occures at the same time the BUY STop we place on previous day HIGH
We exit on Take profit or Stop loss which is calculated by ATR (10) or on the opposite signal "Volatility breakout"
This strategy works well on stocks, commodities and cryptos especially during market breaking up after consolidation
The best results are on Daily charts , so its NOT a scalping strategy. But it can work also on 1H charts.
The strategy does not have any stops and profit targets, so we can take all the market can give us at the moment.
The exit point only when MACD goes under Signal
Its Preformance is significantly better with "buy stop on High.1" idea and exit on "volatility price breakout"
So, use it, trade it.
If it will help you to imprive your trading results, please donate me
BTC: 12kd1F8buWisUBdq27BBwRkUvzW7Ey3og5
