QuantNomad - Significant Pivot Reversal Strategy AlertsAlerts for "Significant Pivot Reversal Strategy":
As one of the ways to filter out insignificant levels I decided to check that pivot point is not above/below neighbors, but check that it's above/below at least by a certain amount.
I use ATR, so in params, you can set length of ATR and also ATR multiplier. The new level will be calculated only if PP will be above/below neighbors by atr * atr_mult.
It seems this approach might help in some cases.
Pivot

Murreys Math Lines Box OR Ratio PivotsI'm publishing my second script, though nothing extraordinary, I believe there is user group for Murry Math indies and the only "proper one" (According to my usage) I found was of RicardoSantos, here is the link :
He developed that script in 2014 and it is in need of update to Pine V4 and I'm doing the needful as its user.
All the updates from my end are listed below:
1. Updated to Pine V4
2. Automatic octave selection
3. In auto mode one can switch octave
4. This script is color coded with intention of use on dark theme, one can change the colors to use it on white background with simple few clicks as pinelines have been used
Other thing I want to add is that usage of this is not very clear to many users, so I'll do little explaining here;
Lets start with what is Octave? Octave is basically distance between square of two whole numbers, this is hard-fast method to calculate, Murry has made it far more complicated to use practically. In mathematical formula terms it could be something like this for script trading at 11890 (CMP)
Step 1: Square Root of CMP i.e Square Root of 11890 = 109.041 = Rounded to 109
Step 2: You can either take one whole number higher or lower than 109, which is 108 or 110. We will take 108
Step 3: Square of 108 = 11664 and Square of 109 = 11881
Step 4: Octave => Distance between (Lowlevel) 11664 and (Higherlevel) 11881
I've automated it so you don't need to calculate, but there is also manual entry possible if you want to calculate octaves yourself, there are different ways to calculate and some like to just take High and Low's of the day or week or month, whatever you like. When I used it I did it strictly this way, so automation is based on it. This is very subjective matter so don't ask to change the calculation of this, if I started doing that every second person would ask me to modify it to different calculation..and thats...just not possible to do.
This is output for calculation we just did above
This is octave shift option (Which basically shifts to next whole number square in above calculation)
Normal nomenclature on octaves and important color codes
+2/8: Extreme overbought = Blue Color and solid line
+1/8: OverBought
8/8: Hardest line to rise above (overbought) = White Color and solid line
7/8: Fast reverse line (weak)
6/8: Pivot reverse line = Yellow Color and solid line
5/8: Upper trading range
----------------------------------------
4/8: Major reversal line = Green Color and solid line
----------------------------------------
3/8: Lower trading range
2/8: Pivot reverse line = Blue Color and solid line
1/8: Fast reverse line (weak)
0/8: Hardest line to fall below (oversold) = White Color and solid line
-1/8: Oversold
-2/8: Extreme Oversold = Yellow Color and solid line
Other lines that I've not mentioned color codes for are minor and are usually plotted in dotted format.
Resources on complete technique to trade and importance of levels (highly recommended to read carefully before trading), if you don't know how to get this for free don't worry you can just google Murrey math and you will find it somewhere, its just that it would be in little scattered manner.
www.scribd.com
Enjoy!

RSI PivotIt is based on RSI. When RSI crosses (70)up and (30)down bands, it draws a price line.
Cheers :)

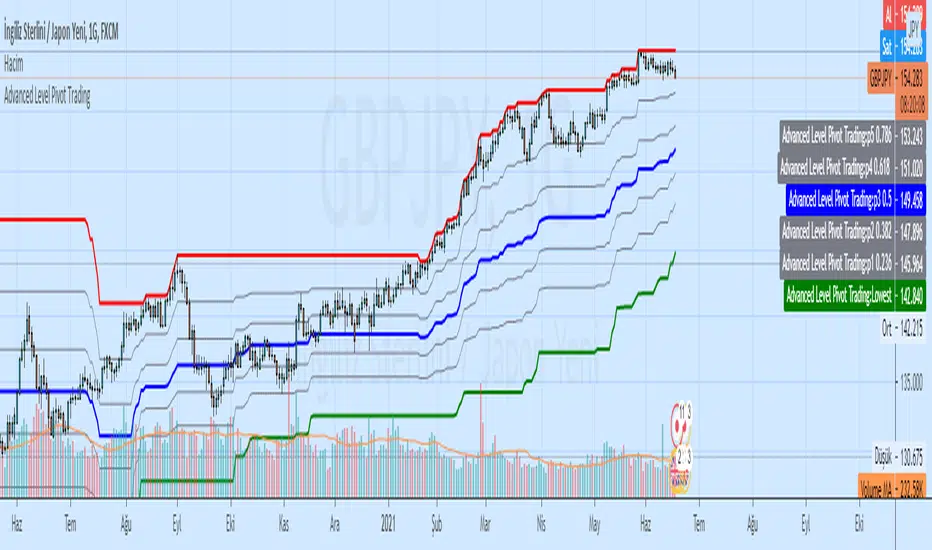
Advanced Level Pivot TradingAdvanced Level Pivot Trading
Highest Lowest Channel and Level Pivot (Fibonacci)
3rd High Low This is simple script to mark when higher high (or lower low) is made on continuously third day.
There likelihood of short term reversal next day. As usual, it is just likelihood and not certainty.

Pivot Point Reversal + RSI AlertsThese are alerts for previously published strategy:
This strategy joins the Pivot Reversal strategy with the RSI indicator.
We check RSI level at the pivot point level and only if RSI condition is satisfied we update levels for stop orders.

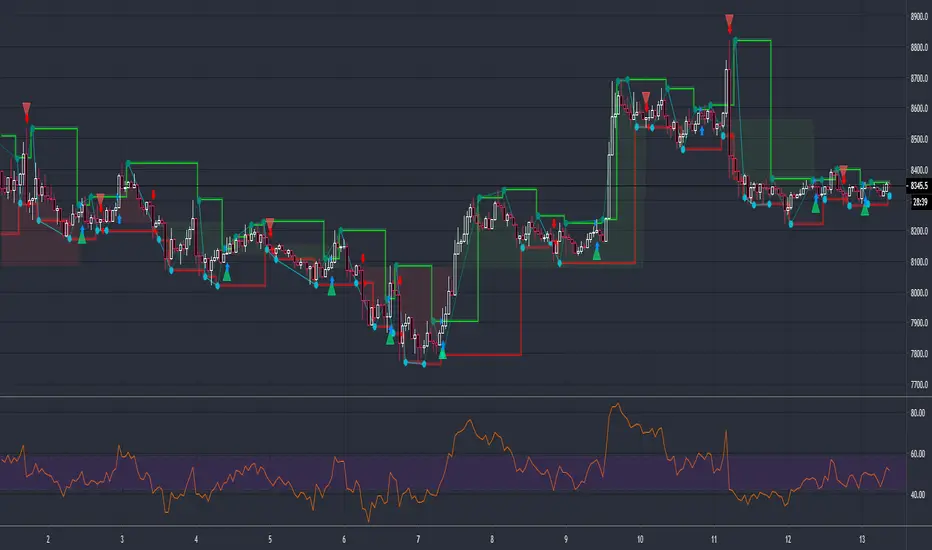
Pivot Reversal Strategy + RSIPivot Reversal Strategy + RSI
A modified version of the standard PRS with an RSI overbought/oversold filter
Comment/uncomment "Study/Strategy" to easily switch to strategy() mode
As long as it is used in the study() version, the indicator is compatible with the Risk Management Wrapper
Separate Alerts for Buy & Sell signals
Single Alert for both Buy & Sell signals - it can also be used by another indicator as a source
Camerilla PivotsBefore starting special thanks to @QuantNomad for his script "Ultimate Pivot Point Alerts"
Link : -
Please follow and support him for his work.
In this script I'm modifying how time frame factor is imported into the script and removing other types of Pivots and cleaning it further for only CAMs, I've also added the formulas for 5 and 6 numbers, it will help in trading breakout strategies.
Note that this way of importing Time frame produces minor difference in readings/levels from how it is done in QuantNomads script, so before taking your pics you should calculate your levels on separate sheet and compare which ones are working for you and your strategy.
I've been using this CAM setup for almost a year now, so I coded it as per my needs, it is up to users to utilize it to theirs.
Further utility:
1. You can hide/unhide S/R levels 5/6
2. This is MultiTimeframe version, meaning you can change Time-frame of Pivots being displayed on any TF chart.
3. Lines are produced for only level 3 and 4. And you can choose to hide them. Only Pivot line is kept and can not be hidden.
4. You can also choose to hide/unhide level value and only see label if you want.
5. No historical levels are kept to avoid clutter.
I've not included alerts as I don't use them, but if anyone wants it I suggest referring to @QuantNomad script bank. He has published number of excellent scripts in this regard.
There is no restrictions on this script, it can be used and reproduced freely. Its my way of doing little something for community and my first script.
Enjoy.

Extended Fibonacci PivotEditable Fibonacci Pivots. 0.236, 0.382, 0.618, 0.786, 1.000. Easy to extend further if needed. Can be used with intervals from 1 minute to 1 Day.
A Few Recommended timeframes:
1 minute chart - 15 Minute Pivot Timeframe
3 minute chart - 1 Hour Timeframe or Daily Timeframe
15 Minutes to < 60 Minutes - Daily Timeframe
1 Hour to 4 Hour - Weekly Timeframe
Daily - Monthly Timeframe

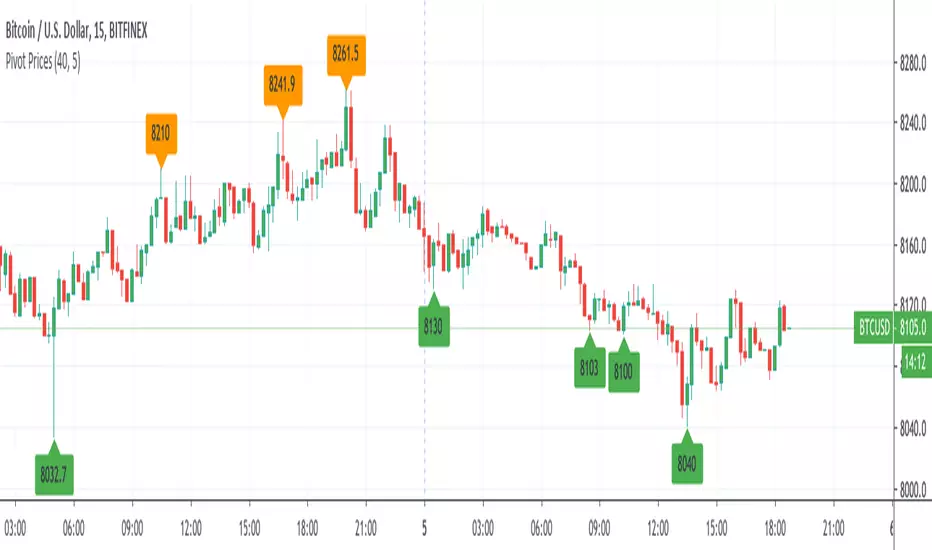
Pivot Prices - ExampleA simple example script showing how to use label.new() to plot pivot prices on the chart.
A full tutorial and commentary is available on the backtest-rookies website.
Function : Pivots High and Low WARNING: The toil of this script is not mine . In order to avoid disrespect for work, I deleted some extensions only pure pivots , that is, only the information this script needed. I liked the fact that high and low pivots were in one function. I found this command by chance on stackoverflow. I don't know the authors and the nicknames because they are the stackoverflow nicknames. I hope it will help your adaptive periods. Finally, the length of the pivot must be at least 3 to be available.If the author reaches me, I will give his/her Tradingview name as a reference.


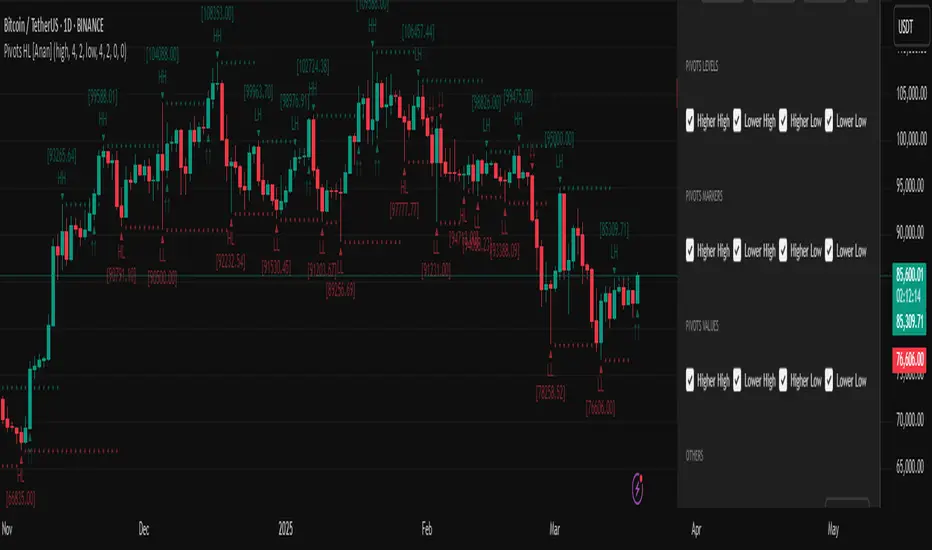
Pivot Points High Low (HH/HL/LH/LL) [Anan]Hello Friends,
This is my own version of ( Pivot Hilo Support n Resistance Levels R3-3 by JustUncleL )
- V4 Pinescript
- Removed MA dependency filters
- Add some arrows
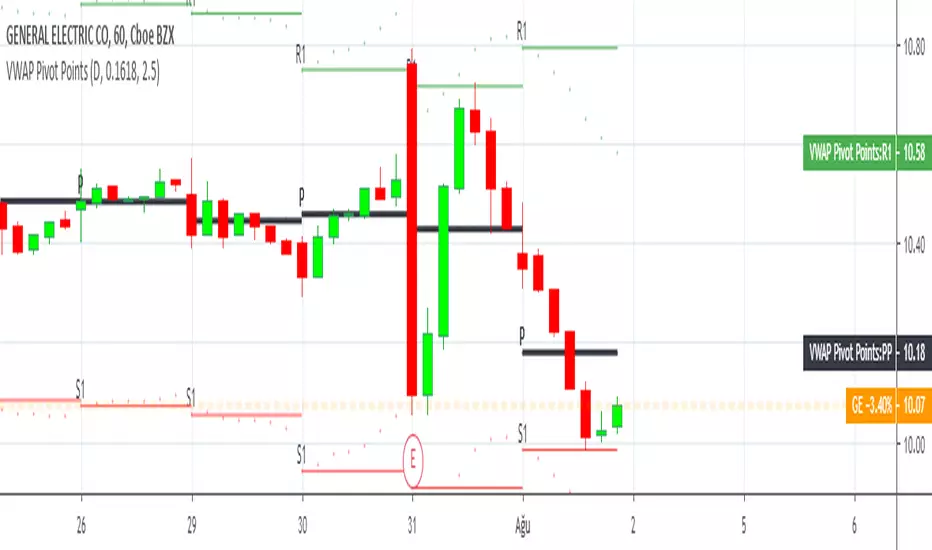
QuantNomad - Ultimate Pivot Points AlertsCreated a universal script for pivot points alerts.
In the script, you can choose one of 4 pivot point types: Traditional, Fibonacci, Woodie, and Camarilla.
You are able to create separate alerts for every level or create one for price crossing any level.
For separate levels, you can choose: "Cross", "Crossover" and "Crossunder".
You can also choose to show/hide:
Historical Levels
Levels Values
Current Levels - Levels calculated on the current period, on close of the period they will become valid levels for next periods. These levels do not participate in alerts calculations.
Because of some TradingView limitations, alerts won't be fired for the first bar of the session.
In the script used new v4 plotting features, so will be able to plot levels and labels nicely. Unfortunately, there is a limit on the number of consecutive lines you can plot on the plot (around 50), so historical lines in the past will disappear after 6-7 periods.
And remember:
Past performance does not guarantee future results.

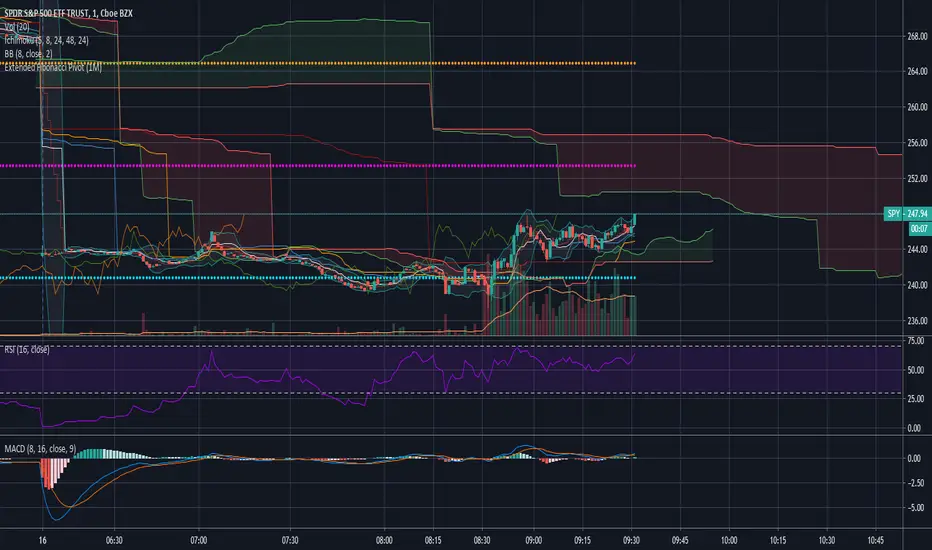
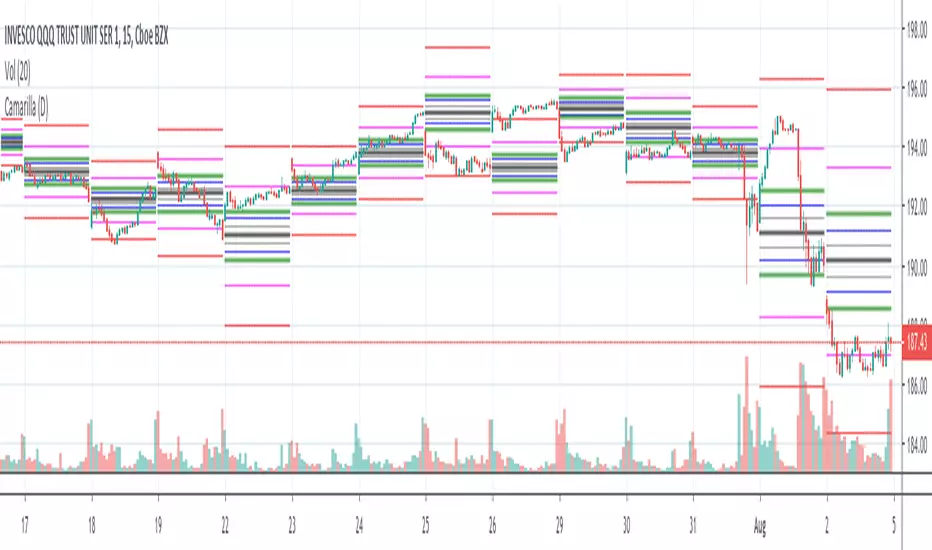
Camarilla Pivots (D,W,M) Secrets of a Pivot BossPrimarily for equities as no provision has been made to control the timing at which the open close high low are determined, indeed, I see no straightforward mechanism to do so in Pinescript.
Development aided by: but with the entirely different calculations presented in "Secrets of a Pivot Boss" by Franklin Ochoa. And far cleaner and less-redundant code.
To trade the indicator, watch the H3,H4,H5 and L3,L4,L5 bars. There are two built-in strategies. Depending on pivot width, sell at H3 and buy at L3 with stop at H4/L4 or above. For strongly trending environments: buy at H4, cover at H5--similarly for downtrends.
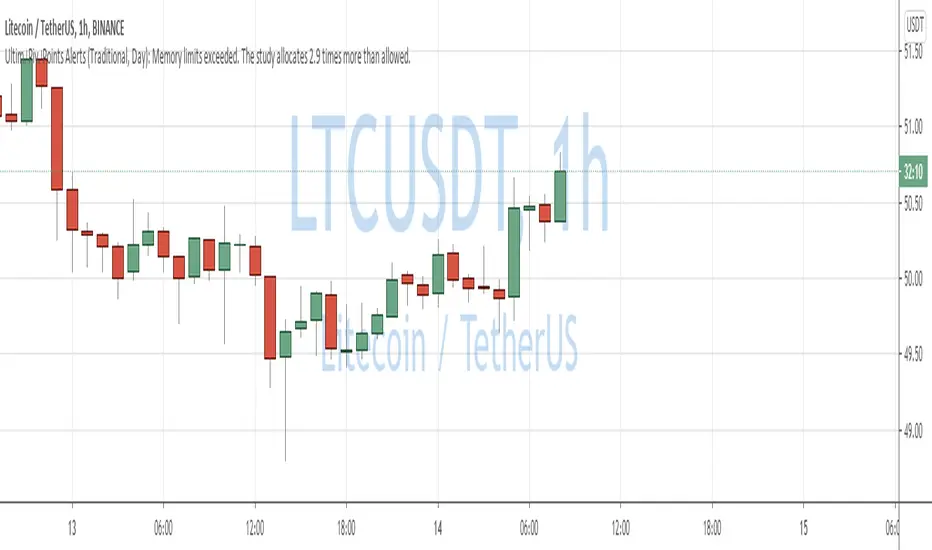
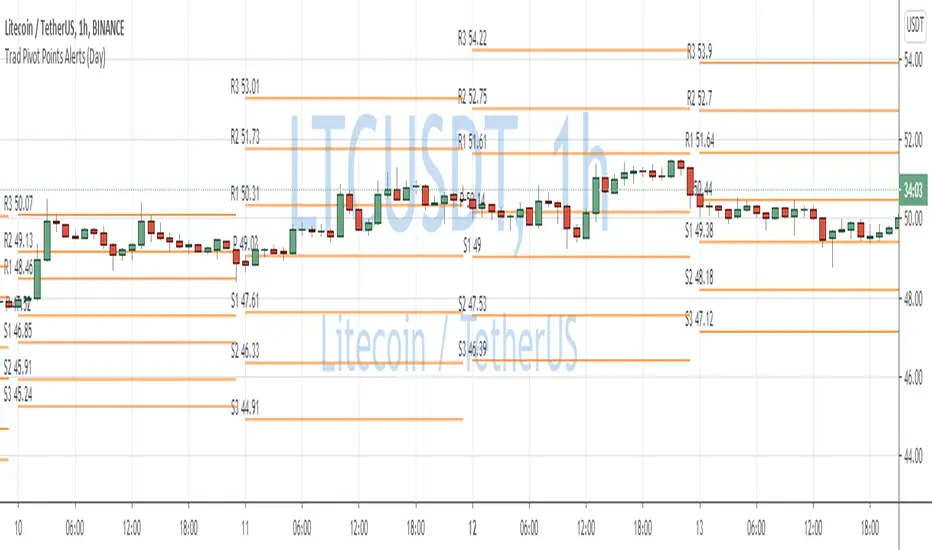
Traditional Pivot Points AlertsCreated a script for alerts on Traditional Pivot Points.
You will be able to create separate alerts for every level or create one for price crossing any level.
Because of some TradingView limitations, alerts won't be fired for the first bar of the session. Will try to solve that in the new versions.
In the script used new v4 plotting features, so will be able to plot levels and labels nicely. Unfortunately, there is a limit on the number of consecutive lines you can plot on the plot (around 50), so lines in the past will disappear.
You can enable/disable in params displaying level itself on the chart.
And remember:
Past performance does not guarantee future results.

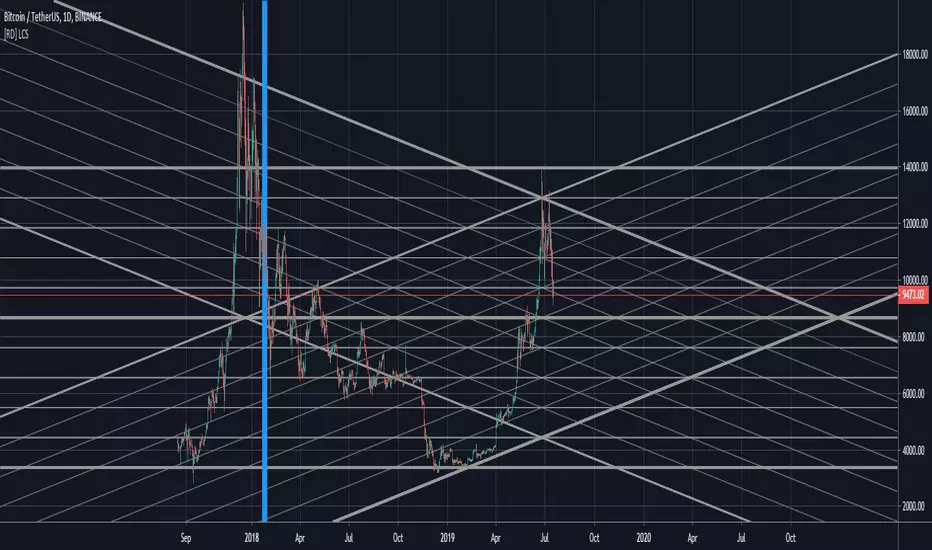
[RD] LCS - line channels (basic) v3 - [republish]==================================================================
July 18 2019 - LCS - line channels (basic) by RootDuk
Version : v3 - read the notes
==================================================================
Easy script to draw channels based on ie. GANN using the following
input params
- ibback : barsback to search for high and low
- ffactor : factor to up/downscale the lines
- oextend : extend lines, left, right, both, none
- bshowline : show horizontal lines yes/no
- bsshowdown : show diag down lines yes/no
- bsshowup : show diag up lines yes/no
- bshowindm : show index marker, where is you current ibback
===================================================================
Notes
===================================================================
When you use this code, pls let me know where and how you used it
as iam always curious what some can do with it. Thanks!
===================================================================
Updates
===================================================================
v1
v2 - July 17 2019
- Removed support wallets from source code. I think the source
- has been deleted because of this, find no other clue.
v3 - July 18 2019
- Republish
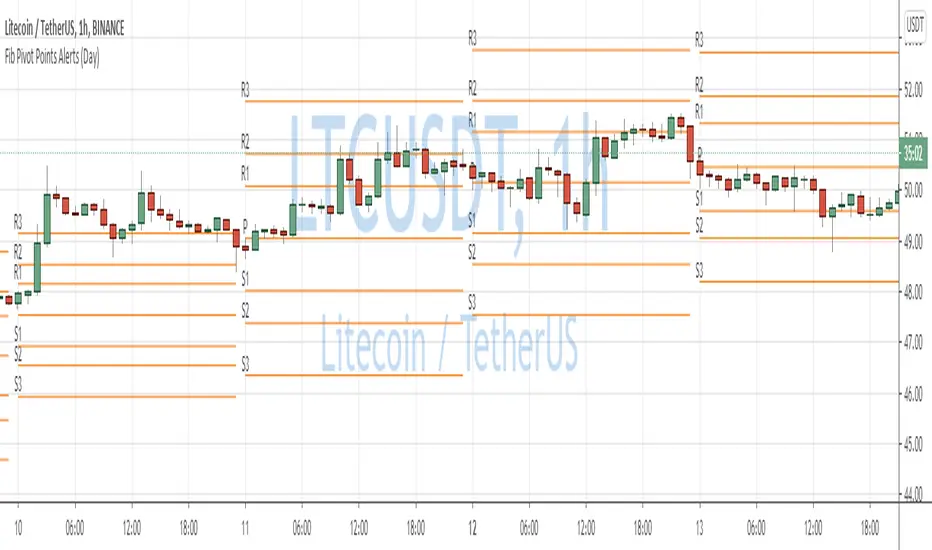
Fibonacci Pivot Points AlertsCreated a script for alerts on Fibonacci Pivot Points.
You will be able to create separate alerts for every level or create one for price crossing any level.
Because of some TradingView limitations, alerts won't be fired for the first bar of the session. Will try to solve that in the new versions.
In the script used new v4 plotting features, so will be able to plot levels and labels nicely. Unfortunately, there is a limit on the number of consecutive lines you can plot on the plot (around 50), so lines in the past will disappear.
And remember:
Past performance does not guarantee future results.
QuantNomad - Pivot Points AlertsVery simple scripts that will allow you to receive alerts for new Pivot Lows/Highs Points.
A solid arrow points to actual point low/high point, transparent - to the bar, you'll receive alerts for (Shifter by rightBars).
And remember:
Past performance does not guarantee future results.
