Pivot Points MTFStandart pivot points which auto switching with higher TF ones.
4h pivots on 5min
1D pivots on 15min
1W pivots on 4 hours
1M pivots on daily
1Y pivots on weekly
Pivot_points

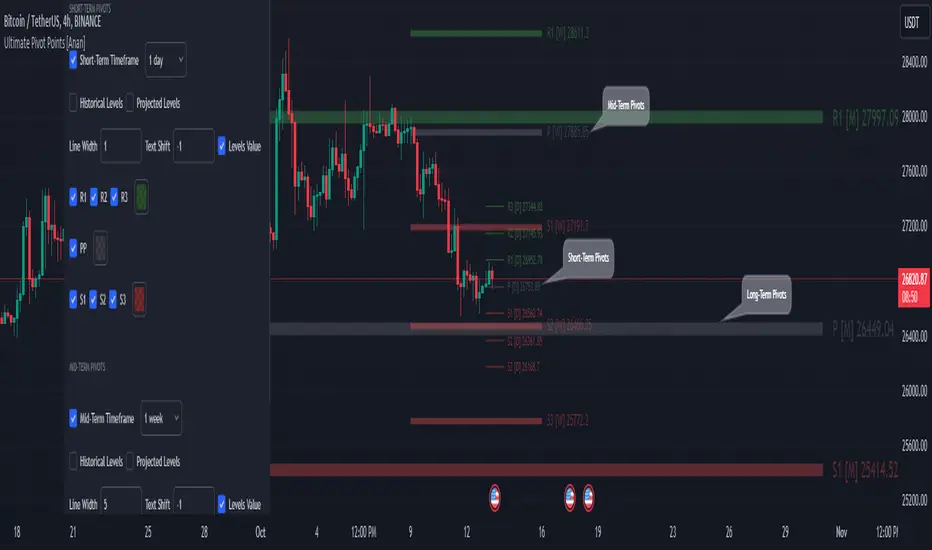
Ultimate Pivot Points [MTF/3in1/4Types/Projection/Alerts]-[Anan]Ultimate Pivot Points !
- V4 Pinescript.
- 4 Types of Pivot Points (Traditional , Fibonacci , Woodie , Camarilla ).
- Multi-time Frame: you can select Pivots Timeframe (1m, 3m ,5m,15m,30m,45m,1h,2h,3h,4h,1D,1W,1M).
- Three Pivot Points in one chart, I called them and they all have option to show or hide.
- Unlimited Number Of Pivots Back for all periods.
- Projection Pivot Points Levels.
- Each Pivot line have a label and value with period .
- Control with Line Width.
- Control with labels location with Text Shift Factor.
- Separate alerts for every Pivot Points levels.
Thanks QuantNomad for the inspiration.
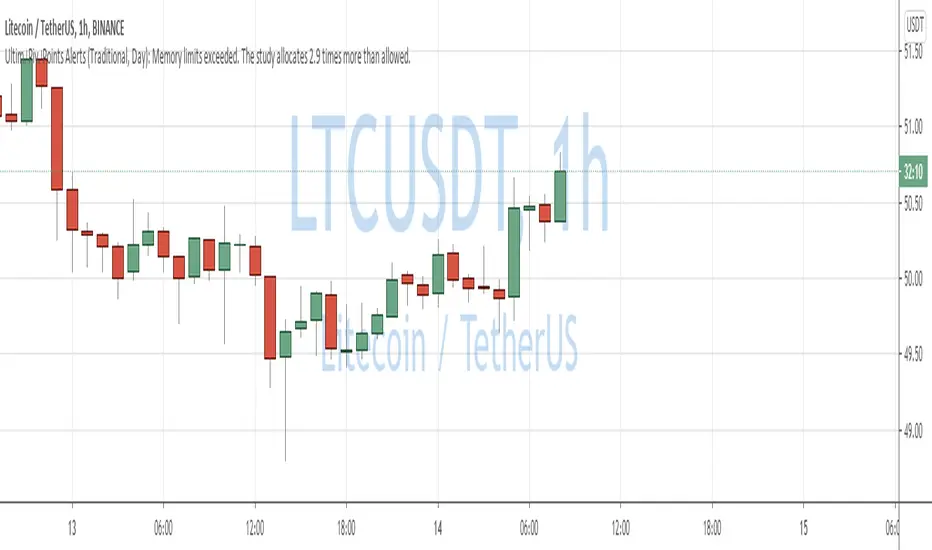
QuantNomad - Ultimate Pivot Points AlertsCreated a universal script for pivot points alerts.
In the script, you can choose one of 4 pivot point types: Traditional, Fibonacci, Woodie, and Camarilla.
You are able to create separate alerts for every level or create one for price crossing any level.
For separate levels, you can choose: "Cross", "Crossover" and "Crossunder".
You can also choose to show/hide:
Historical Levels
Levels Values
Current Levels - Levels calculated on the current period, on close of the period they will become valid levels for next periods. These levels do not participate in alerts calculations.
Because of some TradingView limitations, alerts won't be fired for the first bar of the session.
In the script used new v4 plotting features, so will be able to plot levels and labels nicely. Unfortunately, there is a limit on the number of consecutive lines you can plot on the plot (around 50), so historical lines in the past will disappear after 6-7 periods.
And remember:
Past performance does not guarantee future results.
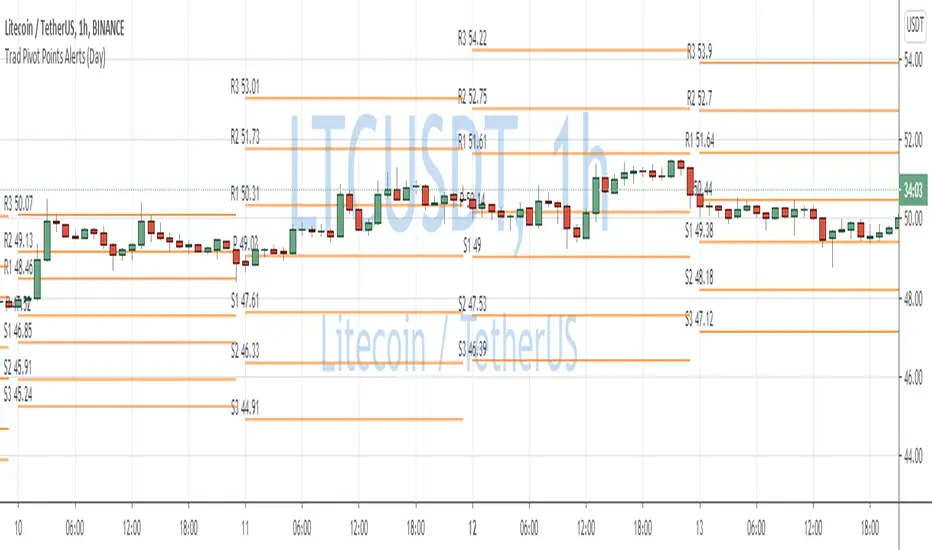
Traditional Pivot Points AlertsCreated a script for alerts on Traditional Pivot Points.
You will be able to create separate alerts for every level or create one for price crossing any level.
Because of some TradingView limitations, alerts won't be fired for the first bar of the session. Will try to solve that in the new versions.
In the script used new v4 plotting features, so will be able to plot levels and labels nicely. Unfortunately, there is a limit on the number of consecutive lines you can plot on the plot (around 50), so lines in the past will disappear.
You can enable/disable in params displaying level itself on the chart.
And remember:
Past performance does not guarantee future results.
QuantNomad - Pivot Points AlertsVery simple scripts that will allow you to receive alerts for new Pivot Lows/Highs Points.
A solid arrow points to actual point low/high point, transparent - to the bar, you'll receive alerts for (Shifter by rightBars).
And remember:
Past performance does not guarantee future results.

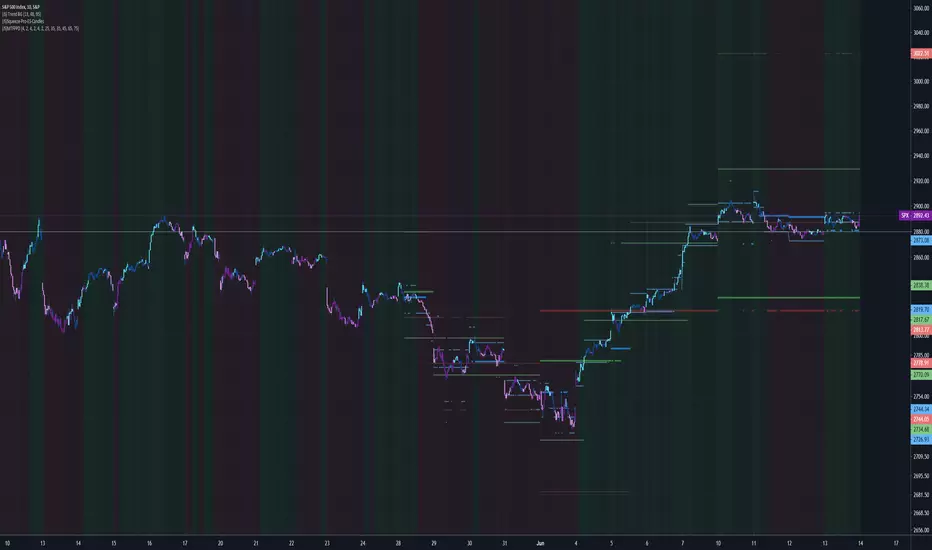
(JS) Multi-Time Frame Pivot Point DetectorSick of flipping through Pivot Point settings to change the time frame?
Or to hide certain ones because it screws up the auto-zoom?
Or are you just wishing there was something out there that was simple and effective?
Well - me too, that's why I made this automatic Pivot Points detector. Right now it only goes to S3/R3 (will expand in the future), but I made this specifically for my day trading template.
So this automatically detects the nearest Pivot Points above and below price - and it does Daily, Weekly, and Monthly, so there should be 6 lines showing at all times.
Speaking of which....
Blue - Daily
Green - Weekly
Red- Monthly
You'll also notice a really thick line will appear time to time - that thick line (on all time frames is the Pivot line, so obviously above it is the resistance lines and below it lies the support lines.
All you have to do is turn it on and you'll be completely aware of your surroundings across multiple time frames all at once, hope you like it!
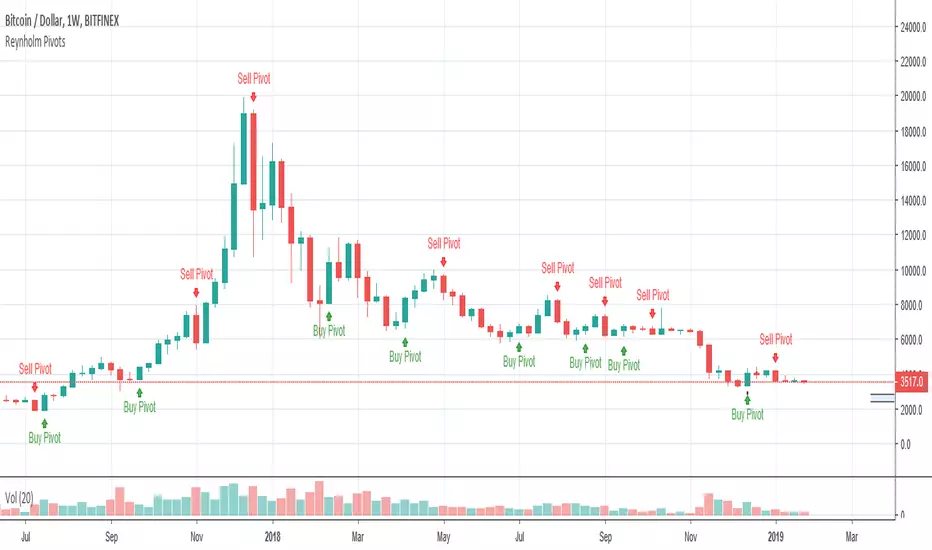
Reynholm PivotsReynholm Pivots are used by Forex, Futures and Stock Traders to flag possible reverse points. These pivots work best on higher times such as the monthly, weekly and daily time frames. I don't recommend using Reynholm Pivots on time frames lower than the daily chart. This pivots are not "buy" or" sell" signals and should not be used for this purpose, but used in conjunction with other technical and or fundamental analysis.
All PivotsYou can see all yearly, monthly, weekly and daily with this indicator automatically that they're usable for supports and resistances
