Pivot Break [ProjeAdam]OVERVIEW
This indicator provides us great convenience when analyzing the parity by drawing a range at the highest, lowest and middle levels of the previous time period in the time period we choose, and showing where the price is currently in the range it has created in the past.
ALGORITHM - How does the indicator work ?
It draws the highest and lowest values in the time of the parity you selected in the previous ‘’Time Value’’ setting by creating a range.
We can change our ‘’Time Value’’ from the settings.
In the example above, we select our Time Value setting as "Monthly" and it draws the highest and lowest values of the month in the past parity.
In this example above, we select our Time Value setting as "Weekly", it captures the highest and lowest values of the price of the past week.
The algorithm automatically plots the selected Time Value of the price in the past.
When our price falls below its past value by the Time Value we selected, our background color becomes red.
In the example above, our background becomes red for places where the price has fallen below the values of the past week
When our price rises above its historical value by the Time Value we selected, our background color becomes green.
In the example above, our background is green for the places where the price breaks above last week's values.
When breaking up or down, our background color changes only at the first break and an alarm comes here.
The breakdowns in this indicator can also be used as an auxiliary tool in trend analysis.
While the price breaking the previous time frame up and holding there is a positive confirmation for the uptrend in the market, we can consider the price breaking the previous time frame down and holding here as a downtrend in the parity.
SETTINGS PANEL
1-We can change Language of Price Labels
2-We can choose the past time highest or lowest of our price with which we want to create a range
3-Show background of break up and break down
4-If we activeted buttons allow us to receive alarms in case of breakdown in these parities that we activate.
If you have any ideas what to add to my work to add more sources or make calculations cooler, suggest in DM .
נקודות פיבוט

Trailing stopHi all!
This script helps to alert you when a trailing stop is hit. More specifically it alerts you when the low of the candle crosses below your trailing stop. A trailing stop follows a price positive movements. It raises your stop when price goes up, but keeps it at the same level if price goes down, so it "locks" in your profit. You define your long entry bar and choose one of the following methods for the stop:
ATR
The Average True Range (ATR) is popular to trail stops. The trailing stop is raised by the low minus the ATR (times a factor that can be set under the settings for ATR).
EMA
The Exponential Moving Average (EMA) can be used to trail your stop. When the low goes below the EMA an alert is sent about the stop. Its length can be set in the settings.
SMA
The Simple Moving Average (SMA) can be used to trail your stop. When the low goes below the SMA an alert is sent about the stop. Its length can be set in the settings.
Source
An external source can be useful as a stop signal. You can use this option that will stop you out when the signal returns anything else than "na". E.g. if you want a stop when KivancOzbilgic script "SuperTrend" () turns red, you set the source to "Supertrend: Down Trend". This option will not draw pretty things on the chart, but it will alert you!
Please note that this is for long entries only.
Best of trading luck!

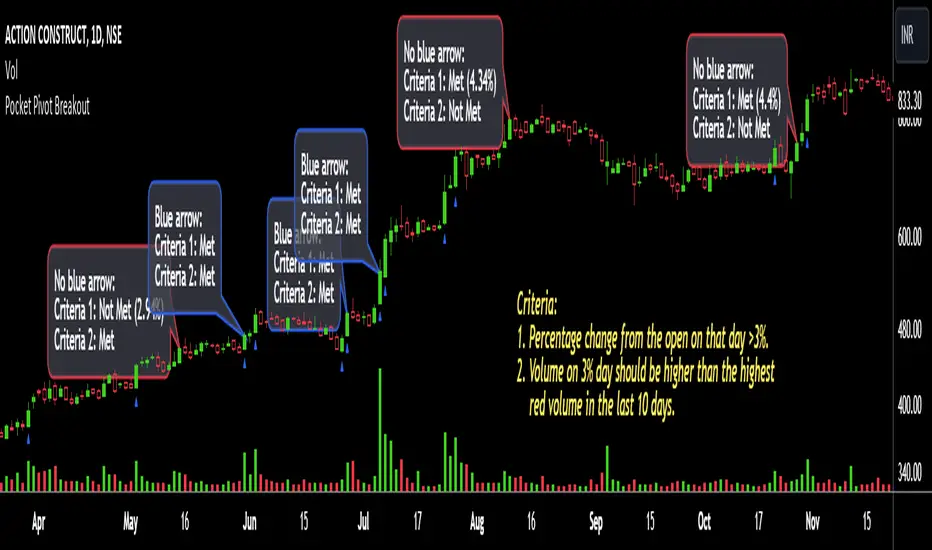
Pocket Pivot BreakoutPocket Pivot Breakout Indicator
The pocket pivot breakout indicator will show a blue arrow under the candle if both the following conditions are met:
1. The percentage change of the candle on that day from open is greater than 3%.
2. The volume on the day of 3% candle is higher than the highest red volume in the past 10 days.
The second condition is based on the 'Pocket Pivot' concept developed by Gil Morales and Chris Kacher.
If only one of the conditions is met, while the other is not, there will be no arrow.
How to use the Pocket Pivot Breakout indicator?
1. If the stock is breaking out of a proper base like (cup & handle, Darvas box etc.), you can use the blue arrow as an indicator to make your initial buy.
2. If you already own a stock, the blue arrow indicator can be used for pyramiding, following a continuation breakout from a proper base.
3. Avoid making a new entry or continuation entry if the stock is too extended from 10ma.
Gap-up > 0.5% Indicator
Gap-up Indicator displays a blue colored candle when a stock gaps up by more than 0.5% compared to previous day's close.
It is turned off by default. To activate it, check the box next to Gap-up > 0.5% in the indicator options.
How to use the Gap-up Indicator?
1. When a stock gaps up, it usually indicates strength, especially if on the day of the gap-up, the stock closes strongly.
2. This indicator should not be used in isolation but with a proper base breakout from a tight consolidation.
3. If a stock is already extended from 10ma, avoid taking any new or continuation entries.
Precautions
1. Avoid buying longs when the general market conditions are not favorable.
2. Avoid buying stocks below 200ma.
3. Avoid making a new entry or pyramid entry if a stock is too extended from 10ma.
Important Points
1. Always choose fundamentally strong stocks showing strong growth in earnings/margins/sales.
2. Buy these fundamentally strong stocks when they are breaking out of proper bases.
3. To learn more about pocket pivots and buyable gap-ups, read the book, Trade Like an O'Neil Disciple (by Gil Morales & Chris Kacher).
Cheers
Simranjit
PivottrendHi all!
This script is based on the concept of "higher highs and higher lows" and "lower highs and lower lows". Bullish/bearish trend changes when a previous pivot (low in bullish trend and high in bearish trend) is broken (or has equal value). Some settings are customizable by the user:
Timeframe
- You can choose what timeframe the pivots are found on
Left length
- The left length used for the pivots found
Right length
- The right length used for the pivots found
Show labels
- Choose if you want to display buy and sell labels
Show pivots
- Choose if you want to display the pivots found
Show MSS
- Choose if you want to display a line when price breaks a previous pivot
The "look and feel" is inspired by the script "SuperTrend" by KivancOzbilgic ().
Best of trading luck!

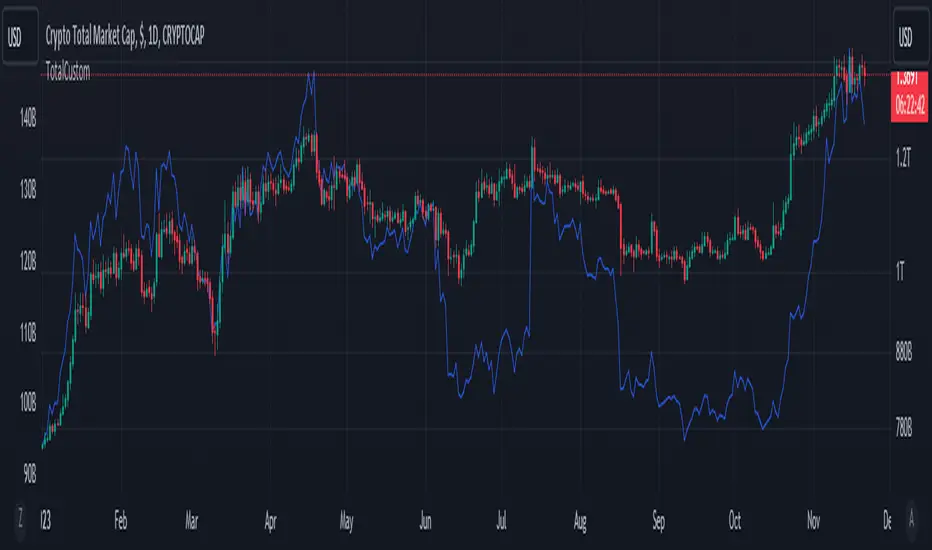
TotalCustomTotalCustom sums our custom altcoin list's market caps together.
Primarily used to compare to the following:
A. price of bitcoin
B. Total 1, Total 2, Total 3
Used in the following way:
When there is a large gap on fixed time frames (i.e. 3 month, 6 month, YTD) between this indicator and the main comparisons, it is generally considered a good time to buy.
Order Blocks W/ Realtime Fibs [QuantVue]The "Order Blocks W/ Realtime Fibs" indicator is a comprehensive tool combining the concepts of order blocks with Fibonacci retracement. The combination can be a powerful tool for identifying entry and exit points, and potential target areas.
Order blocks indicate where major players have likely placed their orders, while Fibonacci levels provide a mathematical basis for potential support and resistance areas.
What is an Order Block?
An order block in trading refers to an area on the chart in which it is believed a substantial number of orders (buy or sell) collected over a short period. Typically, these are identified as a range of consecutive aggressive bullish or bearish bars (candles). They represent areas where significant market players have entered the market, creating a footprint of their activity.
The indicator is highly customizable allowing user to select the number of consecutive bars and minimum price movement required for an order block, along with other settings like requiring a new order block in the opposite direction before finding a new order block.
Fibonacci Retracements
Fibonacci retracements are popular among technical traders, based on the idea that markets often retrace a predictable portion of a move, after which they continue to move in the original direction.
Once an Order Block is detected the indicator will automatically draw Fibonacci levels and continue to update those levels in real time until the user selected retracement level has been hit or a new more relevant order block has been found.
The combination of order blocks and Fibonacci retracements in this indicator can be used as a method for spotting potential reversal zones.
Indicator features:
🔹Custom Order Block Parameters
🔹Mitigation Type
🔹Custom Colors
🔹Select Retracement Levels
🔹Alerts for Order Blocks & Retracements
Give this indicator a BOOST and COMMENT your thoughts!
We hope you enjoy.
Cheers!

MMLE [Orderflowing]MMLE | Murrey Math Lines Extended | Support and Resistance |Auto-Readjusting
Built using Pine Script V5.
Introduction
The MMLE (Murray Math Lines Extended) Indicator is a tool designed to improve the classic Murrey Math Trading Lines.
It provides traders with a detailed framework of support and resistance, calculated over a user-defined # of bars to use period.
Inspiration and Evolution
Inspired by the utility of Murrey Math Trading Lines as a means to identify key levels, the MMLE extends this concept with additional features for a better visual aesthetic and customizable approach.
It's made to offer a clearer picture of potential turning points in the asset.
Core Functionality
The MMLE indicator dynamically calculates horizontal lines representing potential support and resistance areas based on the highest high and the lowest low over a specified number of bars.
These levels serve as a help for navigating market structure and underlying price action.
Core Customization
Traders can fit the MMLE indicator to their trading needs with several input options:
Number of Bars: Define the period for calculating high and low extremes. (32-512 bars in increments of 32 bars)
Level Display: Choose to display levels, include middle levels, or solely the pivotal zero level and support/resistance for a customized chart view.
Price Wicks: Option to include wicks for sensitivity to price spikes.
Multi-Timeframe Input: Option to draw from a different timeframe as the basis.
Detailed Level Analysis
The MMLE breaks down the price range into increments, creating these levels:
Upper Extremity Levels: Highlight overbought conditions and potential reversal zones.
Lower Extremity Levels: Suggest oversold conditions and potential bounce areas.
Central Pivot Level: The 0 level (level 4/8) acts as a market equilibrium point.
Intermediate Levels: Offers additional support and resistance.
Examples:
Only Support & Resistance Levels:
Include 0 Level:
Include Intermediate/Middle Levels:
Visual Clarity and Interpretation
Distinctive color coding and line styles provide visual cues:
Red Lines: Upper resistance and potential reversal points.
Green Line: The pivotal 0 level, indicating market balance.
Blue Lines: Lower support and potential recovery areas.
Grey Lines: Minor support or resistance.
Multi-Timeframe
The MMLE indicator is engineered with multi-timeframe capability, allowing traders to select a different timeframe from which to draw the levels.
This feature enables a comprehensive analysis across various time periods.
If a trader wanted to use the 3-hour period MMLE lines while watching the price action on a 4-hour period. That is possible with this feature.
Trading Style
The MMLE is for various trading styles, from day trading to swing trading, providing better levels for precise entry and exit points or broader market structure analysis.
Usage and Applications
Utilize the MMLE to:
Pinpoint potential reversal zones and price extremes.
Set strategic stop placements and profit targets.
Complement and enhance existing trading strategies with detailed support and resistance levels.
From extensive testing the best levels for most used timeframes are 32/64 | 128/256.
Please make sure you do your own testing with the asset of your choice.
The Value
it's an innovative extension that provides significant value through its detailed level calculations and customization options.
Customization and User Input
The MMLE respects the individual trader's strategy, offering settings for the source period, inclusion of price wicks, and level display preferences.
Conclusion
The MMLE goes beyond traditional support and resistance indicators by offering a customizable, detailed view of market structure.
It's a tool designed not to replace but to improve your existing trading strategy, providing a layer of depth to your market analysis.

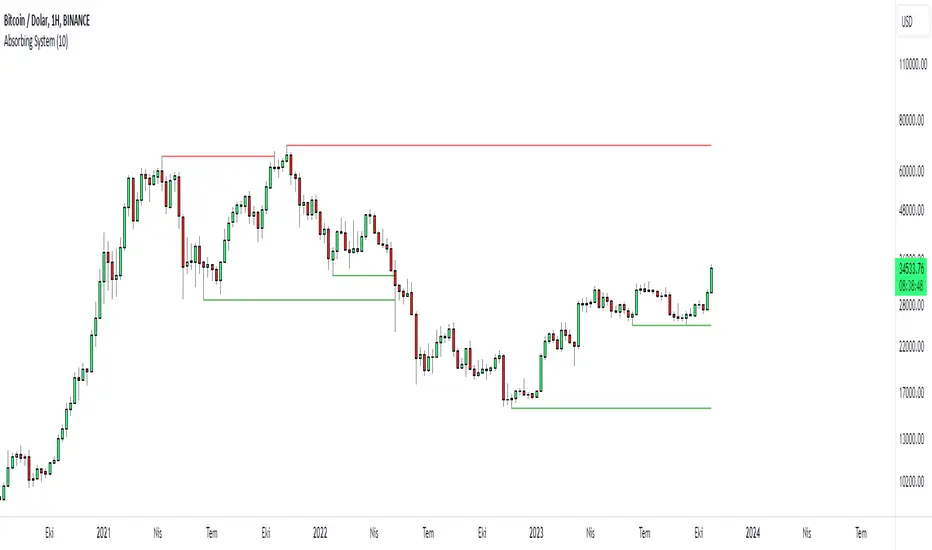
Absorbing System Support and ResistanceHello Traders :)
I am Only Fibonacci.
My purpose in coding this indicator was to detect support and resistance more easily.
What is the working principle of this indicator?
This tool detects pivot points.
If the length of the sell pin is higher than the length of the buy pin, it is considered as resistance.
It detects the formation according to the length of the pivot point and draws a line until this level is broken.
The main purpose is to add a new perspective to support and resistance detection and to prepare an educational code sequence.
The codes are open to everyone, you can develop as you wish.
In the settings you can choose whether you want to see the breakdowns, you can also choose whether the breakdowns will be with the wicks or the body.
func("RES")
func("SUP")
It is written in a functional way.
If you call "RES" inside the func method, it draws the resistors. If you throw a call other than "RES" it draws the supports.
The main concept here;
"RES" = Resistance
"SUP" = Support
Clone Pivots. Oct_2023Conceptually very simple.
The all time high or low of the chart (this indicator can be used with non-price sources as well), is used to divide the price pane continuously by 2.
For example the first pivot is (All Time High + All Time Low)/2.
From this point the price chart is further divided by 2.
The user can set the depth of division, and the lines for depth are only shown around the price.
About clone pivots.
- they can be used for ladder trading
- they are based on the range of the stock or instrument price
An alternative is available to use Fib divisions rather than simple divide by 2 method.
Labels may be placed with price or without. And depth of labelling is also an option.
Clone pivots at 50% tend to work very well with price structures - give it a try and see if it helps your trading!
Pine source uses UDTs, Methods, Arrays and Maps.

100% Daily Gain LevelsThis script takes the previous days closing value and calculates the current 100%, 200%, 300% and 400% levels for that stock.
Using that information it draws a dotted persistent line (with labels on the far right) at those levels. This information can be useful as it can then, at times, act as a support/resistance for momentum stocks. So when a stock runs 100% and holds that level, historically, that stock has a good chance to continue rising. Same when hitting additional "100%" ranges.
The user has the option to deselect the labels and/or lines.
If people find this useful then I can work on adding options that allow users more freedom to adjust how the lines are displayed as well as some enhancements to the display.

Structure_TradingHubThe smart money concept suggests that institutional traders have a greater understanding of the market and often have access to more information than retail traders. Therefore, by analyzing market structure, retail traders can align themselves with the actions of smart money and potentially profit from their moves.
This indicator considerably simplifies the process of identification of market structure for traders based on the TradingHUB-3 technical method. Therefore, it is quite different from the existing market structure or trend detection tools, even the other smart-money-based indicators.
How it works:
The indicator starts candlestick analysis from the given start point detecting followings items.
1) Identify valid pullbacks (minor Zigzag):
Uptrend: In the upward trend, each candle that hits a higher high (HH), acts as our checking candle, and if the next candle hits its low, a valid pullback is formed, and we marked the checking candle as the end of a minor leg. Note that we do not take inside bars into account. If the highest point of the leg hit, the lowest point is marked as the end of pullback leg. On the other hand, if the lowest point of the upward leg is hit, the pullback checking procedure is restarted as a downtrend. Note that the downward checking is restarted from the highest point (previous checking candle).
Downtrend: The pullback detection for downtrend follows the reverse procedure of uptrend.
2) Identify inducements (IDM)
The last pullback point (on the minor zigzag) considers as the inducement level. In the uptrend, if the price hit the IDM, the highest point on the major leg is accepted as a major higher high. Note, if the IDM point is equal to a major HL and hit by price, the highest point is accepted as a new HH and the previous HH and LL are deleted (i.e. the HH is transferred).
In the downtrend, it acts conversely.
3) Identify valid break of structures (BOS)
In the uptrend, if the price closed above the highest point between the previous accepted HH to the current candle, a BOS is accrued, and the lowest point in this time interval is accepted as a higher low (HL). In the downtrend, it acts contrariwise.
4) Identify valid change of characters (Choch)
In the uptrend, if the price closed below the lowest point between the previous accepted HL to the current candle, a Choch is accrued, and the major trend changes from uptrend to downtrend, and a new reverse IDM will be detected. In the downtrend, it acts inversely.
5) Identify major HH/HL/LL/LH points
By following the above steps, the major higher highs, higher lows, lower highs, and lower lows, as well as the major trend are detected. The major high and lows on the major trend can be displayed by zigzag style or bullet points with corresponding up/down color.
How to use it:
This indicator works in any chart timeframe, and it does not need much tunning for use. Although, two parameters can be modified:
1- Starting Point:
Mode 1: Go back a certain number of candles in the past to find the starting point.
Mode 2: Use the last major swing that is higher/lower point between X candles right and left.
2- Choch/BOS min ticks' confirmation: The user can set an extra pipettes value that price should close higher/lower than the major H/L for more confirmation.
A trader can use this indicator for trading through the following steps (Of course, the trader is not restricted in these steps and can act according to its trading strategy):
1- Recognize the trend direction by seeing the H/L or zigzag color.
2- Identify the unmitigated IDM, which is marked by "X". When the inducement hit, the level is marked by "IDM", and a major H/L is confirmed.
3- Identify an order block to trade on it. We recommend users to add "OrderBlock_TradingHub " indicator to identify valid order blocks easily according to this technical method.
4- Go to the lower timeframe to find a trigger.
Indicator Options:
1) Set the starting point based on a certain number of candles or a major swing.
2) Show/Hide Pullbacks zigzag
3) Show/Hide Inducements (IDM)
4) Show/Hide Change of Characters (CHoCHs)
5) Show/Hide Break of Structures (BOS)
6) Draw up/down Trend
7) Draw H/L Points (by major Zigzag or Bullets)
8) Set CHoCH/BOS min pipettes for confirmation
9) Change the color and style of elements on the chart

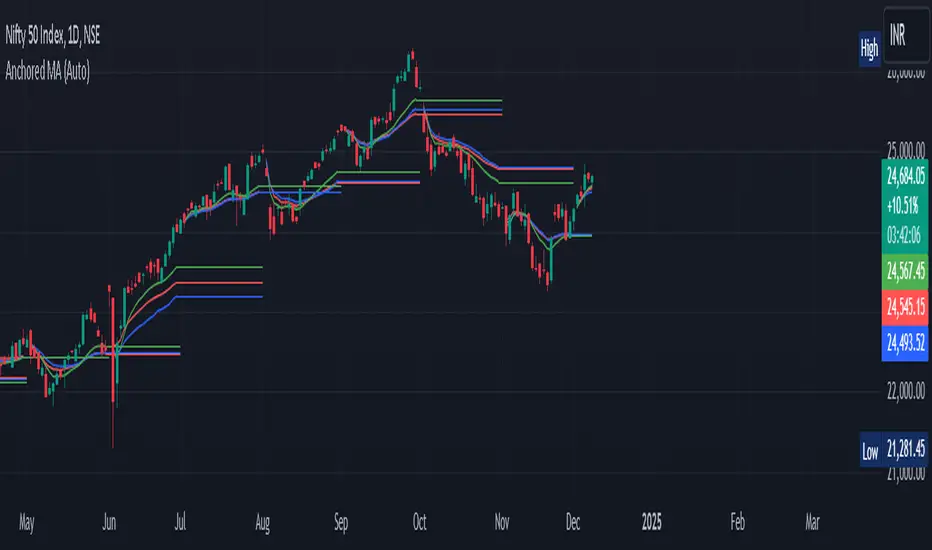
Anchored Moving Average By Market Mindset - Zero To EndlessAnchored Moving Average?
An anchored moving average (AMA) is created when you select a point on the chart and start calculating the moving average from there. Thus the moving average’s denominator is not fixed but cumulative and dynamic.
In this indicator, I've provided three different types of Anchored Moving Averages, viz., WMA, SMA and VWAP.
WMA is relevant if big moves are there.
SMA is relevant if volume data is not to be considered or if it is not available.
VWAP is the standard anchored MA, which is most commontly used. Is consider the volume data along with the price move.
In this indicator, Auto anchor is time based anchor. A trader can opt for Pivot Type Anchor or Volume Type Anchor or some higher resolution based anchor too. The length of the pivot lookback can also be changed by the user.
It can be used for intraday, swing trading and even for technical based investment purpose.
[Pivots Consolidation Breakout Screener] with Alerts (TSO) This is a pivots consolidation screener indicator, with ability to choose up to 12 different symbols/instruments with alert to be notified when consolidation happens on either one with the new pivots formation (new R3(inner resistance) pivot formed below previous one and new S3(inner support) pivot formed above previous one). Once the alert on a certain symbol/instrument is received - there is an ability to set a Breakout alert for the consolidated symbol/instrument.
This is a very powerful strategy, which doesn't happen often, but when happens - it often causes big moves after a breakout!
NOTE: Every calculation is done on a confirmed closed candle bar state, so the indicator will never repaint!
===========================================================================
Explanation of all the Features/Inputs/Settings
---------------------------------------------------------------------------
>>> On the very top, please read the important NOTES/TIPs.
>>> Next section is where the desired symbols can be turned on/checked to be screened for consolidation - the selected/checked symbols at creation of a 'Any alert() function call' alert will alert on any of the selected/checked symbols. Also, once consolidation forms, until next pivots formation - it will show it on the "Consolidation Stats" table. Once alerted on a specific symbol for consolidation - manual alert - 'Consolidation BREAKOUT' - can be created (MUST be done on the actual symbol chart, Right-Click > Add Alert) to be notified when actual breakout takes place.
>>> Pivots Settings section is where a manual timeframe/length can be set for the pivots as by Default it uses "Daily" timeframe. So, if want to experiment with more signals, but less accurate - a smaller timeframe can be set for Pivots Timeframe with smaller chart timeframe.
>>> Final section is simply the "Consolidation Stats" table location.
===========================================================================
Adding Alerts in TradngView
---------------------------------------------------------------------------
1) Consolidation alert(s) for the selected/checked symbols
- Select/check/find the desired symbols/instruments (when selecting symbols, make sure - they are from correct BROKER/SOURCE as pricing may differ between different brokers, causing confusion (under 1 broker/source, the symbol will be consolidated, under another it will not...))
-Right-click anywhere on any TradingView chart
-Click on Add alert
-Condition: Select this indicator by it’s name
-Immediately below, change it to "alert() function calls only"
-Expiration: Open-ended (that may require higher tier TradingView account, otherwise the alert will need to be occasionally re-triggered)
-Alert name: Whatever you desire
-Hit “Create”
-Note: If you change ANY Settings within the indicator – you must DELETE the current alert and create a new one per steps above, otherwise it will continue triggering alerts per old Settings!
* Once alert triggers, don't get confused, as it will show "Alert on SYMBOL", the SYMBOL will be where you created the major alert for all the symbols within the screener list! Within the alert, on the bottom, it will say: "EURUSD: Camarilla Pivots R3S3 Consolidation ALERT!" - this is where the correct symbol is for which the alert for consolidation was triggered!
---------------------------------------------------------------------------
2) Consolidation BREAKOUT alert(s)
-Right-click anywhere on any TradingView chart
-For the actual symbol (which got consolidated), open the chart (make sure timeframe is the same as with which "Consolidation alert(s)" were created prior), then Right-Click on the chart > Add Alert
-Click on Add alert
-Condition: Select this indicator by it’s name
-Immediately below, change it to "Consolidation BREAKOUT1"
-Expiration: Open-ended (that may require higher tier TradingView account, otherwise the alert will need to be occasionally re-triggered)
-Alert name: Whatever you desire
-Hit “Create”
* It will alert when a breakout occurs in any direction - once you open the chart for the symbol/instrument for which alert has occurred - you can immediately see into which direction the breakout occured, it will be marked on the chart with green/red triangle.
===========================================================================
If you have any questions or issues with the indicator, please message me directly via TradingView.
---------------------------------------------------------------------------
Good Luck! (NOTE: Trading is very risky, past performance is not necessarily indicative of future results, so please trade responsibly!)

Double Tops & Bottoms [QuantVue]This indicator is designed to detect and plot Double Tops and Double Bottoms, by setting the initial high or low using standard pivot points.
Double Tops
A Double Top is a bearish reversal pattern, typically found when an uptrend returns back to a prior peak. It signifies a potential turning point or resistance level and could potentially reverse in direction.
The pattern is confirmed as a Double Top when the price breaks above the resistance level, but closes below it. A decisive close below this level is seen as a confirmation of the bearish trend.
Double Bottoms
A Double Bottom, on the other hand, is a bullish reversal pattern typically found after a downtrend. It signals a potential turning point or support level where the price has bottomed and could potentially reverse upwards.
The pattern is confirmed as a Double Bottom when the price breaks below the support level, but closes above it. A decisive close above this level is viewed as a confirmation of the bullish trend.
Indicator Features
🔹Double Top Detection: When a double top is identified, a downward-pointing triangle will be plotted above the bar, and if the alerts are enabled, a notification will be triggered.
🔹Double Bottom Detection: When a double bottom is identified, an upward-pointing triangle will be plotted below the bar, and if the alerts are enabled, a notification will be triggered.
🔹Pivot Lookback: Defines the number of bars to the left and right of the pivot that must be lower/higher to qualify as a pivot.
🔹Maximum Length Between Tops/Bottoms: Maximum number of bars between two tops/bottoms to be considered a double top or bottom.
🔹Style Settings: Allows the user to customize the appearance of the lines indicating the tops/bottoms. Options include color selection, line style (dotted, dashed, or solid), and line thickness.
🔹Alerts: The user can enable or disable alerts for Double Top and Double Bottom.
Give this indicator a BOOST and COMMENT your thoughts!
We hope you enjoy.
Cheers!

Expanded Camarilla Levels (R5 + R6)Just the usual cam pivot points updated to have a few more levels.
Added R5/S5 and S5/S6

FV1H MS Input_230906_coThis script allows the user to visualize a momentum shifts on the candlestick charts. This is a visual indicator to help the trader quickly recognize if a potential trade exists where the market sentiment might be changing. The MS occurs when the below parameters are followed:
Creates red triangle on the chart when:
1) at the close of a green candle that was preceded by 3 or more red candle closes
2) The RSI falls below 35 during of the candles or wicks
3) The Bollinger band is pierced at any point (regardless of close) during that series of candles
Creates red triangle on the chart when the conditions are :
1) n the chart when at the close of a red candle that was preceded by 3 or more green candle closes
2) The RSI goes above 70 during of the candles or wicks
3) The Bollinger band is pierced at any point (regardless of close) during that series of candles

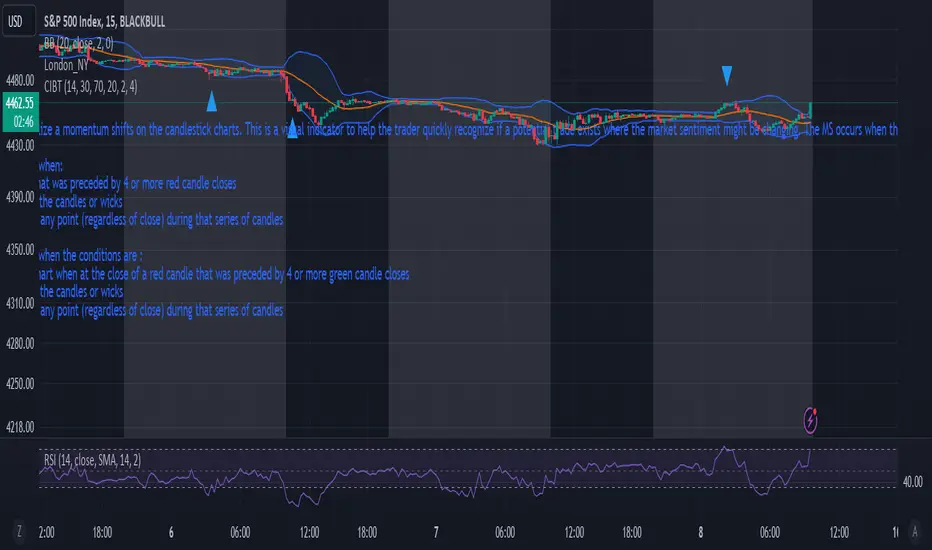
FV 15min MS_230906_coThis script allows the user to visualize a momentum shifts on the candlestick charts. This is a visual indicator to help the trader quickly recognize if a potential trade exists where the market sentiment might be changing. The MS occurs when the below parameters are followed:
Creates blue triangle on the chart when:
1) at the close of a green candle that was preceded by 4 or more red candle closes
2) The RSI falls below 30 during of the candles or wicks
3) The bollinger band is pierced at any point (regardless of close) during that series of candles
Creates blue triangle on the chart when the conditions are :
1) creates a blue triangle on the chart when at the close of a red candle that was preceded by 4 or more green candle closes
2) The RSI goes above 70 during of the candles or wicks
3) The bollinger band is pierced at any point (regardless of close) during that series of candles
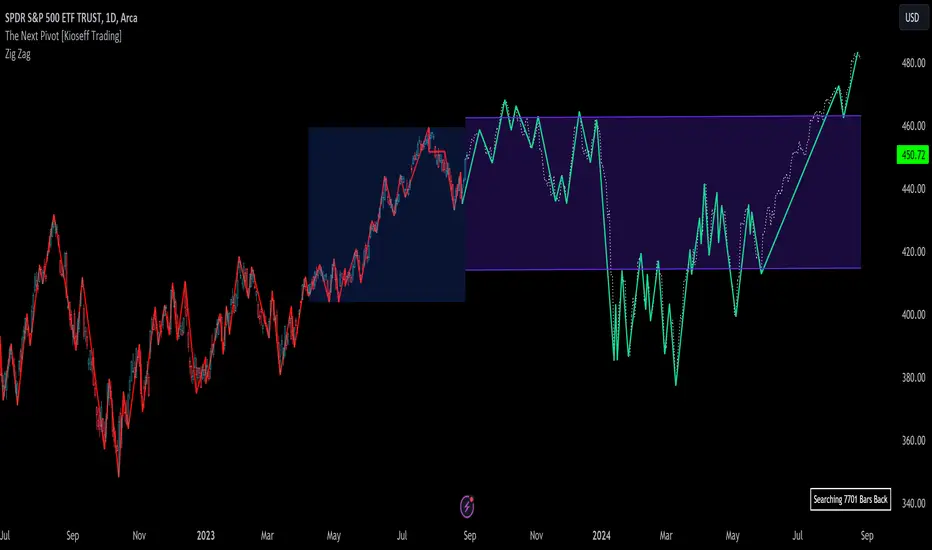
The Next Pivot [Kioseff Trading]Hello!
This script "The Next Pivot" uses various similarity measures to compare historical price sequences to the current price sequence!
Features
Find the most similar price sequence up to 100 bars from the current bar
Forecast price path up to 250 bars
Forecast ZigZag up to 250 bars
Spearmen
Pearson
Absolute Difference
Cosine Similarity
Mean Squared Error
Kendall
Forecasted linear regression channel
The image above shows/explains some of the indicator's capabilities!
The image above highlights the projected zig zag (pivots) pattern!
Colors are customizable (:
Additionally, you can plot a forecasted LinReg channel.
Should load times permit it, the script can search all bar history for a correlating sequence. This won't always be possible, contingent on the forecast length, correlation length, and the number of bars on the chart.
Reasonable Assessment
The script uses various similarity measures to find the "most similar" price sequence to what's currently happening. Once found, the subsequent price move (to the most similar sequence) is recorded and projected forward.
So,
1: Script finds most similar price sequence
2: Script takes what happened after and projects forward
While this may be useful, the projection is simply the reaction to a possible one-off "similarity" to what's currently happening. Random fluctuations are likely and, if occurring, similarities between the current price sequence and the "most similar" sequence are plausibly coincidental.
That said, if you have any ideas on cool features to add please let me know!
Thank you (:
Auto Fibonacci Levels [MisterMoTA]Using Auto Fibonacci Levels indicator users can find automatically Fibonacci Extension points where price can go after a period of consolidation (sideways or can find points for support/resistance on retracement levels that can be displayed for any defined range.
The script is different from others by letting users to define a consolidation range, user can input the time when range ends and the number of candles for looking back from the defined time, default value is 16 candles.
Users have total control over range definitions, fibonacci numbers, colors and option to show or hide the lines.
The user can choose to display Fibomacci Bullish Expansion levels and also Fibonacci Bearish Expansion level.
After a move hit a resistance or support can be choosed a range to find retracement levels, Bullish or Bearish retracement levels can be displayed checking the options from the indicator pannel.
Here are few examples of usage:
1. Bullish expansion (extension)
2. Bearish expansion (extension)
3. Bullish Retracement
4. Bearish Retracement
The indicator can be used on any timeframe for any pairs, stocks, crypto, forex.

Daily Pivots with Fakeout Protection█ OVERVIEW
The "Daily Pivots with Fakeout Protection" indicator is a powerful tool designed to help traders identify potential price breakouts and pivot levels on daily charts. This indicator calculates and displays daily pivot points along with breakout lines that are adjusted to provide a certain level of protection against fakeouts, which are false price movements that can mislead traders.
█ FEATURES
• Pivot Timeframe Selection: You can choose the timeframe for the pivot calculations. The default is set to daily (D), but you have the flexibility to select other timeframes as well.
• Fakeout Protection: A percentage-based parameter allows you to define the amount of protection you want against fakeouts. This helps filter out potentially unreliable breakouts.
• Bullish and Bearish Signals: The indicator distinguishes between bullish and bearish conditions by comparing the closing price to the daily high and low.
• Breakout Signals: Triangular symbols (upward and downward) appear below and above bars to signal potential breakout points. These are based on the closing price crossing the adjusted breakout lines.
• Visual Representation: Pivot points, daily high, and daily low are plotted on the chart, with distinctive line styles and colors for easy identification.
• Background Highlighting: The background color of the chart changes when a new period begins, helping you quickly recognize the start of a new trading day.
• Color-Coded Zones: The indicator colors the background around the closing price differently based on whether the market is bullish (green) or bearish (red).
█ HOW TO USE
1 — Apply the "Daily Pivots with Fakeout Protection" indicator to your TradingView chart.
2 — Customize the parameters like pivot timeframe and fakeout protection percentage according to your trading preferences.
3 — Watch for the triangular breakout symbols that appear above and below bars, indicating potential breakout points.
4 — Keep an eye on the pivot points, daily high, and daily low lines to understand price levels relevant to the current trading day.
5 — Use the background color changes to quickly identify the beginning of a new trading day and any potential shifts in market sentiment.
Note:
• This indicator is designed for daily charts but can be adjusted to work with other timeframes as well.
• Be cautious of relying solely on breakout signals; consider using additional technical and fundamental analysis for confirmation.
Start integrating the "Daily Pivots with Fakeout Protection" indicator into your trading strategy to enhance your ability to identify breakouts and pivot levels more effectively.

Dynamic Point of Control (POC)The Dynamic Point of Control (POC) indicator provides traders and analysts with insightful information about price levels, volume distribution, and sentiment within a specified historical range.
Instant Updates : POC recalculates with every new bar, keeping you ahead of the game.
Market Bias : Assess market sentiment through bullish volume share.
Customization : Tailor inputs to match your unique trading strategy.
Chart Presence : See POC and related data graphically on your price chart.
How to Use :
Traders can use the Dynamic POC indicator to identify Point of Control price level, understand volume distribution, and gauge market sentiment. The indicator's visual cues and customizable parameters make it a valuable tool for technical analysis and decision-making.

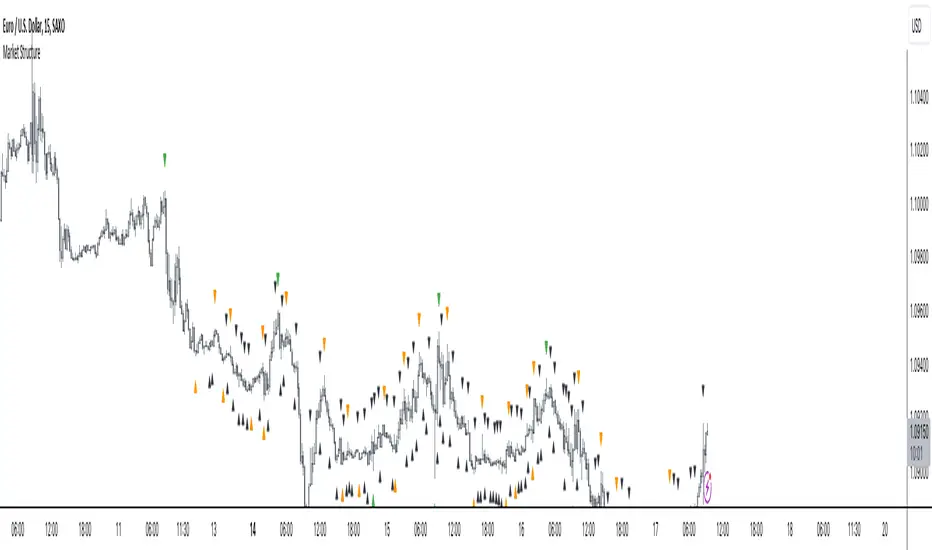
Market Structure
Intermediate Term Low (ITL): A point on a price chart where the price reaches a relatively lower level compared to the surrounding price points within an intermediate time frame.
Intermediate Term High (ITH): A point on a price chart where the price reaches a relatively higher level compared to the surrounding price points within an intermediate time frame.
Long Term Low (LTL): An Intermediate Term Low (ITL) that has higher Intermediate Term Lows (ITL) on both sides of it, indicating a potential significant reversal point and considered a long term trend change.
Long Term High (LTH): An Intermediate Term High (ITH) that has lower Intermediate Term Highs (ITH) on both sides of it, indicating a potential significant reversal point and considered a long term trend change
The script designed to automatically identify these patterns on a price chart. It categorizes ITH/L and LTH/L points for easy recognition of the market structure and potential pivot points. Traders and analysts often use such patterns and pivot points to make decisions about entering or exiting positions in the market.
Please note that while these concepts are based on certain patterns observed in historical price data, trading and investing in financial markets can be complex and risky. It's important to have a solid understanding of technical analysis, risk management, and market dynamics before making trading decisions.
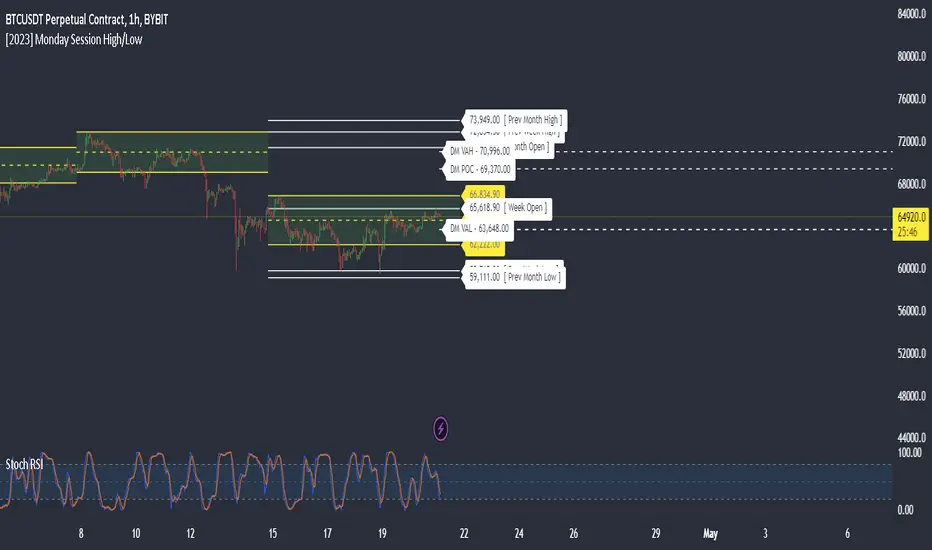
Monday Session High/LowThis script tracks and draw the High and the Low for Monday session across the whole week period.
Many crypto traders use the high and low extremes for Monday session as an confluence on how the price action during the week reacts against it.