Hidden Volume Profile[52Signal Recipe]─────────────────────────────────────
52SIGNAL RECIPE Hidden Volume Profile
◆ Overview
52SIGNAL RECIPE Smart Volume Profile is an advanced volume distribution indicator that visualizes buying and selling strength across different price levels. Unlike traditional volume profiles that only display total volume, this enhanced version separates buy volume and sell volume at each price level, revealing the hidden balance of market forces at specific prices.
Built on the same sophisticated calculation methodology as our Hidden Volume Detector, this indicator applies enhanced volume analysis to the Volume Profile framework. By displaying horizontal volume bars (green for buying, red for selling) at each price level in a separate panel, it provides clear insight into where market participants accumulated or distributed their positions.
Furthermore, when used alongside the Hidden Volume Detector that shows individual candle analysis, it enables traders to understand both micro-level (candle-by-candle) and macro-level (price-level) market dynamics comprehensively, supporting more effective trading strategies.
─────────────────────────────────────
◆ Key Features
Price-Level Volume Distribution: Displays horizontal volume bars at each price level, showing where the most trading activity occurred
Buy/Sell Volume Separation: Green bars represent buying volume (bullish pressure), red bars represent selling volume (bearish pressure) at each price level
POC (Point of Control) Identification: Automatically marks the price level with the highest total volume, acting as a strong support/resistance level
Enhanced Buy/Sell Calculation: Analyzes candle structure, position, and momentum to distinguish genuine buying pressure from selling pressure, using the same algorithm as Hidden Volume Detector
Customizable Display: Adjustable number of price levels (rows), analysis period (lookback bars), color customization, and POC line toggle
Magnet Effect Visualization: Shows how price gravitates toward high-volume areas, particularly the POC
─────────────────────────────────────
◆ Trading Application Points
Identify strong support zones where large green bars indicate buyer accumulation
Identify strong resistance zones where large red bars indicate seller distribution
Use POC as a key pivot point for support/resistance trading
Detect volume imbalances at specific price levels to find bullish or bearish zones
Combine with Hidden Volume Detector for complete analysis: individual candle timing (Hidden Volume) + price level zones (Volume Profile)
─────────────────────────────────────
◆ Synergy With Other Indicators
Use with Hidden Volume Detector for multi-dimensional volume analysis: candle-level detail + price-level overview
Combine with trend indicators (Moving Averages, MACD) to validate support/resistance levels in trending markets
Use with price action patterns to confirm breakout or reversal signals at key volume levels
─────────────────────────────────────
◆ Conclusion
52SIGNAL RECIPE Smart Volume Profile is a powerful and intuitive tool that reveals the distribution of buying and selling forces across price levels. By visualizing buy and sell volumes separately at each price level and identifying the POC, it allows traders to understand where market participants made their decisions and where key support/resistance levels exist.
Especially when used together with the Hidden Volume Detector, it provides a complete volume analysis system: Hidden Volume shows real-time buying/selling pressure in individual candles for precise entry/exit timing, while Smart Volume Profile shows accumulated buying/selling zones across price levels for strategic planning. This combination enables traders to interpret market dynamics from both micro and macro perspectives, ultimately supporting more informed and effective trading decisions.
─────────────────────────────────────
※ Disclaimer: This indicator is provided as a supplementary analysis tool and should not be used as the sole basis for trading decisions. Past data does not guarantee future results. Volume Profile is most effective in ranging markets and may be less reliable in strong trending conditions. Always apply proper risk management.
─────────────────────────────────────
─────────────────────────────────────
52SIGNAL RECIPE Hidden Volume Profile
◆ 개요
52SIGNAL RECIPE Smart Volume Profile은 가격대별 매수와 매도의 거래량 분포를 시각화하는 고급 볼륨 분석 지표입니다. 단순히 전체 거래량만 표시하는 기존 볼륨 프로파일과 달리, 각 가격대에서의 매수 볼륨과 매도 볼륨을 분리하여 보여줌으로써 특정 가격에서의 시장 세력 간 숨겨진 균형을 드러냅니다.
Hidden Volume Detector와 동일한 정교한 계산 방식을 기반으로, Volume Profile 프레임워크에 강화된 볼륨 분석을 적용했습니다. 각 가격대에 수평 거래량 막대(초록색 매수, 빨간색 매도)를 별도 패널에 표시하여, 시장 참여자들이 어느 가격에서 포지션을 축적하거나 분산했는지 명확하게 파악할 수 있도록 지원합니다.
또한, 개별 캔들 분석을 보여주는 Hidden Volume Detector와 함께 병행해 보면, 미시적 수준(캔들별)과 거시적 수준(가격대별) 시장 역학을 모두 종합적으로 이해할 수 있어, 훨씬 효과적인 매매 전략 수립이 가능합니다.
─────────────────────────────────────
◆ 주요 특징
가격대별 거래량 분포: 각 가격대에 수평 거래량 막대를 표시하여 가장 많은 거래가 일어난 곳을 시각화
매수·매도 볼륨 구분: 각 가격대에서 초록색 막대는 매수 볼륨(상승 압력), 빨간색 막대는 매도 볼륨(하락 압력) 표시
POC (Point of Control) 식별: 가장 많은 거래량이 발생한 가격대를 자동으로 표시하며, 강력한 지지/저항선 역할 수행
향상된 매수·매도 계산: 캔들의 구조, 위치, 모멘텀을 분석하여 진정한 매수 압력과 매도 압력을 구분하며, Hidden Volume Detector와 동일한 알고리즘 사용
커스터마이징 가능한 디스플레이: 가격 레벨 수(행), 분석 기간(룩백 바), 색상 커스터마이징, POC 라인 토글 조정 가능
자석 효과 시각화: 가격이 고거래량 구간, 특히 POC로 회귀하려는 경향을 보여줌
─────────────────────────────────────
◆ 트레이딩 활용 포인트
큰 초록 막대가 있는 곳을 강한 지지 구간으로 활용(매수 세력 축적)
큰 빨간 막대가 있는 곳을 강한 저항 구간으로 활용(매도 세력 분산)
POC를 핵심 피봇 포인트로 활용하여 지지/저항 매매 전략 수립
특정 가격대의 거래량 불균형을 감지하여 강세 또는 약세 구간 파악
Hidden Volume Detector와 결합하여 완전한 분석: 개별 캔들 타이밍(Hidden Volume) + 가격대 구간(Volume Profile)
─────────────────────────────────────
◆ 다른 지표와 조합 가능성
Hidden Volume Detector와 함께 사용하여 다차원적 볼륨 분석: 캔들 레벨 디테일 + 가격 레벨 전체 조망
추세 지표(이동평균선, MACD)와 결합하여 추세장에서 지지/저항 레벨 검증
가격 패턴과 함께 활용하여 주요 거래량 레벨에서의 돌파 또는 반전 신호 확인
─────────────────────────────────────
◆ 결론
52SIGNAL RECIPE Smart Volume Profile은 가격대별 매수와 매도 세력의 분포를 드러내는 강력하고 직관적인 지표입니다. 각 가격대에서 매수 볼륨과 매도 볼륨을 분리하여 시각화하고 POC를 식별함으로써, 시장 참여자들이 어디서 의사결정을 내렸는지, 어디에 주요 지지/저항 레벨이 존재하는지 이해할 수 있도록 돕습니다.
특히 Hidden Volume Detector와 함께 사용하면 완전한 볼륨 분석 시스템을 구축할 수 있습니다. Hidden Volume은 개별 캔들에서의 실시간 매수/매도 압력을 보여줘 정확한 진입/청산 타이밍을 제공하고, Smart Volume Profile은 가격대별 누적된 매수/매도 구간을 보여줘 전략적 계획 수립을 지원합니다. 이러한 조합은 트레이더들이 미시적·거시적 관점 모두에서 시장 역학을 해석할 수 있게 하여, 궁극적으로 더 정보에 기반한 효과적인 매매 의사결정을 가능하게 합니다.
─────────────────────────────────────
※ 면책 조항: 본 지표는 투자 판단을 위한 보조 도구로 제공되며, 단독 의존해서는 안 됩니다. 과거 데이터에 기반한 분석이므로 미래 결과를 보장하지 않습니다. Volume Profile은 횡보장에서 가장 효과적이며 강한 추세 상황에서는 신뢰도가 낮을 수 있습니다. 적절한 리스크 관리와 함께 사용하시기 바랍니다.
נקודות ורמות Pivot

Order Blocks, Breakers & Trend LinesSyntropy OB — Professional Order Blocks, Breakers & Trend Lines Toolkit
A clean, institutional-grade Price Action tool trusted by thousands of smart traders.
What makes Syntropy OB different:
• Dual-layer Order Block detection (two independent ZigZag sensitivities)
• Smart Breaker Blocks (OBs violated but never retested)
• Second independent Breaker Block engine for higher-timeframe confirmation
• Violated & retested OBs with strength + proximity filters (no chart clutter)
• Two fully automatic dynamic Trend Line sets with configurable channel width (ATR-based)
• Real-time extension of lines and blocks to the current bar
• Minimalist, beautiful and highly customizable colors
• Zero repainting — 100% reliable structure
Perfect for:
→ ICT / Smart Money Concepts
→ Supply & Demand
→ Classic Price Action
→ Swing & intraday trading on any market (Crypto, Forex, Stocks, Futures)
No lag. No nonsense. Just pure, clean structure.
Add to favorites — this is the last Order Block + Trend Line tool you’ll ever need.
Enjoy the edge,
Syntropy Labs

CISD & Projections BossThis is a CISD (Change in State of Delivery) indicator with Fibonacci-style projections. Here's what it does:
Core Functionality
1. Pivot Detection
Uses Williams Fractal logic to identify swing highs and lows based on your specified pivot strength
Can use either candle bodies or wicks for calculations
2. CISD Detection
The indicator identifies "Change in State of Delivery" moments - institutional trading concept where:
For bullish CISD (CISD+): Finds a swing low, then looks backward to identify the preceding series of bearish candles. When price breaks above this bearish series, it marks a CISD+ (change from bearish to bullish delivery)
For bearish CISD (CISD-): Finds a swing high, then looks backward to identify the preceding series of bullish candles. When price breaks below this bullish series, it marks a CISD- (change from bullish to bearish delivery)
The CISD line is drawn from the start of the series to the breakout point at the series extreme (high for bullish, low for bearish).
3. Range Projections
Once a CISD is confirmed, the indicator:
Calculates the range of the broken series (high - low)
Projects multiples of that range as potential targets
Default levels are 1x, 1.5x, 2x, 2.5x, 3x, and 4x the series range
Bullish projections extend upward from the CISD+ line
Bearish projections extend downward from the CISD- line
Visual Elements
CISD lines (thick lines in blue for bullish, red for bearish)
Projection levels (thinner horizontal lines extending from the breakout point)
Labels showing the multiplier for each projection level
Optional pivot shapes to mark swing points
This is essentially tracking institutional "order flow changes" and projecting measured moves based on the size of the broken delivery pattern - very much in line with ICT (Inner Circle Trader) concepts.

Equal Highs/Lows Multi-Pivot [Julio]Equal Highs/Lows Multi-Pivot
Description
A sophisticated multi-timeframe pivot analysis tool that detects and highlights equal highs and equal lows across four different pivot lengths simultaneously. This indicator identifies price levels where the market creates identical extremes, a powerful signal of institutional support/resistance and potential reversal or breakout zones.
How It Works
Four Independent Pivot Streams
Pivot 1 (Intraday - 2 bars): Ultra-fast level detection for scalpers
Pivot 2 (Session - 4 bars): Short-term swing levels
Pivot 3 (Daily - 6 bars): Medium-term structural levels
Pivot 4 (Weekly - 9 bars): Long-term institutional levels
Equal High (EQH) Detection
Compares consecutive swing highs and draws a line when two highs are nearly identical within a defined threshold. The indicator uses ATR-based confluence to determine "equality," filtering out noise while catching true market structure.
Equal Low (EQL) Detection
Same logic applied to swing lows, identifying support zones where price repeatedly fails to break below previous lows.
Key Features
Four Simultaneous Timeframes: Analyze intraday, session, daily, and weekly structures all on one chart
ATR-Based Confluence Threshold: Automatically adjusts sensitivity based on current volatility (no fake signals)
Color-Coded Levels: Each pivot length has distinct colors for instant visual identification
Highs: Red, Orange, Yellow, Fuchsia
Lows: Green, Blue, Aqua, Purple
Confirmation Mode: Optional setting to wait for full pivot confirmation before marking levels
Customizable Alert Zones: Toggle individual pivot lengths on/off to reduce clutter
Smart Label Positioning: Labels auto-center between the two equal pivots for clarity
Ideal For
Swing traders tracking support/resistance across multiple timeframes
Scalpers identifying micro-structure for quick entries and exits
Market structure analysts studying institutional price action patterns
Multi-timeframe traders needing confluence from intraday to weekly levels
Anyone trading 1-minute to 4-hour charts
Trading Applications
Identify strong support/resistance zones: Equal levels = confirmed institutional levels
Confirm trend reversals: Multiple equal lows = strong accumulation zone; multiple equal highs = distribution
Plan entries with precision: Enter near equal levels for higher probability setups
Detect liquidity concentration: Where price repeatedly tests the same level
Multi-timeframe confluence: Look for equal levels across multiple pivot lengths for ultra-strong zones
How to Use
Identify the equal levels: Color-coded lines instantly show where price creates matching extremes
Check for confluence: Strong setups occur where multiple pivot lengths align
Wait for price action: Watch for breakouts through equal levels or reversals at these zones
Enter with structure: Use equal levels as entry/exit triggers combined with your trading methodology
Manage with confidence: These levels mark institutional decision points
Customization Options
Adjust pivot lengths to match your preferred timeframe structure
Set ATR threshold sensitivity (lower = stricter equality, higher = more signals)
Toggle confirmation mode for additional filter
Enable/disable individual pivot streams to reduce visual clutter
Customize colors to match your chart theme
Default Settings Optimized For
NASDAQ futures and liquid forex pairs
Intraday and swing trading (1-minute to 4-hour charts)
Smart Money / ICT trading methodologies
Volatility-adjusted confluence detection

Liquidity Mix- Supply and DemandLiquidity Mix highlights developing and confirmed supply/demand zones and optional trade guides with entries, stops, targets, and risk/reward math. Benefits: see high-probability reaction areas early, size positions automatically from your risk input, track reward multiples, and receive optional alerts when price tags zones or entries—all in one overlay.

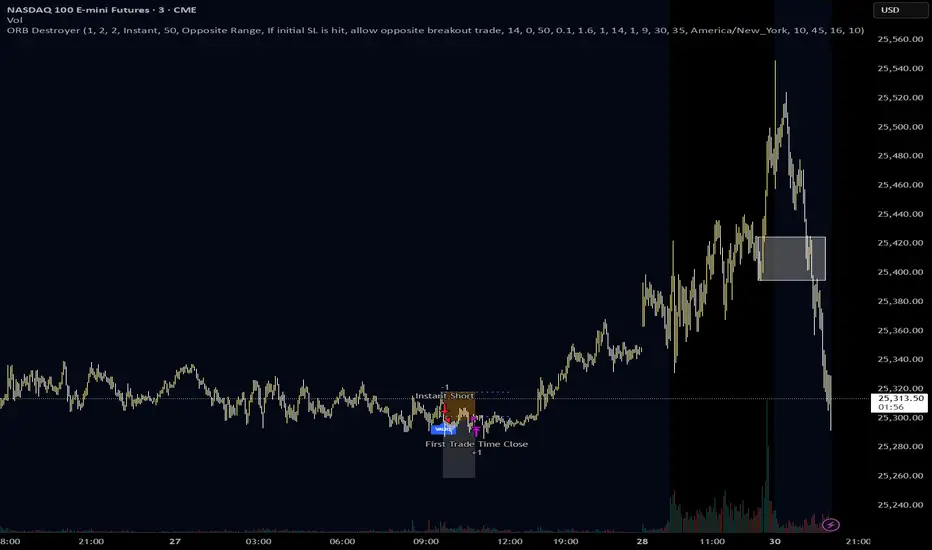
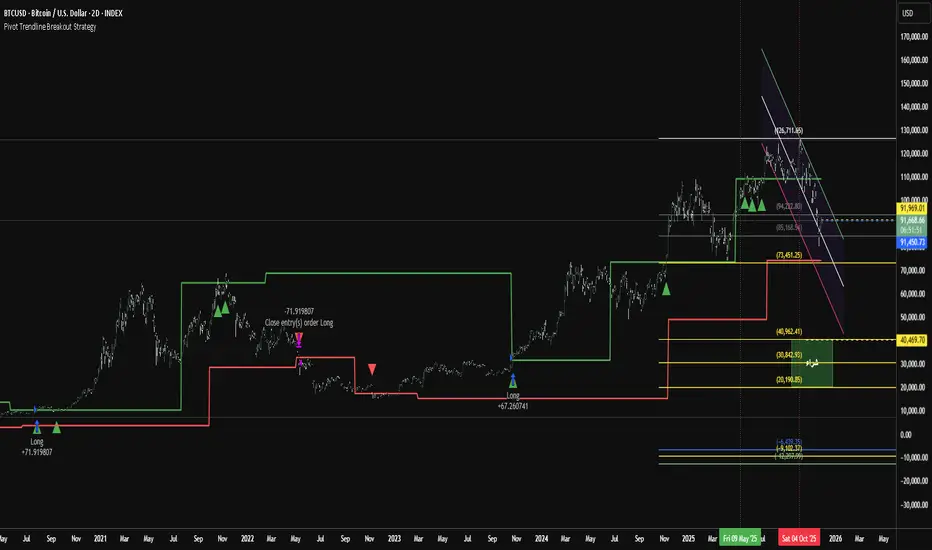
Pivot Trendline Breakout StrategyHow it works:
Long entry: triggered immediately when price closes above the green upper pivot trendline.
Exit (go flat): triggered immediately when price closes below the red lower pivot trendline.
Uses 100% of equity per trade (you can change default_qty_value if you prefer fixed size or risk %).
Works on any timeframe.
XAUUSD 9/1 and 6/4 ZONE LINE (Buy zone and SELL zone)When trading the XAUUSD pair, I noticed that gold often reverses from price levels ending with the digits 9/1 and 6/4. Because of this pattern, I began drawing lines based on these price endings and integrating them into my trading strategy. When combined with other trading methods, these levels provided strong and consistent results.
Feel free to try it yourself — just make sure to analyze the market carefully before entering any trade!

Simulateur Carnet d'Ordres & Liquidité [Sese] - Custom🔹 Indicator Name
Order Book & Liquidity Simulator - Custom
🔹 Concept and Functionality
This indicator is a technical analysis tool designed to visually simulate market depth (Order Book) and potential liquidity zones.
It is important to adhere to TradingView's transparency rules: This script does not access real Level 2 data (the actual exchange order book). Instead, it uses a deductive algorithm based on historical Price Action to estimate where Buy Limit (Bid) and Sell Limit (Ask) orders might be resting.
Methodology used by the script:
Pivot Detection: The indicator scans for significant Swing Highs and Swing Lows over a user-defined lookback period (Length).
Level Projection: These pivots are projected to the right as horizontal lines.
Red Lines (Ask): Represent potential resistance zones (sellers).
Blue Lines (Bid): Represent potential support zones (buyers).
Liquidity Management (Absorption): The script is dynamic. If the current price crosses a line, the indicator assumes the liquidity at that level has been consumed (orders filled). The line is then automatically deleted from the chart.
Density Profile (Right Side): Horizontal bars appear to the right of the current price. These approximate a "Time Price Opportunity" or Volume Profile, showing where the market has spent the most time recently.
🔹 User Manual (Settings)
Here is how to configure the inputs to match your trading style:
1. Detection Algorithm
Lookback Length (Candles): Determines the sensitivity of the pivots.
Low value (e.g., 10): Shows many lines (scalping/short term).
High value (e.g., 50): Shows only major structural levels (swing trading).
Volume Factor: (Technical note: In this specific code version, this variable is calculated but the lines are primarily drawn based on geometric pivots).
2. Visual Settings
Show Price Lines (Bid/Ask): Toggles the horizontal Support/Resistance lines on or off.
Show Volume Profile: Toggles the heatmap-style bars on the right side of the chart.
Extend Lines: If checked, untouched lines will extend to the right towards the current price bar.
3. Colors and Transparency Management
Customize the aesthetics to keep your chart clean:
Bid / Ask Colors: Choose your base colors (Default is Blue and Red).
Line Transparency (%): Crucial for chart visibility.
0% = Solid, bright colors.
80-90% = Very subtle, faint lines (recommended if you overlay this on other tools).
Text Size: Adjusts the size of the price labels ("BUY LIMIT" / "SELL LIMIT").
🔹 How to Read the Indicator
Rejections: Unbroken lines act as potential walls. Watch for price reaction when approaching a blue line (support) or red line (resistance).
Breakouts/Absorption: When a line disappears, it means the level has been breached. The market may then seek the next liquidity level (the next line).
Density (Right-side boxes): More opaque/visible boxes indicate a price zone "accepted" by the market (consolidation). Empty gaps suggest an imbalance where price might move through quickly.
⚠️ Disclaimer
This script is for educational and technical analysis purposes only. It is a simulation based on price history, not real-time order book data. Past performance is not indicative of future results. Trading involves risk.

Key Levels: Monday / Weekly / Monthly + Year/Quarter + LiquidityKey Levels: Monday / Weekly / Monthly / Year / Quarter + Liquidity

SNP420/TRCS_MASTERMicro Body Candle Highlighter is a visual tool for TradingView that continuously scans the active timeframe and highlights all candles with an extremely small body.
For every bar (including the currently forming one), the indicator compares the absolute distance between Open and Close to a user-defined threshold in ticks (default: 1 tick, based on syminfo.mintick).
If the candle’s body size is less than or equal to this threshold, the indicator draws a red frame around the candle – either around the body only or the full high-to-low range, depending on user settings.
Optionally, the indicator can also trigger alerts whenever such a “micro body” candle is detected, allowing traders to react immediately to potential indecision, pauses, or micro-reversals in price action.
author: SNP_420
project: FNXS
ps: Piece and love

8am H1 High/LowThis indicator labels and produces horizontal lines indicating 1 hour liquidity levels.

Chandelier Exit + Pivots + MA + Swing High/LowIt combines four indicators.
For use in the Hero course.

Psychological levels [Kodologic] Psychological levels
Markets are not random, they are driven by human psychology and algorithmic order flow. A well-known phenomenon in trading is the "Whole Number Bias" — the tendency for price to react significantly at clean, round numbers (e.g., Bitcoin at $95,000 or EURUSD at 1.0500).
Manually drawing horizontal lines at every round number is tedious, clutters your object tree, and distracts you from analyzing price action.
Psychological levels Numbers is a workflow utility designed to solve this problem. It automatically projects a clean, customizable grid of key price levels onto your chart, helping you instantly identify areas where liquidity and orders are likely to cluster.
Why This Indicator Helps Traders :
Professional traders know that "00" and "50" levels act as magnets for price. Here is how this tool assists in your analysis:
1. Institutional Footprints : Large institutions and bank algorithms often execute orders at whole numbers to simplify accounting. This script highlights these potential liquidity zones automatically.
2. Support & Resistance Discovery: You will often notice price wicking or reversing exactly on these grid lines. This helps in spotting natural support and resistance without needing complex technical analysis.
3. Cognitive Load Reduction: Instead of calculating where the next "major level" is, the grid is visually present, allowing you to focus on candlestick patterns and market structure.
Features :
Dynamic Calculation : The grid updates automatically as price moves, you never have to redraw lines.
Zero Clutter : The lines are drawn using code, meaning they do not appear in your manual drawing tools list or clutter your object tree.
Fully Customizable Step : You define what constitutes a "Round Number" for your specific asset class (Forex, Crypto, Indices, or Stocks).
Visual Control : Adjust line styles (Solid, Dotted, Dashed), colors, and transparency to keep your chart aesthetic and readable.
How to Use in Your Strategy :
1. Target Setting (Take Profit)
If you are in a long position, use the next upper grid line as a logical Take Profit area. Price often gravitates toward these whole numbers before reversing or consolidating.
2. Stop Loss Placement
Avoid placing Stop Losses exactly on a round number, as these are often "stop hunted." Instead, use the grid to visualize the level and place your stop slightly *below* or *above* the round number for better protection.
3. Confluence Trading
Do not use these lines in isolation. Look for Confluence :
Example: If a Fibonacci 61.8% level lines up exactly with a Round Number grid line, that level becomes a high-probability reversal zone.
Settings Guide (Important)
Since every asset is priced differently, you must adjust the "levels Step Size" to match your instrument:
Forex (e.g., EURUSD, GBPUSD): Set Step Size to `0.0050` (50 pips) or `0.0100` (100 pips).
Crypto (e.g., BTCUSD): Set Step Size to `500` or `1000`.
Indices (e.g., US30, SPX500): Set Step Size to `100` or `500`.
Gold (XAUUSD):** Set Step Size to `10`.
Disclaimer: This tool is for educational and visual aid purposes only. It does not provide buy or sell signals. Always manage your risk.

Previous & Current Day LevelsPine Script indicator that displays key price levels from the previous trading day and the current day's opening price on your chart.
What it displays:
The script draws four horizontal reference lines across your chart:
Previous Day High (PDH) - The highest price reached yesterday
Previous Day Low (PDL) - The lowest price reached yesterday
Previous Day Close (PDC) - Yesterday's closing price
Daily Open (DO) - Today's opening price
Key features:
Visual customization - You can adjust colors, line styles (solid/dashed/dotted), line thickness, and text size for all levels
Label positioning - Labels can be offset to the right of the current price action to keep them visible and out of the way
Flexible display - Choose between full descriptive labels ("Prev Day High") or shorthand abbreviations ("PDH")
Performance optimization - The script limits how far back lines are drawn (configurable up to 5000 bars) to prevent rendering issues
Clean presentation - Each level includes a solid horizontal line from its starting point, plus a dotted connector line extending to the label
Why traders use it:
These levels are important reference points for intraday traders. Previous day levels often act as support/resistance zones, and the daily open helps identify potential trend direction. The script automatically updates these levels each day, making it easy to track key price areas without manual drawing.

Daily Open Range - TatoshiDisplays a daily open range for both current and previous days. Gives users the flexibility to adjust the number of minutes that the daily open range is determined by. I personally use the first 30 minutes, but adjust at your discretion.
Another GOAT of a indicator. I don't use as much as my monthly open inidcator but for trading lower time frames, this allows the user to easily set their bias for the day and extremely simple to build a strategy around.

Double MOST with Pivot and EMAMOST Long Strategy with Multi-Filter Confirmation (Pivot + VAR Trend Filter)
This strategy combines a custom MOST stop-line structure with a moving average trend filter (EMA / VAR / ZLMA), daily pivot levels, and a 9-period VAR filter to generate clean long-only entries.
It aims to capture early trend continuations while avoiding reversals and false breakouts.
✔ Buy Conditions
A long position is opened only if all of the conditions below occur simultaneously:
MA (ort) > MOST Line (s2)
– Confirms that momentum is on the long side.
Price > Daily Pivot (pvt_gun)
– Ensures the market is trading above the day’s fair-value level.
Price > VAR(9)
– Short-term VAR filter to confirm trend strength and reduce noise.
Only the first bar where all conditions turn true generates a position.
✔ Sell Condition
A long position is closed when:
MOST Line (s2) crosses above MA (ort)
– Indicates a momentum shift against the long position.
✔ Execution Style (MetaStock-like)
Strategy operates long-only
Orders are filled on the next bar open, not on the signal bar
Commission: 0.03% (3 bps / on-binde 3)
Position size: 100% of equity per trade
This makes the behavior comparable to classical MetaStock backtesting logic.
✔ Chart Markers
Only actual trade entries and exits are drawn
No repeated signals or overlapping markers
Clean visual trade history
Purpose
This strategy is ideal for traders who want:
A structured long-only trend model
A multi-layer confirmation filter
Clean execution without repaint
High-quality entries above market structure levels

Auto Div ADX STO RSI (Flip+P) v2This strategy combines multi-indicator divergence detection, momentum confirmation and adaptive position management into a unified automated trading framework.
It identifies regular bullish and bearish divergences using RSI and Stochastic (K), with configurable confirmation logic (RSI+STO, RSI only, or STO only). Divergences are validated only when price forms a lower low / higher high while the oscillator forms a higher low / lower high within a user-defined lookback window.
To filter low-quality setups, the strategy applies an ADX trend strength requirement, ensuring signals are taken only when market conditions reflect sufficient directional energy. Optional stochastic filters (oversold/overbought K levels) can further refine long and short entries.
Once a valid signal appears, the system supports Automatic Flip Logic:
If a bullish divergence forms during a short position, the strategy closes the short and flips long.
If a bearish divergence forms during a long position, it closes the long and flips short.
Position sizing uses adaptive pyramiding: the initial flip takes size proportional to the opposite side’s accumulated units, and new signals in the same direction can add incremental units (scale-in) if enabled. This models progressive conviction as new divergence signals occur.
All entries can optionally be required to confirm on bar close.
Alerts are included for both Long and Short entries.
Key Features
• Automatic detection of RSI and Stochastic divergences
• User-selectable confirmation rules (RSI, STO, or both)
• ADX-based strength filter
• Optional Stochastic K oversold/overbought filters
• Full flip logic between Long and Short
• Dynamic pyramiding and configurable scale-ins
• Bar-close confirmation option
• Alerts for Long/Short entries
• Status-line visualization of ADX, RSI, Stochastic, and unit cycles
This strategy is designed for traders who want a structured, divergence-based model enhanced with trend strength filtering and flexible position management logic, suitable for systematic discretionary trading or fully automated execution.

Weekly Open Range - TatoshiDisplays a weekly open range for both current and previous weeks. Gives users the flexibility to adjust the number of hours that the weekly open range is determined by. I personally use the first 3 hours, but play around with it.
A GOAT of a indicator, allows the user to easily set their bias for the week and extremely simple to build a strategy around.

Monthly Open Range - TatoshiDisplays a monthly open range for both current and previous months. Gives users the flexibility to adjust the number of hours that the monthly open range is determined by. I personally use the first 10 hours, but play around with it.
A GOAT of a indicator, allows the user to easily set their bias for the month and extremely simple to build a strategy around.

inyerneck Diaper Sniper v16 — LOW VOL V CATCHERDiaper Sniper v16 — Low-Vol Reversal Hunter
Catches dead-cat bounces and V-shaped reversals on the day’s biggest losers.
Designed for pennies and trash stocks that drop 6 %+ from recent high and snap back on any volume + green candle.
Features:
• Tiny green “D” = reversal signal
• Works on 1m → daily
• Fully adjustable filters
Best on low-float runners that bleed hard and bounce harder.
Use tiny size — it fires a lot.
Public version — code visible. No invite-only on Essential plan.
do not alter settings with out first recording defaults.. defaults are quite effective
2025 build. Test at your own risk.

Key Levels: PDH/L, PMH/L, Oopening RangeBasic scrip that shows Previous Day High and Low, and also Pre-Market High Lows, and also the Opening Range. Everything is adjustable.

Support Line [by rukich]🟠 OVERVIEW
The indicator displays a floating line that acts as a support level. It's important to remember that any support level can be broken.
🟠 COMPONENTS
The indicator is based on the percentage difference between the closes of the n-th bar back and the current bar. The resulting percentage is smoothed to remove noise.
The indicator is displayed as a green-red line (the colors don’t carry meaning — they are used just for visual variety). When the price touches the support level, the bar background turns green.
For convenience, there is a label on the right side of the indicator showing the current value of the line.
🟠 HOW TO USE
The indicator includes several settings that can be adjusted, though optimal defaults are provided.
Settings:
Timeframe — specifies which timeframe’s data is used to calculate the line.
Candles back — specifies how many bars back from the current one are used.
The indicator should be used according to general support-zone logic. Since no support zone guarantees a price bounce, the optimal approach is to confirm the reaction after the price touches the line.
Example of use:
In the current example, the Timeframe in the indicator settings is set to 1 hour, and the currently open chart is 5 minutes. This means that on the 5-minute chart we see a 1-hour line. After the price touches the support line, you need to see a confirmation of the reaction to understand whether the support zone is holding the price.
In the examples, reaction confirmation is shown through: the formation of an M5 shift and the invalidation of an FVG M5- (the latter is more risky than the M5 shift):
🟠 CONCLUSION
The indicator shows a floating support zone, and when tested, you should confirm the reaction on a lower timeframe.
