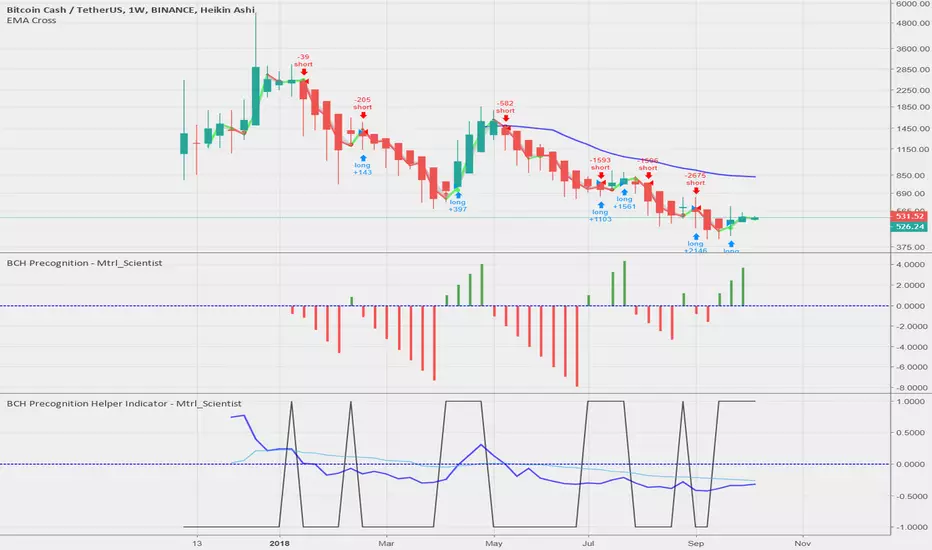
BCH Precognition - Mtrl_ScientistHello everyone,
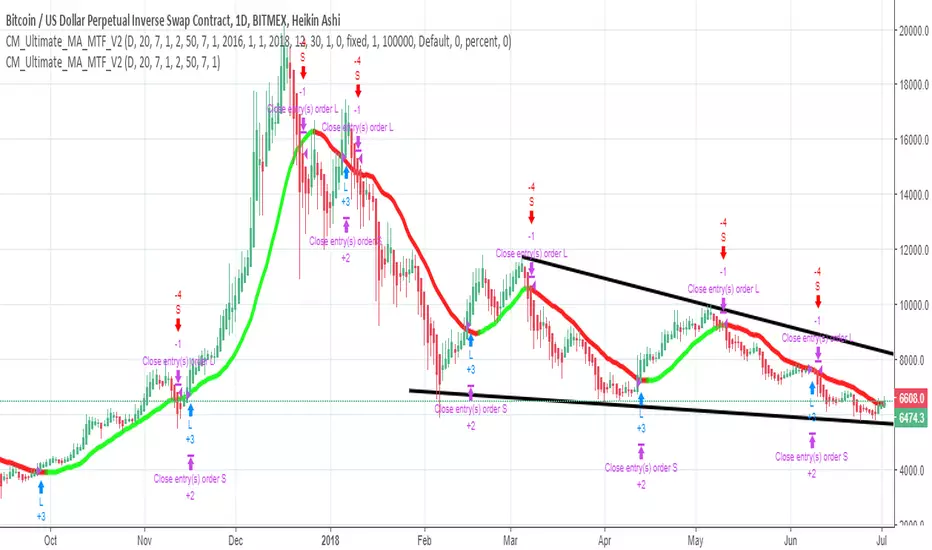
Following up on my first bot, I've tuned my algorithm to work with Bitcoin Cash. In order to get rid of these nasty (and sometimes costly) indecision points, I've just enabled the 'Recalculated After Order Fill' option, which... well, recalculates the algorithm on the spot (instead of waiting for 1 additional bar) for situations where a signal is immediately followed by a conflicting signal, effectively cancelling it out. Obviously you have to rely on your own judgement if that happens in a real world scenario. However, in this simulated environment, this change resulted in a 0% risk, whereas the gain exceeded 800% with an initial capital of $100'000.
Again, in order for the results to be as accurate as possible, I've averaged the date from all major exchanges.
All of this is free to use for you, and you are welcome to share it.
If you like it, please give me a follow on Trading View & Twitter.
If you have any requests or suggestions/concerns, please let me know!
Note:
- This algorithm works best for Heikn Ashi candles, but I'm working on improving it for normal candles
- This is not financial advice (I'm in chemistry, not finance), so do your own research
Mtrl_Scientist
Profit
Trend-Following Trade SignalsThis is a script that gives entries and exits for bitcoin, ran on 15 minute timeframe, backtested for position sizes of 1x initial capital. This script is not available to the public. Feel free to message me with inquires.


Power Penguin - Trend Trading AlertsThis is the alerts for automated trading for:
Power Penguin is a script that detects a trend and determines entry into the market based on the strength and price action.
Thanks to all my early backers for believing in my work!
This script is optimal for use in any market at this time.
To request a trial for this script, please PM me.
-----------------
Power Penguin V1.0.0
- Initial release

Power Penguin - Trend Trading Script BacktesterPower Penguin is a script that detects a trend and determines entry into the market based on the strength and price action.
Thanks to all my early backers for believing in my work!
This script is optimal for use in any market at this time.
To request a trial for this script, please PM me.
-----------------
Power Penguin V1.0.0
- Initial release

Series of Heikin ashi candle strategySeries of Heikin ashi candle strategy, idea and rules:
After 2 consecutive heikin ashi candles of same color, place a buy stop order at high of last candle if green or a sell stop order at low of last candle if red.
Strategy follows the open order with trailing stop.
Use on charts with heikin ashi candles.
Good on lower timeframes and scalping.
Please use comment section for any feedback.
Next improvment (only to who is interested to this script and follows me): study with alerts. Leave a comment if you want to have access to study.
SMA_CrossThis strategy is a variation of standard sma cross that comes as default with pine script
The idea is to NOT wait for a cross between fast and slow moving averages but to anticipate it considering the distance between the two MAs
Strategy can be used also for scalping, just need to be optimized for low tiime frames as 1 minute or 5 minute.
TIP: stay far from resistance and supports. I use my script "LCS/HCR Support and Resistance multi timeframes" to easily identify major supports
and resistance areas (note that I said areas and not lines).
Thanks to ChrisMoody: I used his code snippet for switching between various moving average types and calculation of TEMA and HULL ma.
Next improvements:
- money managment
- self optimization
- convert to study with alerts
This strategy is free to use but code is private. If you like or have question please use comment section.
Check also my other scripts at www.tradingview.com .
Thanks for your feedbaks.


MTF stochastic strategyThis strategy is based on MTF strategy found on Forex Factory forum and published by bobby2 (credits to him).
This is quite simple but need improvement to work properly:
1- it is made for 5 min chart
2- when 15min stochastic cross above 50 and 5min stochastic is rising, buy
3- when 15min stochastic cross below 50 and 5min stochastic is falling, sell

{CDT} v1.0 - Opal Signal - 1D H/A TunedHighly profitable script, decent on all timeframes but designed specifically for Heiken candles on 1D timeframe.
No repaint.
7 day free trials available on request.
----------------------------------------------
*Use at your own risk & DYOR.

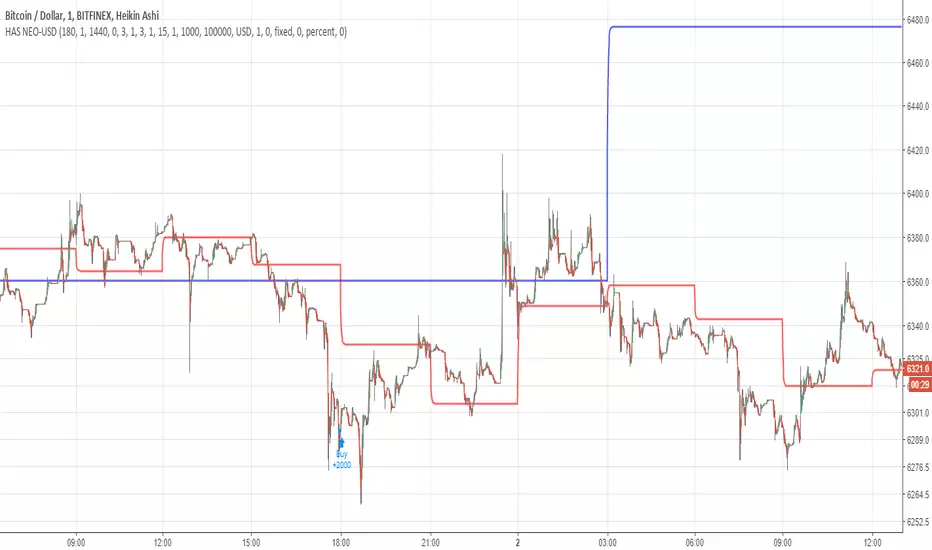
BTC-USD Strategy profit with cross basisHello all,
I modified a public script with long and short signals when the basis line is cross by Heikin Ashi.
It's a real-time script and not a scam. The profit is realized with one or two contracts.
You can add alerts and link it to robots for trade.
For access PM,
GaetanLpp
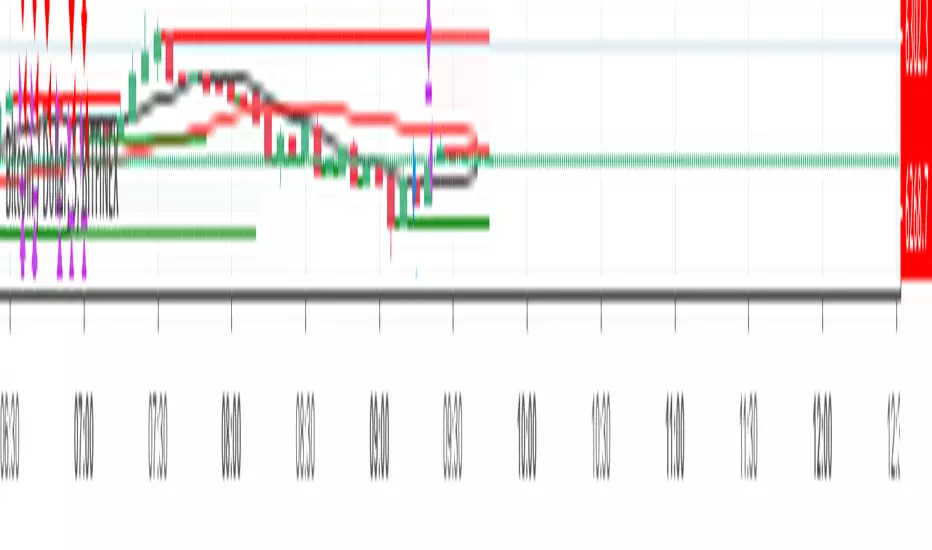
Has Indıcator Has indicator uses heiken ashi and macd (macd is custom)
works almost any cryptocurrency
1- 1min chart recommended
2- Use only USD pairs
3-Each trade is 10,000 USD
4-Comission is 0.13
Wave & Trend Accompanying Backtesting StrategyVersion 1.0
Purpose
This backtesting strategy indicator is a accompanying tool for use with my popular trading and alert indicator: Wave & Trend Autoview Advanced Indicator & Alerts
Reference Indicator Link:
Features
This strategy has been programmed to act exactly how the accompanying indicator would be used with an automated strategy such as Autoview or through manual trading
Has identical coloured signals with correct icons for reference with the indicators standard alert conditions (BUY/SELL)
The ability to toggle on or off all the logic and UI presets you could previously use to enhance the standard indicator
No short / longs for the most accurate representation of buys and sells, The strategy will keep buying on every optimal signal (+1 order quantity each time) and then sell all assets on a met sell condition (-all quantity), matching exactly how the reference indicator is used to buy/sell on eg. Binance and also give the most accurate statistics.
Fully customisable in the settings regarding trading strategy to match exactly how you have the reference indicator set up with alerts or how you are trading manually with it.
Ability to choose a timeframe, want to ignore the crypto boom at the latter stages of 2017? Sure you can, change the time frames in the settings to see a more recent representation of your trades.
Access
This indicator is free for existing owners of my Wave & Trend Indicator linked above as an accompanying tool to improve their strategy and net more profit. If you would like access to any of my indicators or would like to know more please find me on my community discord channel where you can find indicator details/documentation and general help:
Discord Link: discord.gg
Thank you for the immense support everyone, happy trading!
- Falco

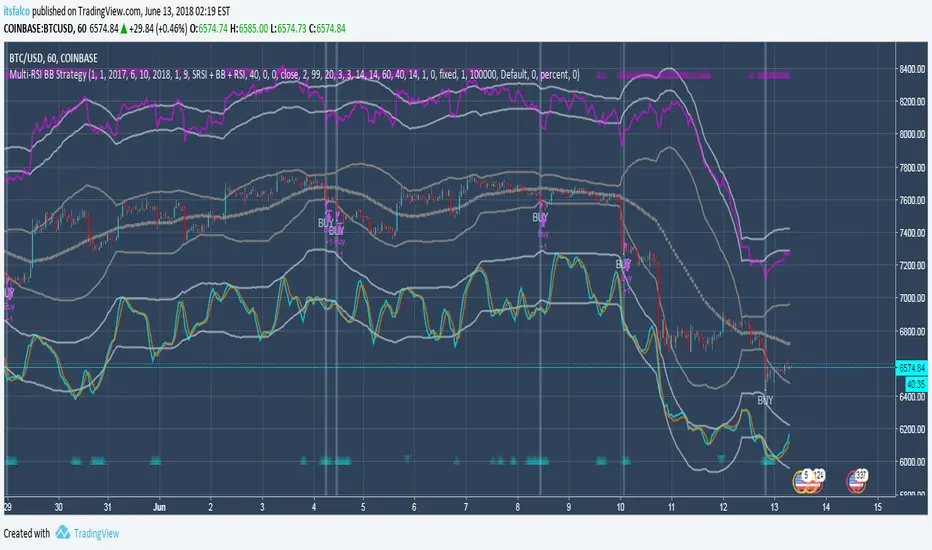
Multi-RSI BB Accompanying Backtesting StrategyVersion 1.0
Purpose
This backtesting strategy indicator is a accompanying tool for use with my popular trading and alert indicator: Multi RSI BB Fast Trader Autoview Alerts Indicator
Reference Indicator Link:
Features
This strategy has been programmed to act exactly how the accompanying indicator would be used with an automated strategy such as Autoview or through manual trading
Has identical coloured signals with correct icons for reference with the indicators standard alert conditions (BUY/SELL)
The ability to toggle on or off all the logic and UI presets you could previously use to enhance the standard indicator
No short / longs for the most accurate representation of buys and sells, The strategy will keep buying on every optimal signal (+1 order quantity each time) and then sell all assets on a met sell condition (-all quantity), matching exactly how the reference indicator is used to buy/sell on eg. Binance and also give the most accurate statistics.
Fully customisable in the settings regarding trading strategy to match exactly how you have the reference indicator set up with alerts or how you are trading manually with it.
Ability to choose a timeframe, want to ignore the crypto boom at the latter stages of 2017? Sure you can, change the time frames in the settings to see a more recent representation of your trades.
Access
This indicator is free for existing owners of my Multi RSI BB Indicator linked above as an accompanying tool to improve their strategy and net more profit. If you would like access to any of my indicators or would like to know more please find me on my community discord channel where you can find indicator details/documentation and general help:
Discord Link: discord.gg
Thank you for the immense support everyone, happy trading!
- Falco
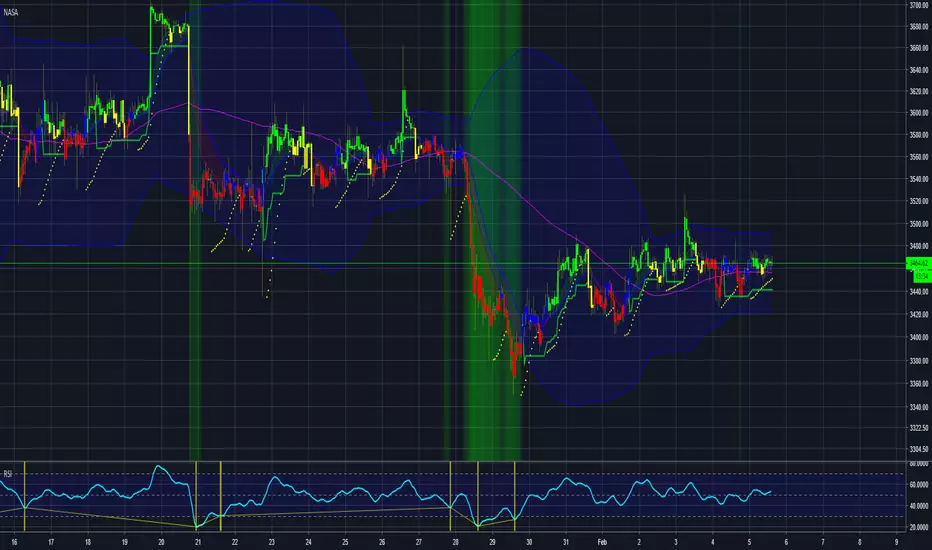
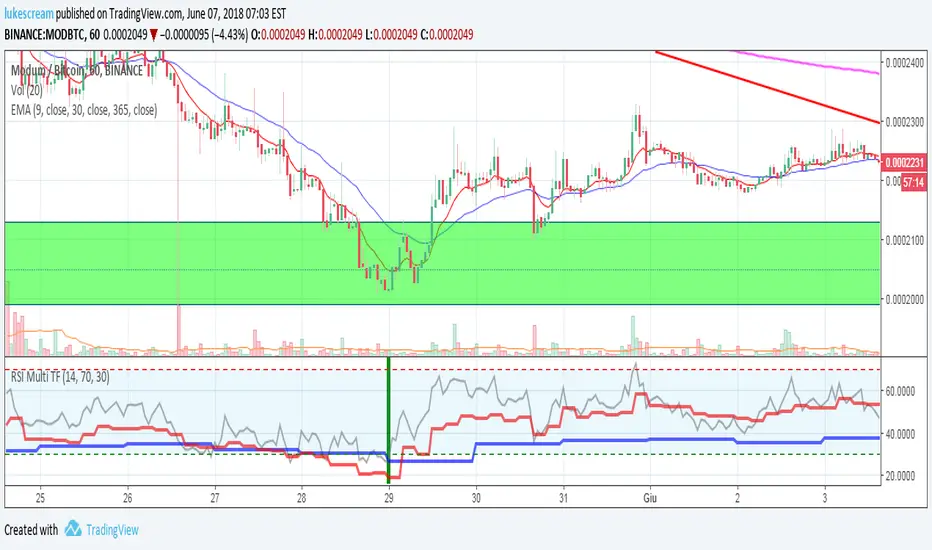
RSI Multi Time Frame - Spot Panic Sell Moments and profit!Union of three RSI indicators: 1h, 4h and daily. In order to show 1h RSI, you have to set it as active time frame on the chart.
Purpose: spot "triple oversold" moments, where all the three RSI are under the threshold, which is 30 by default but editable.
Target Market: Cryptocurrencies. Didn't try it on other ones, may work as well. Fits Crypto well as, by experience, I can tell it usually doesn't stay oversold for long.
When the market panics and triple oversold occurs, the spot is highlighted by a green vertical bar on the indicator.
The indicator highlights triple overbought conditions as well (usually indicating strong FOMO), but I usually don't use it as a signal.
I suggest to edit the oversold threshold in order to make it fit the coin you're studying, minimizing false positives.
Special thanks to Heavy91, a Discord user, for inspiring me in this indicator.
Any editing proposal is welcome!
I reposted this script, as the first time I wrote it in Italian. Sorry for that.
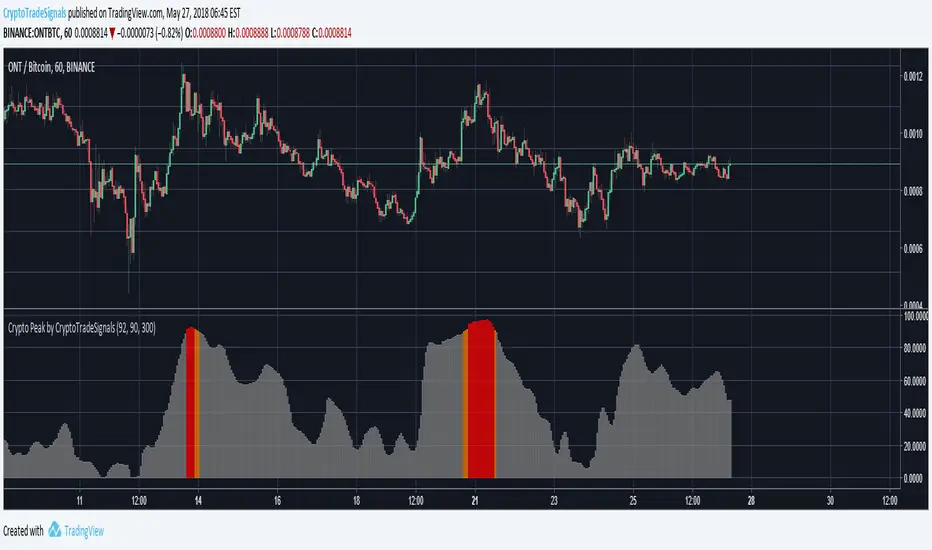
Crypto Peak by CryptoTradeSignalsRelease Notes:
1. AUTOMATED ALERTS: Staring at your phone all day? Get "Crypto Peak" alerts via email or via SMS (requires TradingView PRO Subscription).
2. CRYPTO PEAK SIGNAL: Not sure if a crypto has reached it’s “high point”? Identify the top of the market with this trading signal. When used in combination with the “Crypto Bottom Signal”, identifying the best points to “buy in” now becomes possible.
>>Get access to our Crypto Trading Indicators by visiting our website (please go to my main profile page or check the my signature)<<
My Intraday Predictor Systems for public use - Very reliablePresenting you all with one of my favorite reliable "Predictor engine" which can be used primarily for Intraday trading.
Background:
As like many, I am one of those who trade part time and so cannot stick my self in front of charts through out the day to identify reliable intraday patterns. May be I would have gone out for a meeting/break and come back to see that I missed a great intraday opportunity in a stock. So I started working on predicting next day's candle based on previous candle. By this way, I know on the end of the day, what I am going to trade tomorrow and at what price levels. So next day morning, I can place those orders once the market opens.
But predicting next day's candle was not that easy, I analyzed various indicators and kept studying them to see, when there is a big red/green candle, does the values of those indicator form a pattern for the previous day(s). Like this I studied a lot of indicators and finalized a set of few which gave reliable patterns.
Predictor System using MACD,RSI,Fisher Transform & KST indicators:
The one that is shared here is a combo of two predictor systems that I created using the above mentioned indicators. It actually analyzes the progressive nature of MACD and RSI to see the current trend, and it uses Fisher Transform and KST indicators to finalize the signal and remove false signals. The calculations in it are very complex and was developed with a lot of analysis and of course with trial and error method as well. Generally all of my predictive engines try to correlate one indicator with other to see where it squeezes well to create a reliable indicator. Most of my intraday calls are given using this indicator as well.
How to use this indicator:
A word of caution : Please note, this indicator is not one which can give guaranteed returns or with 100% success rate, and I havent seen any thing of that sort so far, so please don't believe in those and dont be surprised if this indicator fails for a few times. I have been using this indicator for quite some time and I have seen it creates close to 80% success rate.
Chart timeframe : 1 Day time period only. I have never used this indicator with any other time frame, and based on my best guess it wont work fine for anything lesser than 1D.
Stocks with which this indicator work well : Usually with high volume stocks and preferably with F&O stocks.
How to trade : At end of the day, keep all selected stocks in a watchlist, and open a chart with 1day time period. Add this indicator to the chart. Keep scrolling through all your favorite stocks (which are in watchlist) and see if this indicator signals (for current day) any double green/red arrows. If so, note down those and the stocks close price.
Once you scanned the entire watchlist and come up with the finalized stocks for which you found the signal for current day (i.e if you look at daily chart on end of 24th May, you should look for signals on 24th May candle). Just because there is a signal, please dont go short/long on the opening of next day market, wait for it go above/below 0.25% of the previous day's close. Or based on your risk appetite you can increase threshold percentage to more.
Once the stock hits the buy/sell price, try to book profits at levels of 0.75%, 1.2% and 1.67% of the buy/sell price. But based on the market trend you can adjust these numbers.
Refer the chart for more information.
Time limited :
As of now I am keeping this script as Invite-Only script with time limit, as this has come out of my years of hardwork and with a lot of patience and took a lot of effort. So I would like to share it only with those who are really interested and are capable intraday players. So please PM and I will give access to this script to you.

Crypto Trender StrategyBeta testing this strategy Version of Crypto Trender. Contact to become a part of this.
