RSI Rising Crypto Trending StrategyThis is crypto and stock market trending strategy designed for long timeframes such as 4h+
From my tests it looks like it works better to trade crypto against crypto than trading against fiat.
Indicators used:
RSI for rising/falling of the trend
BB sidemarket
ROC sidemarket
Rules for entry
For long: RSI values are rising, and bb and roc tells us we are not in a sidemarket
For long: RSI values are falling, and bb and roc tells us we are not in a sidemarket
Rules for exit
We exit when we receive an opposite direction.
Cuation: Because this strategy uses no risk management, I recommend you takje care with it.
If you have any questions, let me know !
מדד חוזק יחסי (RSI)

RSI Centered PivotsJust a simple RSI central pivot strategy I made for a friend.
Backtested on BYBIT:BTCUSD, 155m.
DISCLAIMER : Please do your own research into anything you use before using it to trade.

RSI Strategy with alerts via TradingConnector to ForexSoftware part of algotrading is simpler than you think. TradingView is a great place to do this actually. To present it, I'm publishing each of the default strategies you can find in Pinescript editor's "built-in" list with slight modification - I'm only adding 2 lines of code, which will trigger alerts, ready to be forwarded to your broker via TradingConnector and instantly executed there. Alerts added in this script: 12 and 17.
How it works:
1. TradingView alert fires.
2. TradingConnector catches it and forwards to MetaTrader4/5 you got from your broker.
3. Trade gets executed inside MetaTrader within 1 second of fired alert.
When configuring alert, make sure to select "alert() function calls only" in CreateAlert popup. One alert per ticker is required.
Adding stop-loss, take-profit, trailing-stop, break-even or executing pending orders is also possible. These topics have been covered in other example posts.
This routing works for Forex, indices, stocks, crypto - anything your broker offers via their MetaTrader4 or 5.
Disclaimer: This concept is presented for educational purposes only. Profitable results of trading this strategy are not guaranteed even if the backtest suggests so. By no means this post can be considered a trading advice. You trade at your own risk.
If you are thinking to execute this particular strategy, make sure to find the instrument, settings and timeframe which you like most. You can do this by your own research only.

Forex Scalping 1min Bollinger Bands, RSI and ADX Trading SystemThis is a Forex Scalping Trading Sytem based on the Bollinger Bands.
Its suited for major pairs, with lowest possible comission (below 1 pip) and with timeframes ranging between 1-15 min.
Indicators:
Bollinger bands
ADX
RSI
Rules for entry:
Long Entry: price to move below the upper Bollinger Bands RSI raise above the 30 line and ADX<32 at the same time.
Short Entry: price to move above the upper Bollinger Bands, RSI raise below the 70 line and ADX<32 at the same time.
Rules for exit
Profit Exit: 3 options: 1, exit position when the price touches the middle band, 2) when the price touches the opposite band, X pips target profit.
Loss Exit: X pips loss

Strategy TemplateThis is the fastest way to create a Trading View strategy. The template I have created includes stoploss and take profit enabling and plotting, date range, and strategy buy and sell conditions. I believe this will benefit the people in the Trading View community by creating a strategy faster and more efficiently than just repeating pine script code. All that needs to be done by the person using this script is to add their own indicators, and create their own buy and sell signals. Then they can immediately start back testing their new strategy!
Crypto swing correlation RSI and SMAThis is a crypto swing strategy, designed for long term periods and correlated pairs with crypto market total(or other coins used as correlation, however I recommend total of crypto or btc)
Its components are:
RSI with a very length
Correlation candles
SMA 9
Rules for entry:
For long : RSI is above 51 level and going higher and close of the candle is above the SMA
For short :RSI is below 49 and going lower and close of the candle is below the SMA
Rules for exit:
We exit when we encountered an opposite condition than the entry one, or based on take profit/stop loss levels.
If you have any questions let me know !

Zendog V2 backtest DCA bot 3commasHi everyone,
After a few iterations and additional implemented features this version of the Backtester is now open source.
The Strategy is a Backtester for 3commas DCA bots. The main usage scenario is to plugin your external indicator, and backtest it using different DCA settings.
Before using this script please make sure you read these explanations and make sure you understand how it works.
Features:
- Because of Tradingview limitations on how orders are grouped into Trades, this Strategy statistics are calculated by the script, so please ignore the Strategy Tester statistics completely
Statistics Table explained:
- Status: either all deals are closed or there is a deal still running, in which case additional info
is provided below, as when the deal started, current PnL, current SO
- Finished deals: Total number of closed deals both Winning and Losing.
A deal is comprised as the Base Order (BO) + all Safety Orders (SO) related to that deal, so this number
will be different than the Strategy Tester List of Trades
- Winning Deals: Deal ended in profit
- Losing deals: Deals ended with loss due to Stop Loss. In the future I might add a Deal Stop condition to
the script, so that will count towards this number as well.
- Total days ( Max / Avg days in Deal ):
Total Days in the Backtest given by either Tradingview limitation on the number of candles or by the
config of the script regarding "Limit Date Range".
Max Days spent in a deal + which period this happened.
Avg days spent in a deal.
- Required capital: This is the total capital required to run the Backtester and it is automatically calculated by
the script taking into consideration BO size, SO size, SO volume scale. This should be the same as 3commas.
This number overwrites strategy.initial_capital and is used to calculate Profit and other stats, so you don't need
to update strategy.initial_capital every time you change BO/SO settings
- Profit after commission
- Buy and Hold return: The PnL that could have been obtained by buying at the close of the first candle of the
backtester and selling at the last.
- Covered deviation: The % of price move from initial BO order covered by SO settings
- Max Deviation: Biggest market % price move vs BO price, in the other direction (for long
is down, for short it is up)
- Max Drawdown: Biggest market % price move vs Avg price of the whole Trade (BO + any SO), in the other
direction (for long price goes down, for short it goes up)
This is calculated for the whole Trade so it is different than List of Trades
- Max / Avg bars in deal
- Total volume / Commission calculated by the strategy. For correct commission please set Commission in the
Inputs Tab and you may ignore Properties Tab
- Close stats for deals: This is a list of how many Trades were closed at each step, including Stop Loss (if
configured), together with covered deviation for that step, the number of deals, and the percentage of this
number from all the deals
TODO: Might add deal avg value for each step
- Settings Table that can be enabled / disabled just to have an overview of your configs on the chart, this is a
drawn on bottom left
- Steps Table similar to 3commas, this is also drawn on bottom left, so please disable Settings table if you want
to see this one
TODO: Might add extra stats here
- Deal start condition: built in RSI-7 or plugin any external indicator and compare with any value the indicator plots
(main purpose of this strategy is to connect your own studies, so using external indicator is recommended)
- Base order and safety orders configs similar to 3commas (order size, percent deviation, safety orders,
percent scale and volume scale)
- Long and Short
- Stop Loss
- Support for Take profit from base order or from Total volume of the deal
- Configs help (besides self explanatory):
- Chart theme: Adjust according to the theme you run on. There is no way to detect theme at the moment.
This adjust different colors
- Deal Start Type: Either a builtin RSI7 or "External indicator"
- Indicator Source an value: If using External Indicator then select source, comparison and value.
For example you could start a deal when Volume is greater than xxxx, or code a custom indicator that plots
different values based on your conditions and test those values
- Visuals / Decimals for display: Adjust according to your symbol
- BO Entry Price for steps table: This is the BO start deal price used to calculate the steps in the table

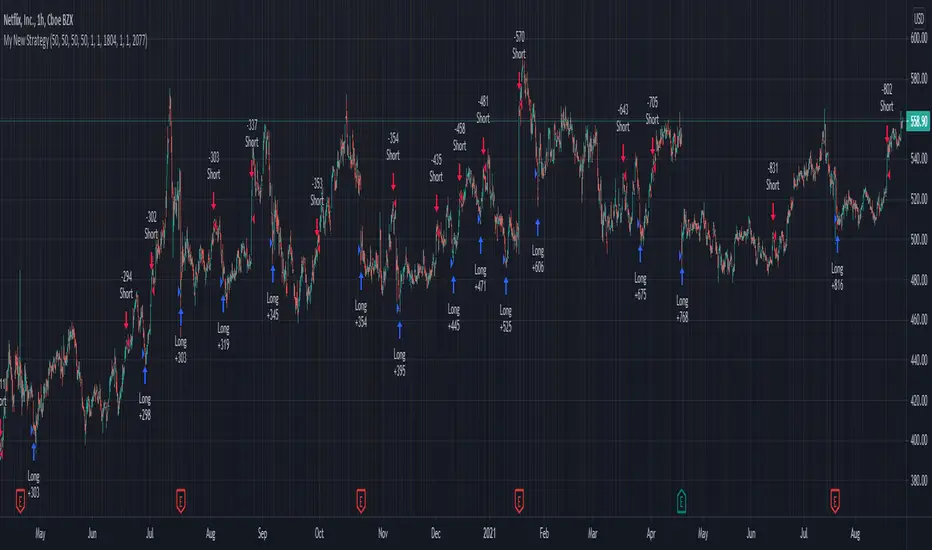
[VJ]Phoenix Force of PSAR +MACD +RSIThis is a simple intraday strategy for working on Stocks or commodities based out on PSAR, MACD , RSI and chop index . You can modify the start time and end time based on your timezones. Session value should be from market start to the time you want to square-off
Important: The end time should be at least 2 minutes before the intraday square-off time set by your broker
Comment below if you get good returns
Strategy: Entry Exits using PSAR and momentum and trend using MACD and RSI. A chop index is used as filtering
Indicators used :
Parabolic SAR is a technical indicator that is used to determine the price direction of stocks and it also draws attention to the traders when the price is changing
PSAR helps you:
Identify when a certain price trend is going to change direction
Indicate the most effective level at which to enter into the trade
Indicate the most effective exit point for the trade
Moving average convergence divergence (MACD) is a trend-following momentum indicator that shows the relationship between two moving averages of a security's price. ... Traders may buy the security when the MACD crosses above its signal line and sell—or short—the security when the MACD crosses below the signal line
RSI is intended to chart the current and historical strength or weakness of a stock or market based on the closing prices of a recent trading period.
Buying/Selling
When trading with the parabolic SAR, you would buy a market when the dots move below the current asset price and are green in colour. Alternatively, you would sell a market when the dots move above the current asset price and are red in colour. We use MACD , RSI to ensure that a right trade is picked when PSAR gives an indication. CI is used to stay away from the range bound market as much as possible.
Usage & Best setting :
Choose a good volatile stock and a time frame - 5m.
MA length : 200
RSI threshold : 50
MACD: 12,26,9
There is stop loss and take profit that can be used to optimise your trade
The template also includes daily square off based on your time.

QuickSilver Intraday using RSIThis is a simple intraday strategy using very basic intraday super indicators - RSI & VWAP for working on Stocks . You can modify the values on the stock and see what are your best picks. Comment below if you found something with good returns
Strategy:
Indicators used :
The Relative Strength Index (RSI) is one of the most popular and widely used momentum oscillators.The values of the RSI oscillator, typically measured over a 14-day period, fluctuate between zero and 100. The Relative Strength Index indicates oversold market conditions when below 30 and overbought market conditions when above 70
VWAP identifies the true average price of a stock by factoring the volume of transactions at a specific price point and not based on the closing price. VWAP can add more value than your standard 10, 50, or 200 moving average indicators because VWAP reacts to price movements based on the volume during a given period.
Buying happens at VWAP Breakouts which is then validated with RSI to check for overbought & oversold conditions.
Aggressive trade stop can be employed by using the % for long and shorts in the strategy.
Usage & Best setting :
Choose a good volatile stock and a time frame - 10m.
RSI : 9
Overbought & Oversold - can be varied as per user
There is stop loss and take profit that can be used to optimise your trade
Extending this to,
In general guidelines for RSI :
Short-term intraday traders (day trading) often use lower settings with periods in the range of 9-11.
Medium-term swing traders frequently use the default period setting of 14.
Longer-term position traders often set it at a higher period, in the range of 20-30.
The template also includes daily square off based on your time.

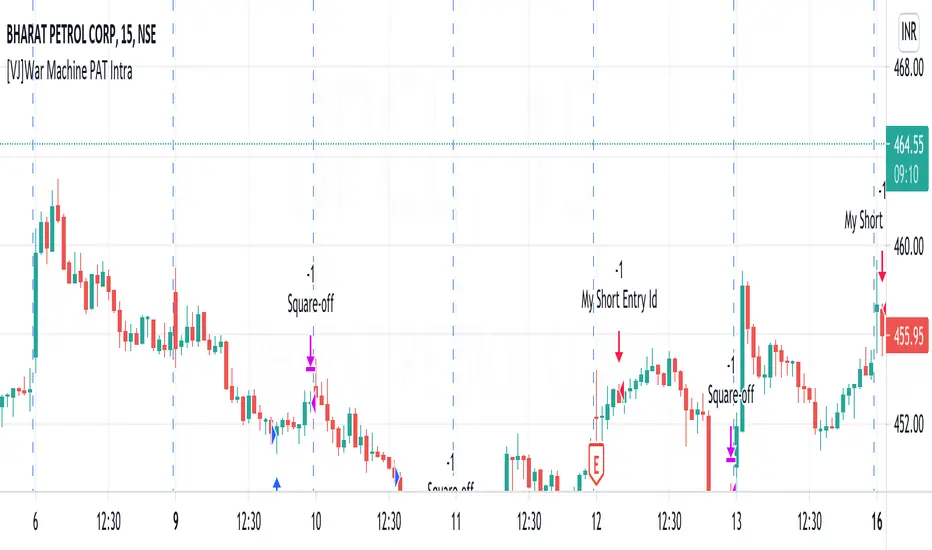
[VJ]War Machine PAT IntraThis is a simple intraday strategy for working on Stocks . You can modify the values on the stock and see what are your best picks. Comment below if you found something with good returns
Strategy:
Indicators used :
The Choppiness Index is designed to determine whether the market is choppy or trading sideways, or not choppy and trading within a trend in either direction. Using a scale from 1 - 100, the market is considered to be choppy as values near 100 (over 61.80) and trending when values are lower than 38.20)
The Money Flow Index (MFI) is a momentum indicator that measures the flow of money into and out of a security over a specified period of time. It is related to the Relative Strength Index (RSI) but incorporates volume, whereas the RSI only considers price. The MFI is calculated by accumulating positive and negative Money Flow values (see Money Flow), then creating a Money Ratio. The Money Ratio is then normalized into the MFI oscillator form.
Using the combination of CI (trend factor as constant) and varying MFI, we can buy/sell when conditions are met
Buying with MFI
1. MFI drops below 20 and enters inside oversold zone.
2. MFI bounces back above 20.
3. MFI pulls back but remains above 20.
4. A MFI break out above its previous high is a good buy signal.
Selling with MFI
1. MFI rises above 80 and enters inside overbought zone.
2. MFI drops back below 80.
3. MFI rises slightly but remains below 80.
4. MFI drops lower than its previous low is a signal to short sell or profit booking
Usage & Best setting :
Choose a good volatile stock and a time frame - 5m.
Trending factor : 50
Overbought & Oversold - can be varied as per user
There is stop loss and take profit that can be used to optimise your trade
The template also includes daily square off based on your time.
Combo Backtest 123 Reversal & RSIThis is combo strategies for get a cumulative signal.
First strategy
This System was created from the Book "How I Tripled My Money In The
Futures Market" by Ulf Jensen, Page 183. This is reverse type of strategies.
The strategy buys at market, if close price is higher than the previous close
during 2 days and the meaning of 9-days Stochastic Slow Oscillator is lower than 50.
The strategy sells at market, if close price is lower than the previous close price
during 2 days and the meaning of 9-days Stochastic Fast Oscillator is higher than 50.
Second strategy
The RSI is a very popular indicator that follows price activity.
It calculates an average of the positive net changes, and an average
of the negative net changes in the most recent bars, and it determines
the ratio between these averages. The result is expressed as a number
between 0 and 100. Commonly it is said that if the RSI has a low value,
for example 30 or under, the symbol is oversold. And if the RSI has a
high value, 70 for example, the symbol is overbought.
WARNING:
- For purpose educate only
- This script to change bars colors.

Crypto RSI with RVI StrategyThis is a long only strategy adapted for crypto market.
Its idea is to take the most juice out of a long trend and cut the losses as soon as possible.
For this , its components are RSI with a very big length - 100 or 200 preferably and RVI.
Rules for entry
If RVI is in the buy zone and we have a crossover from RSI with the overbought level.
Rules for exit
With change condition : If RVI is in the sell zone and we have a cross under from RSI with the oversold level.
With stop loss : we have a SL based on movement in % of the price, recommendable between 5-10%.
If you have any questions let me know !

Ichimoku + RSI Crypto trending strategyThis is a crypto trending strategy designed for big timeframes such as 3-4h+.
Its components are:
RSI
ICHIMOKU full pack
Heikin Ashi candles for logic calculation inside
Rules for entry.
For long : we have a long cross condition on ichimoku and price is above the ichimoku lines, and at the same time RSI value is > 50.
For long : we have a short cross condition on ichimoku and price is below the ichimoku lines, and at the same time RSI value is < 50.
Rules for exit
We exit whenever we receive an opposite signal of the initial entry.
SInce this strategy is using no risk management inside, I recommend to be careful with it .
If you have any questions, let me know !

BTC Sentiment analysis RSI 2xEMAThis is a CRYPTO correlation strategy, which is using BTC sentiment with BITFINEX long and short ratios.
WIth them we are making from one side 2 RSI, one for long and another for short. And from another side, we are going to make multiple EMA's, using the ratios for long and short.
Rules for entry
For this scenario I created a long only strategy.
The long entry condition is : we have a crossover of the rsi long ratio with rsi short ratio and long ratio from BITFINEX is above the long EMA and short ratio from BITFINEX is below short EMA.
We exit when we get the opposite condition, in this case we have a crossunder of the rsi long ratio with rsi short ratio and long ratio from BITFINEX is below the long EMA and short ratio from BITFINEX is above short EMA.
If you have any questions, let me know !

3 RSI 6sma/ema ribbon crypto strategyThis is a very efficient swing trading strategy designed for crypto long timeframes like 2h+.
Initially we have 3 RSI .
AFter that we use them as source for 6 SMA/EMA for each RSI, 5, 30, 50, 70, 90, 100. With those we create a ribbon that we are going to use in order to check the direction of the trend.
Rules for entry:
For long : if either all the SMA/EMA's from the 2nd RSI are telling us to go long, or all the all SMA/EMA's from the 3rd rsi are telling us to go long F
For short : if either all the SMA/EMA's from the 2nd RSI are telling us to go short, or all the all SMA/EMA's from the 3rd rsi are telling us to go short
We exit when we get an opposite condition than the entry one.
Caution: this strategy has no risk management inside, so use it with caution. If you have any questions , let me know !

Combo Backtest 123 Reversal & Stochastic RSIThis is combo strategies for get a cumulative signal.
First strategy
This System was created from the Book "How I Tripled My Money In The
Futures Market" by Ulf Jensen, Page 183. This is reverse type of strategies.
The strategy buys at market, if close price is higher than the previous close
during 2 days and the meaning of 9-days Stochastic Slow Oscillator is lower than 50.
The strategy sells at market, if close price is lower than the previous close price
during 2 days and the meaning of 9-days Stochastic Fast Oscillator is higher than 50.
Second strategy
This strategy used to calculate the Stochastic RSI
WARNING:
- For purpose educate only
- This script to change bars colors.
Delayed RSI StrategyThis strategy uses a 21 period RSI with an overbought (RSI indicator
is greater than) level of 60 (user defined) to determines long entries and an oversold
(RSI indicator is less than) level of 40 (user defined) for shorts. It introduces a bar delay that starts
counting when the RSI < Oversold or RSI > Overbought conditions are true, delaying the entry with
the amount of bars determined by the user. The trading logic can be reversed, which seems to work better.

HYE Combo Market [Strategy] (Vwap Mean Reversion + Trend Hunter)In this strategy, I used a combination of trend hunter and vwap mean reversion strategies that I published before.
Trend Hunter Strategy:
Mean Reversion Vwap Strategy:
The results are quite impressive, especially for bitcoin.
While the hodl return for bitcoin was 13419%, the strategy's return in the same period was about 5 times (65000%) of this.
s3.tradingview.com
In this combo strategy, I made some changes to the original settings of the strategies used together and added some more new features.
Trend Hunter Strategy Settings: (Original / Combo)
- Slow Tenkansen Period : 9 / 9
- Slow Kijunsen Period : 26 / 13
- Fast Tenkansen Period : 5 / 3
- Fast Kijunsen Period : 13 / 7
- BB Length : 20 / 20
- BB Stdev : 2 / 2
- TSV Length : 13 / 20
- TSV Ema Length : 7 / 7
* I also added a "vidya moving average" to be used as a confirmation tool to open a long position. (Candle close must be above the vidya line.)
Vwap Mean Reversion Strategy Settings: (Original / Combo)
- Small Vwap : 2 / 8
- Big Vwap : 5 / 10
- Percent Below to Buy : 3 / 2
- RSI Period : 2 / 2
- RSI Ema Period : 5 / 5
- Maximum RSI Level for Buy : 30
* I also added a "mean vwap line" to be used for exits in this part of the strategy. In the original version, when small vwap crossovers big vwap, we close the position, but in this strategy we will wait for the close above the mean vwap.
TIPS AND WARNINGS
1-) The standard settings of this combo strategy is designed and tested with daily timeframe. For lower timeframes, you should change the strategy settings and find the best value for yourself.
2-) Only the mean vwap line is displayed on the graph. For a detailed view, you can delete the "//" marks from the plot codes in the strategy code.
3-) This is a strategy for educational and experimental purposes. It cannot be considered as investment advice. You should be careful and make your own risk assessment when opening real market trades using this strategy.
________________________________________________________
Bu stratejide, daha önce yayınladığım trend avcısı ve vwap ortalamaya geri dönüş stratejilerinin bir kombinasyonunu kullandım.
Sonuçlar özellikle bitcoin için oldukça etkileyici.
Bitcoin için hodl getirisi %13419 iken, stratejinin aynı dönemdeki getirisi bunun yaklaşık 5 katı (%65000) idi.
Bu kombo stratejide, birlikte kullanılan stratejilerin orijinal ayarlarında bazı değişiklikler yaptım ve bazı yeni özellikler ekledim.
Trend Avcısı Strateji Ayarları: (Orijinal / Combo)
- Yavaş Tenkansen Periyodu : 9 / 9
- Yavaş Kijunsen Periyodu : 26 / 13
- Hızlı Tenkansen Periyodu : 5 / 3
- Hızlı Kijunsen Periyodu : 13 / 7
- BB Uzunluğu : 20 / 20
- BB Standart Sapması : 2 / 2
- TSV Uzunluğu : 13 / 20
- TSV Ema Uzunluğu : 7 / 7
* Ayrıca long pozisyon açmak için onay aracı olarak kullanılmak üzere "vidya hareketli ortalama" ekledim. (Mum kapanışı vidya çizgisinin üzerinde olmalıdır.)
Vwap Ortalamaya Dönüş Stratejisi Ayarları: (Orijinal / Combo)
- Küçük Vwap : 2 / 8
- Büyük Vwap : 5 / 10
- Alış İçin Gerekli Fark Oranı : 3 / 2
- RSI Periyodu : 2 / 2
- RSI Ema Periyodu: 5 / 5
- Alış için gerekli maksimum RSI seviyesi : 30
* Stratejinin bu bölümünde pozisyondan çıkışlar için kullanılacak bir "ortalama vwap çizgisi" de ekledim. Orijinal versiyonda, küçük vwap, büyük vwap'ı yukarı kestiğinde pozisyonu kapatıyoruz, ancak bu stratejide, ortalama vwap'ın üzerindeki kapanışı bekleyeceğiz.
İPUÇLARI VE UYARILAR
1-) Bu birleşik stratejinin standart ayarları, günlük zaman dilimi ile tasarlanmış ve test edilmiştir. Daha düşük zaman dilimleri için strateji ayarlarını değiştirmeli ve kendiniz için en iyi değeri bulmalısınız.
2-) Grafikte sadece ortalama vwap çizgisi görüntülenir. Ayrıntılı bir görünüm için strateji kodundaki "plot" ile başlayan satırlarda grafikte görünmesini istediğiniz özelliğin önündeki "//" işaretlerini silebilirsiniz.
3-) Eğitim ve deneysel amaçlı bir stratejidir. Yatırım tavsiyesi olarak değerlendirilemez. Bu stratejiyi kullanarak gerçek piyasa işlem açarken dikkatli olmalı ve kendi risk değerlendirmenizi yapmalısınız.

7-RSI strategyHello, I've only been trying to learn PineScript for two months on my own, here I am posting a version of the strategy for a grid bot with 20 orders, order size 5%, earlier I tried to find something similar, but could not. Perhaps others, those who, like me, are just starting to learn PineScript, will find something useful. In the process of using grid bots, I noticed that the RSI indicator is sufficient, so the strategy uses 7 RSI indicators on different timeframes, but it is not necessary to use all 7, usually 3 is enough, therefore, by default, the RSI values are set to limit so that there is no effect on the settings of others. The step between bot orders is set in the settings. The code can of course be simplified, but it's better for understanding, I think.

ADX / RSI Strategy by Trade Rush (created by SirPoggy) This is one of many new strategies coming soon which were seen on Trade Rush
This one is the ADX / RSI Strategy seen here:
https:www.youtube.com/watch?v=uSkGE0ujyn4
While the strategy has been modified slightly to use the DMI instead of the ADX, the core of the strategy is essentially the same
Long signals are generated when the RSI is above 70, close is above the 200EMA, and the ADX is above 25 (added is the plus DMI over 25 and minus DMI below 20)
Stop loss is placed below /above the 21 EMA, however, there is a deviation required to ensure price is not too close to where a stop loss would be placed.
Short signals are generated when the RSI is below 30, close is below the 200EMA, and the ADX is above 25 (added is the minus DMI over 25 and plus DMI below 20)
I do not recommend using this strategy but I have provided this code for educational purposes.
Thanks!
Let me know which strategy you'd like coded next in the comments below.

Double Bollinger StrategyFrom "Bitcoin Trading Strategies: Algorithmic Trading Strategies For Bitcoin And Cryptocurrency That Work" by David Hanson.
*Works better with 1hr time frame and some input optimisations.
"Double Bollinger Band Scalping System
Recommended Timeframe: 1 minute or 5 minute *
Required Indicators:
// - RSI with a length of 14 (default settings)
// - Bollinger band #1 settings: Length = 50, stDev = 1 Hide the basis/middle line (basis line not needed for this strategy)
Note: This is the slower bollinger band in the directions
// - Bollinger band #2 settings: Length 20, stDev = 1 Hide the basis/middle line (basis line not needed for this strategy)
Note: This is the faster bollinger band in the directions
Enter Long/Buy Trade When:
// - RSI is above the level 50
// - A candle closes above the top of the faster bollinger band
Enter a long when a candle then closes above the top of the slower bollinger band, and price is above the top of both bands
Place a stop loss under the low of the entry candle Example of a long trade using this strategy
Exit Long Trade When: A candle closes below the top band of the fast bollinger band
Enter Short/Sell Trade When:
// - RSI is below the level 50
// - A candle closes below the bottom of the faster bollinger band
Enter a short when a candle then closes below the bottom of the slower bollinger band, and price is below both bands
Place a stop loss above the high of the entry candle Example of a short trade using this strategy
Exit Short Trade When: Price closes inside the bottom of the faster bollinger band"

Combo Backtest 123 Reversal & Smoothed RSIThis is combo strategies for get a cumulative signal.
First strategy
This System was created from the Book "How I Tripled My Money In The
Futures Market" by Ulf Jensen, Page 183. This is reverse type of strategies.
The strategy buys at market, if close price is higher than the previous close
during 2 days and the meaning of 9-days Stochastic Slow Oscillator is lower than 50.
The strategy sells at market, if close price is lower than the previous close price
during 2 days and the meaning of 9-days Stochastic Fast Oscillator is higher than 50.
Second strategy
This is new version of RSI oscillator indicator, developed by John Ehlers.
The main advantage of his way of enhancing the RSI indicator is smoothing
with minimum of lag penalty.
WARNING:
- For purpose educate only
- This script to change bars colors.
ADX + RSI Strat// This is a strategy that uses the 7 Period RSI to buy when the indicator is shown as oversold (OS) and sells when
// the index marks overbought (OB). It also uses the ADX to determine whether the trend is ranging or trending
// and filters out the trending trades. Seems to work better for automated trading when the logic is inversed (buying OB
// and selling the OS) wihout stop loss.
