Stochastic RSI with DivergencesThis indicator is Stochastic RSI using code loops* rather than pivot low/high functions.
The pivot low/high function provided by Pine Script requires a set number of bars to pass prior to locating a swing low/high.
This can mean large moves have occurred prior to a swing low having passed if the lookback range was set to five bars (5).
5 bars on a 2 hour chart is a long time and large moves may be missed.
As I don't use these functions, there is no requirement for a set number of bars to have passed prior to swing low/high positions to be identified.
This means it doesn't rely on a set number of bars to pass prior to finding a new pivot point.
* Code loops are a function which will check conditions in a range until a defined condition is met.
In this case a pivot low is a bar with no lower bars within 3 bars either side of the current checked bar.
Additional:
Lines will redraw and delete previous divergences to remove clutter on the indicator.
A table cells for alternate timeframe Stochastic RSI values so you don't need to swap between charts constantly.
How it works:
The first lookback finds an initial low/high within a small range of the current bar. (default of 10)
This low/high must be the lowest/highest point within 3 bars either side.
The second low/high must be over 5 bars prior to the recent low and a max range of previous lookback. (default of 30)
This low/high must be the lowest/highest point within 3 bars either side.
If a divergence is found, it will draw the divergence on the indicator and delete the prior line drawn.
Personal note:
Personally coded functions for my personal use, though others may find use with it.
Rsi_divergence

Comparison with BTC (RSI)显示当前品种与BTC汇率对的RSI值
以此判断强势或弱势品种以及超买超卖
——————————
Display the RSI value of the exchange rate between the current variety and BTC
Use this to determine strong or weak varieties, as well as overbought and oversold

RSI Trending with DivergencesThis script uses the RSI and RSI divergences to mark signals where the rsi is both below/above the 50, below/above its moving average, and where the last regular or hidden divergence matches that state. The RSI is built into the indicator, so you don't need it in your bottom pane if you don't want it, I just put one there for illustrative purposes. Please note it will not print the same signal consecutively, as it is meant to show an overall direction, not the in and out fluctuations. I suggest using it in conjunction with some moving averages so you can ignore signals not in the trend.
RSI Screener and Divergence [5ema]
Displayed on the RSI chart according to a custom timeframe.
Displays the RSI tracking table of various timeframes.
Identify normal divergence, hidden divergence on RSI chat.
Show buy and sell signals (strong, weak) on the board.
Send notifications when RSI has a buy or sell signal.
-----
I reused some functions, made by (i believe that):
©paaax : The table position function.
@everget : The RSI divergence function.
@QuantNomad : The function calculated value and array to show on table for input symbols.
I have commented in my code. Thanks so much!
-----
How it works:
1. Input :
input.int length of RSI => calculate RSI.
input.int upper/lower => checking RSI overbought/oversold.
input.int right bars / left bars => returns price of the pivot low & high point => checking divergence.
input.int range upper / lower bars => compare the low & high point => checking divergence.
input.timeframe => request.security another time frame.
input.string table position => display screener table.
2. Input bool:
plot RSI on chart.
Plot Regular Bullish divergence .
Regular Bearish divergence.
Hidden Bullish divergence .
Hidden Bearish divergence.
3. Basic calculated:
Make function for RSI , pivot low & high point of RSI and price.
Request.security that function for earch time frame.
Result RSI, Divergence.
4. Condition of signal:
Buy condition:
RSI oversold (1)
Bullish divergence (2).
=> Buy if (1) and (2), review buy (1) or (2).
Sell condition:
RSI overbought (3).
Bearish divergence (4).
=> Sell if (3) and (4), review sell (3) or (4).
5. Table screener:
Time frame.
RSI (green - oversold, red - overbought)
Divergence (⬈⬈ - regular bullish , ⬊⬊ regular bearish , ⬊ - hidden bullish , ⬈ - hidden bearish ).
Signal (🟢 - Buy, 🔴 - sell, green 〇 - review buy, red 〇 - review sell)
----
This indicator is for reference only, you need your own method and strategy.
If you have any questions, please let me know in the comments.

Multiple Divergences - Candle Edition - Libertus█ OVERVIEW
This script will help you track multiple indicator divergences in an easy, clean, and very visible way. Currently supported indicators at the time of script publishing are the Relative strength index (RSI) and On balance volume (OBV). If you have suggestions on which other popular indicators to add, leave them in the comments or message me directly.
You can track divergences manually, but it's time-consuming, you can easily miss them and if you want to track it on more than one indicator it will consume a lot of your screen space.
The script is using my time-tested divergences code, loved by a lot of TradingView users. If you want to use RSI divergences code in your scripts, you can find it in my Relative Strength Index - Divergences - Libertus indicator .
This script continues to improve on my popular RSI Divergences - Candle Edition - Libertus .
█ USAGE
In short, divergences occur between price and indicator. When the price makes a new high or low, but the indicator doesn't make a new high or low. Please check Investopedia for a more detailed explanation of RSI and OBV divergences.
BULL marks bullish divergence, which means the price made a new low, but the indicator value still hasn't made a new low. It can indicate a bullish trend change.
BEAR marks bearish divergences, which means the price made a new high, but the indicator value still hasn't made a new high. It can indicate a bearish trend change.
PIVOT is the highest or lowest price (candle) in the lookback period.
ALERTS are available for all PIVOTS and divergences, including candles with multiple divergences.
█ SETTINGS
HIDE PIVOT - ON by default, hides pivots.
SHORTER LABELS - OFF by default, removes text from BEAR / BULL labels.
HIDE LABELS AND COLOR BACKGROUND - OFF by default, hides labels completely and colors chart background.
LOOKBACK PERIODS - number of candles script will check in history for the pivot.
Hopefully, this indicator will help you in your trading. Good luck!

{20}Dashboard RSI-trendlines_Pro[vn]👉 Here is a script of 20 trading pairs scanner with RSI trendline.
-On each chart of the trading pair, there is only 1 trendline pair that comes closest to the RSI: 1 uptrendline and 1 downtrend line.
-So when the statistics on the table also show the column of the uptrend and the column of the downtrend
-When the RSI approaches any trendline and the ratio is 10%, the trendline will be colored blue (downtrend) and red (uptrend).
-Column ✎ T.line-trendline above (✐ T.line-trendline below) is the value of the current trendline compared to RSI
-Column \𝖗𝖊𝖘𝖎𝖘𝖙𝖆𝖓(𝖘𝖚𝖕𝖕𝖔𝖗𝖙 \══════) when RSI breaks trendline will show 1|1|1 ( first candle) and percentage value when breaking through the point of the trendline. This is a good signal for us to consider trading with the RSI line
-The parameter when breaking shows 10|10|10, it means that the price has broken 10 candles (RSI candles), and the first 10 candles are colored yellow, then it will be
hidden. (can be changed in settings) put)
-Also, when displaying the parameters and yellow color of the box as above, the column next to it (above/below T.line) will show the percentage from when RSI broke that
point to the current price of the candle.
-The RSI column is the current of the candle and the 20:2 parameter is the RSI trendline length and to combine the same parameters with the "RSI - trendlines - div "
indicator.
-The time can be changed in the Resolution indicator setting to show multiple time arcs.
-The up arrow symbols represent the price breaking upwards, the down arrow showing the price breaking downwards
Thank you everyone for your interest and trust
-----------------------------------------------------------------------------
Vietnamese
👉 Đây là script về máy quét 20 cặp giao dịch với đường trendline của RSI .
-Trên mỗi biểu đồ của cặp giao dịch chỉ tồn tại duy nhất 1 cặp trendline đi sát nhất với RSI là: 1 trendline tăng và 1 trendline giảm
-Vì vậy khi thống kê trên bảng cũng hiển thị cột của trend tăng và cột của trend giảm
-Khi RSI tiến gần đến 1 đường trendline bất kì mà tỉ lệ còn 10% thì đường trendline đó tô màu xanh(trend giảm) ,màu đỏ(trend tăng)
-Cột ✎ T.line-đường trendline bên trên(✐ T.line-đường trendline bên dưới) là giá trị của đường trendline hiện tại so với RSI
-Cột ══════ \𝖗𝖊𝖘𝖎𝖘𝖙𝖆𝖓(𝖘𝖚𝖕𝖕𝖔𝖗𝖙 \══════) khi RSI phá vỡ trendline sẽ thể thiện 1|1|1 (tức là cây nến đầu tiên) và giá trị phần trăm khi phá qua điểm của trendline.Đây là tín hiệu tốt để ta xem xét giao dịch với đường RSI
-Thông số khi phá vỡ hiển thị 10|10|10 thì hiểu là giá đã phá vỡ 10 nến(nến RSI), và 10 nến đầu tiên được tô màu vàng ,sau đó sẽ bị ẩn.(có thể thay đổi trong cài đặt)
-Ngoài ra khi hiện thông số và màu vàng của ô như trên thì cột bên cạnh (above/below T.line) sẽ hiển thị được số phần trăm tính từ khi RSI phá vỡ điểm đó đến giá hiện tại của cây nến.
-Cột RSI là hiện tại của nến và thông số 20:2 là độ dài đường trendline RSI và để kết hợp cùng thông số với chỉ báo "RSI - trendlines - div "
-Có thể thay đổi thời gian trong cài đặt chỉ báo Resolution để hiển thị nhiều cung thời gian.
-Các biểu tượng mũi tên lên 🡹 thể hiện giá phá vỡ lên trên, mũi tên xuống 🡻 thể hiện giá đã phá vỡ xuống dưới
Cảm ơn mọi người đã quan tâm và tin dùng

RSI - trendlines - div[vn]This is an indicator for traders of trendline analysis with RSI (the formula for calculating RSI I don't mention here anymore because every trader knows it)
-
The Pine Script strategy plots pivot points and trendlines on the RSI chart.
This strategy allows the user to specify the interval for calculating the pivot points and the number of pivot points used to generate the RSI trendlines.
As all traders know, the RSI line closely follows the actual price line, it is an indicator of momentum, the RSI often tells us the direction of the price line in advance, it often precedes and goes along with the price.
RSI is one of the indicators that predicts price trends very well when it crosses its trendline (except in case of divergence).
On the chart of the RSI indicator, I only show 2 trendlines closest to the RSI (1 increase, 1 decrease) and the trend lines far away from me are hidden so that traders can focus on observing better.
When an uptrend line of RSI (or a decrease of RSI) is drawn according to the settings in the settings of the indicator, then that line is support and resistance so that we can proceed to make a BUY or SELL point according to the indicator. RSI support and resistance strategy
When the RSI line breaks above the definitive uptrend line or breaks below the trendline definitively, the price signals a reversal to the nearest trendline.
When the RSI breaks the downtrend line of the RSI (definitively), it signals that the price has a high probability of reversing or approaching the nearest resistance area or possibly reversing from bearish to bullish.
When the RSI breaks the uptrend line of the RSI (definitively), it signals that the price is likely to reverse or reach the nearest resistance area or it may reverse from bullish to bearish.
In addition, I have integrated the normal divergence function of RSI for traders to use in case of divergence - combined with trendline to identify trend reversal more clearly.
-------------------------------------------------------------------------------------------------------
Vietnamese
-Đây là chỉ báo dành cho các trader thuộc trường phái phân tích đường xu hướng với RSI(công thức tính RSI tôi không nhắc ở đây nữa vì mọi trader đều biết)
-Chiến lược Pine Script vẽ các điểm trục và đường xu hướng trên biểu đồ RSI.
-Chiến lược này cho phép người dùng chỉ định khoảng thời gian tính toán các điểm xoay và số điểm xoay được sử dụng để tạo các đường xu hướng của RSI.
-Như các Trader đều biết đường RSI bám sát thực tế với đường giá, nó là chỉ báo về động lượng ,RSI nhiều khi cho chúng ta "biết trước" được hướng đi của đường giá, nó thường đi trước và đi cùng với giá
-RSI là một trong những chỉ báo dự đoán xu hướng giá rất tốt khi cắt đường xu hướng của nó (chỉ trừ trường hợp phân kì)
-Trên biểu đồ của chỉ báo RSI tôi chỉ đưa ra 2 đường trendline gần với đường RSI nhất (1 tăng , 1 giảm)còn các đường xu hướng cách xa tôi đều để ẩn để các Trader tập chung quan sát tốt hơn
-Khi đường xu hướng tăng của RSI (hoặc giảm của RSI) được vẽ ra theo các thiết lập trong cài đặt của chỉ báo,thì đường đó là hỗ trợ,kháng cự để ta có thể tiến hành thực hiện điểm BUY hoặc SELL theo chiến lược hỗ trợ và kháng cự của RSI
-Khi đường RSI mà phá vỡ lên trên đường xu hướng tăng dứt khoát hoặc phá xuống dưới đường xu hướng cách dứt khoát thì giá báo hiệu sắp đảo chiều ngược với đường xu hướng gần nhất
-Khi RSI phá vỡ đường xu hướng giảm của RSI (cách dứt khoát) thì báo hiệu sắp tới giá có khả năng cao sẽ đảo chiều hay tiến tới vùng kháng cự gần nhất hay có thể đảo chiều từ giảm thành tăng
-Khi RSI phá vỡ đường xu hướng tăng của RSI (cách dứt khoát) thì báo hiệu sắp tới giá có khả năng cao sẽ đảo chiều hay tiến tới vùng kháng cự gần nhất hay có thể đảo chiều từ tăng thành giảm
-ngoài ra tôi có tích hợp thêm vào công cụ chức năng phân kì thường của RSI để trader dùng trong trường hợp phân kì - kết hợp với đường trendline để xác định xu hướng đảo chiều rõ ràng hơn

RSI Pull-BackA pull-back occurs whenever the price or the value of an indicator breaks a line and comes back to test it before continuing in the prevailing trend.
The RSI has oversold and overbought levels such as 20 and 80 and whenever the market breaks them returns to normality, we can await a pull-back to them before the reversal continues.
This indicator shows the following signals:
* A bullish signal is generated whenever the RSI surpasses the chosen oversold level then directly shapes a pull-back to it without breaking it again.
* A bearish signal is generated whenever the RSI breaks the chosen overbought level then directly shapes a pull-back to it without surpassing it again.

RSI DivergenceWhat is "RSI Divergence"?
"RSI Divergence" is a indicator that find RSI divergence automatically.
What it does?
When it finds an RSI divergence, it draws a line on the indicator.
How it does it?
The lines are found using the least squares method. If the signs of the linear regression on the graph and the linear regression plotted on the RSI are different, this is considered divergence.
How to use it?
RSI lenght = RSI lenght
source = source of RSI
RSI Divergence Lenght = lenght of lines that draws on indicator
zoom = zoom
examples:

TIGER ALERT RSI DIVThats our first RSI DIV indicator for free use.
What is an RSI divergence?
What Is the Relative Strength Index (RSI)?
The relative strength index (RSI) is a momentum indicator used in technical analysis.
RSI measures the speed and magnitude of a security's recent price changes to evaluate overvalued or undervalued conditions in the price of that security.
The RSI can do more than point to overbought and oversold securities. It can also indicate securities that may be primed for a trend reversal or corrective pullback in price. It can signal when to buy and sell. T
raditionally, an RSI reading of 70 or above indicates an overbought situation. A reading of 30 or below indicates an oversold condition.

Strength of Divergence Across Multiple IndicatorsOverview:
One-stop shop for all your divergence needs, including:
(1) A single metric for divergence strength across multiple indicators.
(2) Labels that make it easy to spot where the truly strong divergence is by showing the overall divergence strength value along with the number of divergent indicators. Hovering over the label shows a breakdown of each divergent indicator and its individual divergence strength value.
(3) Fully customizable, including inputs for pivot lengths, divergence types, and weights for every component of the divergence strength calculation. This allows you to quickly and easily optimize the output for any chart. Don't worry, the default settings will have you covered if you're not interested in what's going on under the hood.
The Divergence Strength Calculation:
The total divergence strength value is the sum of the divergence strengths of all indicators for which divergence was detected at a given bar. Each indicator's individual divergence strength is comprised of two basic components: (1) |ΔPrice| - the magnitude of the change in price over the divergence period (pivot-to-pivot), and (2) |ΔIndicator| - the magnitude of the change in indicator value over the divergence period.
Because different indicators' scales and volatility can vary greatly, the Δ values are expressed in terms of standard deviation to ensure that the values are meaningful and equitable across all indicators and assets/instruments/currency pairs, etc:
|ΔIndicator| = |indicator_value_1 - indicator_value_2| / 2 * StDev(indicator_series,100)
Calculation Weights:
All components of the calculation are weighted and can be modified on the Inputs page in settings (weights are simply multipliers). For example, if you think hidden divergence should carry less weight than regular divergence, you can assign it a lesser weight. Or if you think RSI divergence is worth more than OBV divergence, you can adjust their weights accordingly. List of weights:
Regular divergence weight - default = 1
Hidden divergence weight - default = 1
ΔPrice weight - default = 0.5 (multiplied by the ΔPrice component)
ΔIndicator weight - default = 1.5 (multiplied by the ΔIndicator component)
RSI weight - default = 1.1
OBV weight - default = 0.8
MACD weight - default = 0.9
STOCH weight - default = 0.9
Development for additional indicators is ongoing, as is research into the optimal weight configuration(s).
Other Inputs:
Pivot lengths - specify the number of bars before and after each pivot high/low to consider it a valid candidate for divergence.
Lookback bars and Lookback pivots - specify the number of bars or the number of pivots to look back across.
Price sources - specify separate price sources for bullish and bearish divergence
Display settings - specify how lines and labels should display, including which divergence strength values should show the largest labels. Include/exclude specific divergence types and indicators.
Please report any bugs, or let me know if you have any enhancement suggestions or requests for additional indicators.
@reees

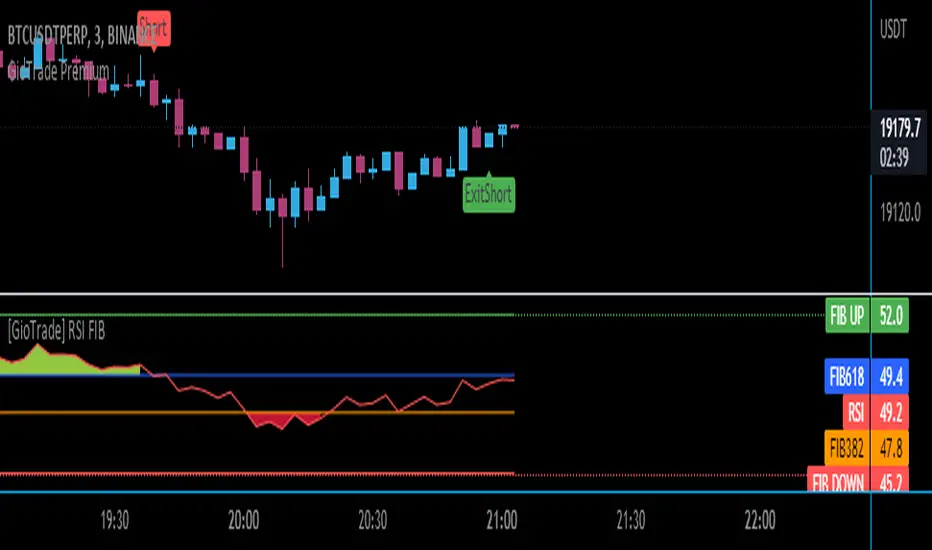
RSI FIB [G I O]BINANCE:BTCUSDT
A free indicator where you can see the fibonacci levels of the RSI.
Giotrade is aware of the importance of the RSI in trading and offers a new indicator that can guide you to conduct free market analysis.
The red and green zones warn of overbought and oversold, allowing you to predict the direction of price volatility.
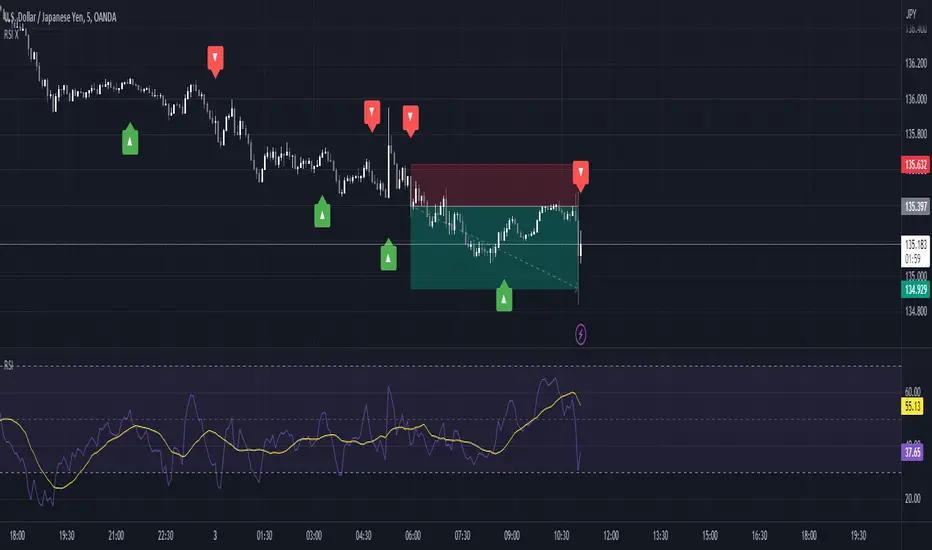
RSI Exhaustion + DivergenceThe Relative Strength Index Exhaustion with Divergence is an essential replacement of the standard Relative Strength Index Oscillator because it's able to identify and highlight hidden exhaustions together with Bullish/Bearish Regular and Hidden Divergences.
This indicator can give the outmost probability in spotting trend reversals or trend continuation.
By identifying hidden exhaustion momentum, the Relative Strength Index Exhaustion indicator represents an essential support to the trader in effectively reading the market and grabbing the best opportunities.
This detects divergences between price and indicator with 1 candle delay so it filters out repeating divergences.
Recommended to use this at a higher timeframe to lessen the false signals.
Red Arrow = Bullish/Bearish Divergence
White Arrow = Hidden Bullish/Bearish Divergence
RSI Momentum Acceleration by TartigradiaPlots the momentum acceleration oscillators from price and RSI, rescaled and with areas above/below highlighted.
Usage: in a nutshell, when the background is yellow, it's bearish (RSI decelerates faster than price), whereas when the background is green, it's bullish (RSI accelerates faster than price). It appears to detect early some reversals that are otherwise difficult to detect.
Note: it supports using any other indicator's output as the second source input, instead of RSI. PineScript does not allow for more than one source to receive input from other indicators, all the others must only use price as an input.
This indicator uses the core routine to calculate Momentum Acceleration Oscillators by DGT:
This indicator is based on the idea of stinkbug : "RSI is a good momentum indicator showing how excited ppl are on a move, this is why divergences on it work so well. I would like to see the change accelerating or slowing on a move up or down.."

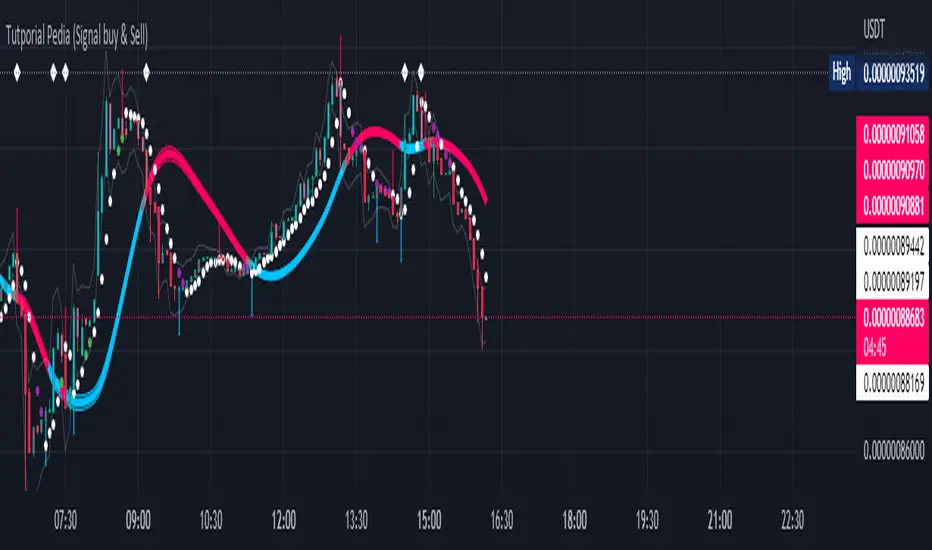
Tutporial Pedia (Signal buy & Sell)Untuk mempermudah kita dalam bermain dan memahami Signal Trade View Rate 98 %
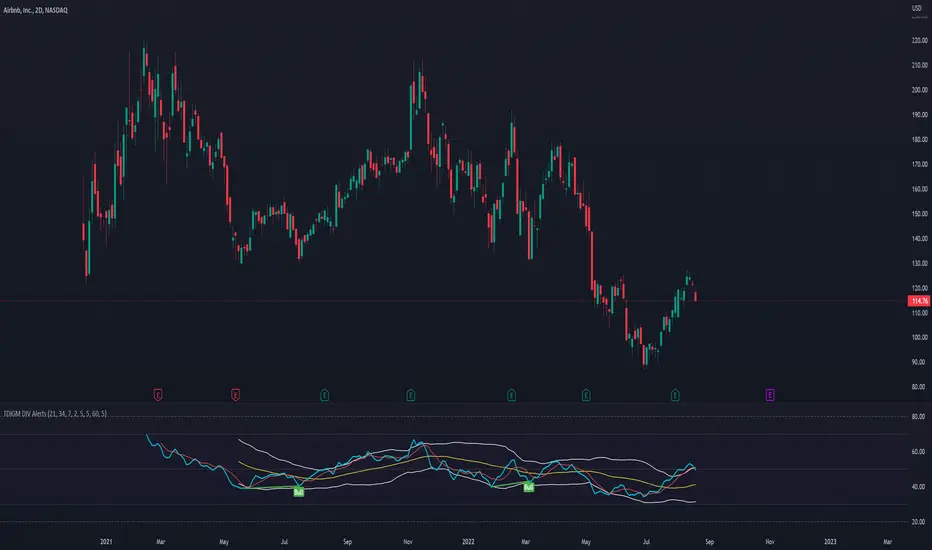
TDI - Traders Dynamic Index [Goldminds] with DIV RSI AlertsOriginally from Goldminds. Later modified by Jakub a Babo. I just added RSI DIV alerts. You're welcome. :)
Instruction: once you have have this indicator and press Alt + A to create alert.
Ultimate RSI - Divergence + S/R + Reverse RSIThis is a modification of the TradingView RSI with some of my favourite RSI features added.
This includes Divergence indicators. EMA with colour change on cross, Support and resistance lines and reverse RSI.
A reverse calc has also been added. This will allow you to input 3 different RSI values for a price prediction. This is good to use with the support and resistance lines and can give you key areas on the chart where the price may bounce/reject.
All colours and modifications can be turned on/off.
Enjoy! :)

Day Trade Indicator [by KN Lo]Design for LONG and Day Trade only
=============================
features (this indicator is able to):
- show EMA 9, 50, 200 & VWAP
- show Candle Pattern (e.g. Engulfing, Shooting Star)
- show HMA fast(10) / slow(50) lines
- show Breakout Signal (Blue triangle)
- show RSI Divergence
- find Volitility Decreasing
- find Consolidation stage
- change Background color (green) when positive figures
- show indicator table
=============================
indicator table:
- Price over VWAP
- Price over EMA200
- EMA9 > EMA50 > EMA200
- RSI < 80
- EMA9 > VWAP
- MACD fast > slow
- HMA fast > slow
- RSI Divergence (compare with previous higher high)
- Breakout Signal when the price is higher than previous high
- Volitility: the difference between previous high (9 periods) and previous low (9 periods), average by SMA, if lower than -30, show in green color.
- Consolidation: consider previous 7 periods to find consolidation stage.

RSI Potential Divergence - FontiramisuIndicator showing potential momentum divergences on RSI Momentum.
The problem with the classic divergence is that when the signal appears, it is sometimes too late to enter a trade.
The potential divergence corrects this problem by signaling the beginning of a potential divergence.
RSI is a momentum indicator that offers relevant insights with divergences.
Potential divergences are indicated with the letter B and a red color for Bearish Div or Green color for Bullish Div .
Potential divergence is confirmed when the line and the label "Bear"' or "Bull" appear.

ARKA-RSI CrossThis indicator draws two RSI with different parameters and displays the crosses with the following conditions as colored arrows. This composite RSI can be adjusted in two ways. for example:
1. Cross parameters 5 and 14 above or below 50 which is indicated by light-colored arrows in the chart.
2. Cross parameters 5 and 14 of level 50, which are indicated by darker arrows.

RSI PacingThe RSI Pacing indicator compares the movement of the RSI directly with the movement of the asset to help identify divergences.
Bullish Divergences
The RSI is increasing at a greater rate than the pace of the asset.
The RSI is decreasing at a lesser rate than the pace of the asset.
Bearish Divergences
The RSI is decreasing at a greater rate than the pace of the asset.
The RSI is increasing at a lesser rate than the pace of the asset.
Warning: Does not yet work on higher timeframes yet. Working on getting the pace normalized to the RSI's bounds.

RSI - S&P Sector ETFsThe script displays RSI of each S&P SPDR Sector ETF
XLB - Materials
XLC - Communications
XLE - Energy
XLF - Financials
XLI - Industrials
XLK - Technology
XLP - Consumer Staples
XLRE - Real Estate
XLU - Utilities
XLV - Healthcare
XLY - Consumer Discretionary
It is meant to identify changes in sector rotation, compare oversold/overbought signals of each sector, and/or any price momentum trading strategy applicable to a trader.

MOD RSI [KPM]Using this indicator you can easily view Divergence, and Market Tend in Mutitimeframe
NOTE: This is stranded RSI I only added colours for easy cath the market trend.
I'm not regarding anything with this indicator. All risk is yours
Thank you
