QuantNomad - RSI Strategy - NKE - 5mReally good performance of Simple RSI Strategy for Nike (NKE) 5m chart.
Params: RSI Length: 30, RSI OverSold level: 45, RSI OverBought Level: 60
Performance:57% profit, 112 trades, 73% prof, 6.7% dd, 1.36 sharpe.
And remember:
Past performance does not guarantee future results.
Rsi_overbought

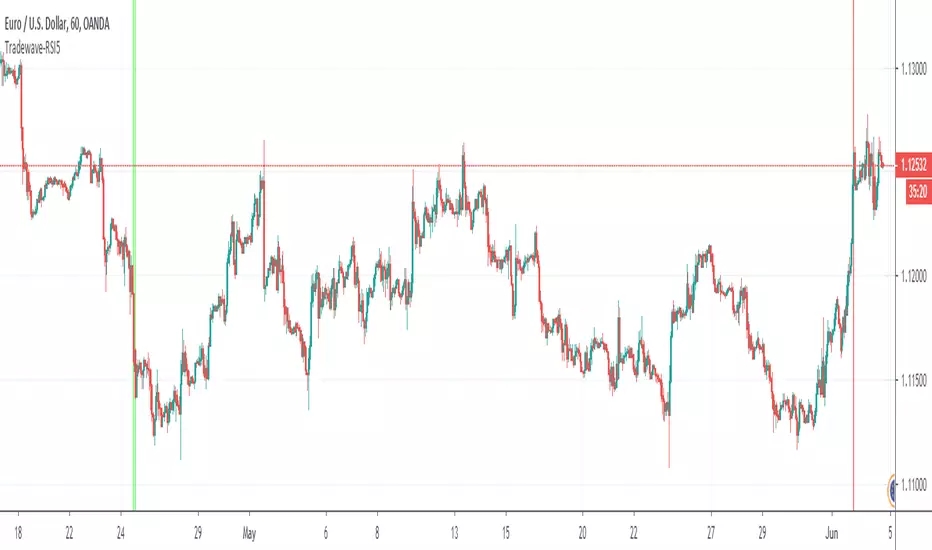
Tradewave-RSI5Calculates the Multi Time Frame RSI Overbought Oversold Conditions.
- Draws a vertical green line when RSI is oversold across 5 time frames of your choice
- Draws a vertical red line when RSI is overbought across 5 time frames of your choice.
Time frames can be modified in indicator settings.
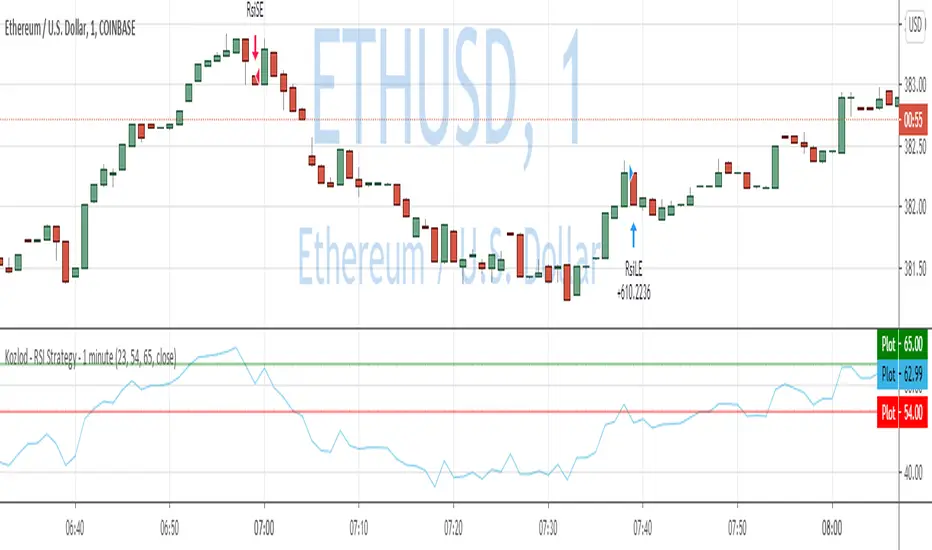
Kozlod - RSI Strategy - 1 minute - ETHUSDTrying to find simple strategies with optimal parameters which work well for certain symbols/timeframe.
Found that basic RSI strategy without any position management works pretty good for 1m chart for BTCUSDT.
It might not work very good on it's not but can give you a pretty good base for more complicated indicators.
Also, some position management as simple as static SL and PT can improve performance quite a lot.
And remember:
Past performance does not guarantee future results.
Kozlod - RSI Strategy - 1 minuteStarted to play with very simple strategies. Trying to find ones with optimal parameters which work well for certain symbols/timeframe.
Found that basic RSI strategy without any position management with high RSI length (65 in this script) works pretty good for 1m chart for few stocks.
It's also not bad for AAPL , SPY .
It might not work very good on it's not but can give you a pretty good base for more complicated indicators.
And remember:
Past performance does not guarantee future results.

~Sexy RSI~Fellow sexy traders,
Wrote this to save time from constantly having to add my own horizontals/MAs to the default RSI so I decided to make this modification.
The default settings include channels from 40-80 (green horizontals) for a bullish range, and 20-60 (red horizontals) for the bearish range.
Also includes white line at 50 level, and blue horizontals at extremes (90 and 10).
If RSI stays in one of the red or green range that can signify the trend direction, as directed by Andrew Cardwell (inventor of the RSI ).
If you wish for other levels to be included, just let me know. Comment on here or dm me on twitter @boss_charts and I might add the settings for you.
Additionally, in order to tell the level of the RSI and how overextended it might be, I added the setting for the RSI to change color depending on its level. Current settings are as follows:
Normal RSI (30-70) = PURPLE
Conventional Overbought/Oversold (30-20 + 70-80) = RED
1st extended (20-15 + 80-85) = PINK
2nd extended (15-10 + 85-90) = ORANGE
VERY EXTENDED (<10 + >90) = YELLOW
That way you can get an idea of how drastic a move is by the color alone.
Finally, there are the default MAs added that Mr. Cardwell defines as useful for defining the trend. These being the 9 MA and 45 EMA/WMA.
The strategy with these is to have the MAs on both price and RSI . If the 9MA is above the 45 MA on both price and RSI , then this is bullish and you can look for longs.
Conversely, if the 9 is below the 45 on both RSI and price that is bearish , and you can look for shorts.
I added the background color change for the points where the MAs cross each other, so you do not have to have the MAs fogging up your charts to know where they are relative to one another. This is similar to my MA cross indicator which contains the same functionality.
Never financial advice. Back test it for yourself and find MA configurations that work for you.

Sexy RSI for sexy tradersHello fellow sexy traders.
I was tired of constantly having to add my own horizontals/MAs to the default RSI so I decided to make this modification.
The default settings include channels from 40-80 (green horizontals) for a bullish range, and 20-60 (red horizontals) for the bearish range.
Also includes white line at 50 level, and blue horizontals at extremes (90 and 10).
If RSI stays in one of the red or green range that can signify the trend direction, as directed by Andrew Cardwell (inventor of the RSI).
If you wish for other levels to be included, just let me know! Comment on here or dm me on twitter @boss_charts and I can add the settings for you, so all you have to do is click a button and it will set it to your desired config. I want this to be a tool that is useful for heavy traders to save them time.
Additionally, in order to tell the level of the RSI and how overextended it might be, I added the setting for the RSI to change color depending on its level. Current settings are as follows:
Normal RSI (30-70) = PURPLE
Conventional Overbought/Oversold (30-20 + 70-80) = RED
1st extended (20-15 + 80-85) = PINK
2nd extended (15-10 + 85-90) = ORANGE
VERY EXTENDED (<10 + >90) = YELLOW
That way you can get an idea of how drastic a move is by the color alone. According to Dr. Cardwell, a drastic move to over/under extended can be a sign of strength.
Finally, there are the default MAs added that Mr. Cardwell defines as useful for defining the trend. These being the 9 MA and 45 EMA/WMA.
The strategy with these is to have the MAs on both price and RSI. If the 9MA is above the 45 MA on both price and RSI, then this is bullish and you can look for longs.
Conversely, if the 9 is below the 45 on both RSI and price that is bearish, and you can look for shorts.
I added the background color change for the points where the MAs cross each other, so you do not have to have the MAs fogging up your charts to know where they are relative to one another. This is similar to my MA cross indicator which contains the same functionality.
Never financial advice. Backtest it for yourself and find MA configurations that work for you.
Enjoy! Feel free to send feedback/requests whenever.

RSI simple Long ShortSimple indicator when RSI goes above 75 or below 25. It gives signal at next proper candle.

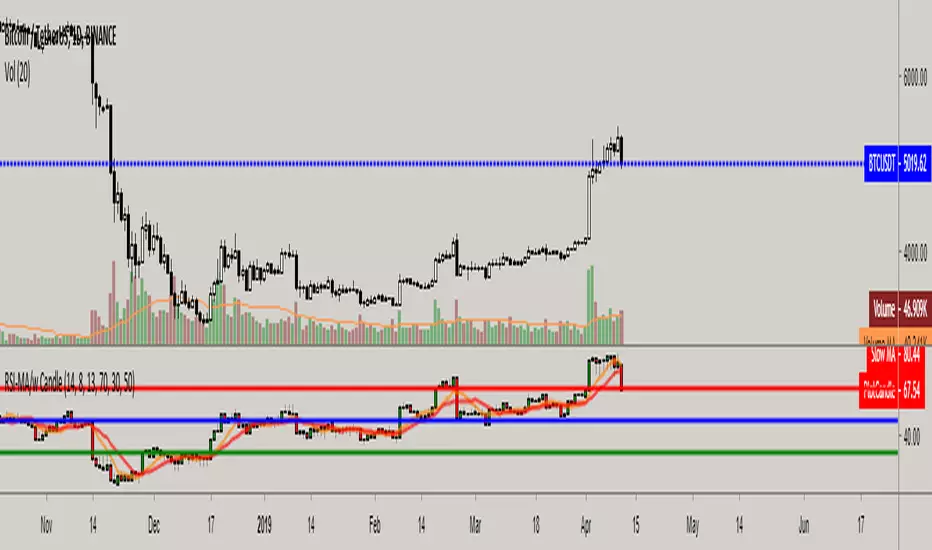
Rs Candlestick Indicator With Moving AveragesUnlike the traditional RSI, this one offers you an detailed insight with candlestick chart, rather than a simple line setup. It also includes two different customizable moving average(s) and offers detailed information such as bullish/bearish candlestick formations, negative and positive divergences on indicator.
How to use: Similar to candlestick charts, whenever Rsi candle close and stays above moving average(s) it's a buy signal and whenever candle closes below moving average(s), that's a sell signal. Rather than waiting for Rsi to break mid-line(50) to buy and sell, this one offers dynamic and more accurate buy and sell signals. You can also customize top-mid-bottom line values as well to determine overbought and oversold levels.
Combination RSI & PPO%Shows signal bullish when RSI < 30 and MACD fast is below MACD slow and MACD fast is below -0.5

Spiky Iguana Multi RSI Bands (Reverse RSI for the Price) by RRBSpiky Iguana Multi RSI Bands by RagingRocketBull 2018
Version 1.0
This indicator shows multiple RSI Bands with prices corresponding to specified overbought/oversold RSI levels.
It is used to extrapolate the exact price levels currently matching a given set of RSI levels based on prior price/RSI levels action.
You can think of it as a reverse RSI where RSI levels are moving dynamically around the price instead of price bouncing between straight lines.
Features:
- 6+6 = 12 customizable Overbought(R)/Oversold(S) RSI Levels + 6 Mean(M) lines
- Multicolor levels/fill ranges
- Show/Hide specific S/R/M levels and fill ranges
1. uses plot*, fill and is based on RSIBANDS_LB
Good Luck! Feel free to explore and learn from the code

RSI Reader DARK THEMERSI reader is an ADD-ON -184.95% of the indicator Market-Reader (available in TV too)
It will detect:
- bullish and bearish divergence
- bullish and bearish cycle on RSI
-When RSI is ready for an acceleration meaning that a significant bull or bear move can occur soon
It is also a RSI with less noise offering a more accurate analysis of the market without adding lag.
This Add-on -184.95% is Free for all user of the indicator Market-Reader.
This script will be continuously update
Access requires subscription (contact by MP 1.50% )

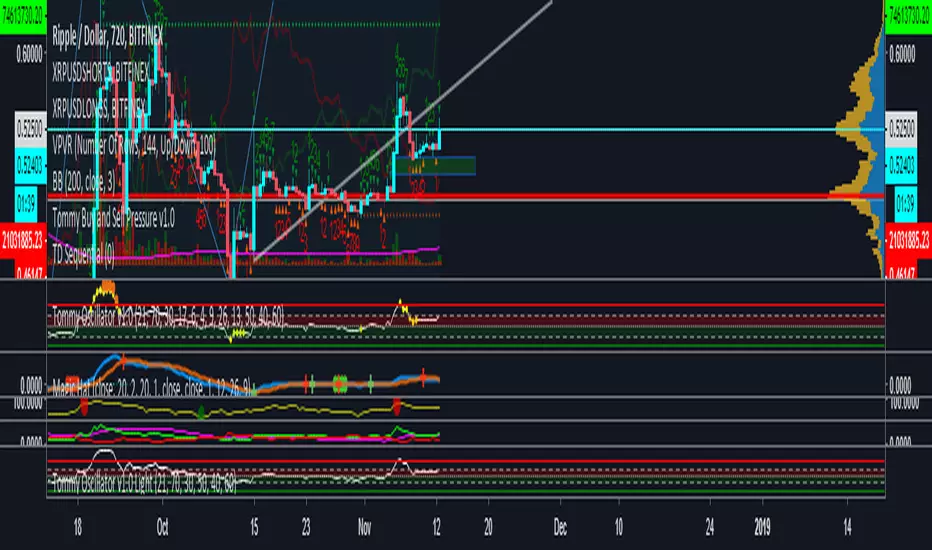
Tommy Oscillator v1.0 LightRSI rules: If we break above 70 RSI, 40-50 RSI acts as support,
If we break below 30 RSI, 50-60 RSI acts as resistance
I color coded the support/resistance areas to make visuals easier. This is part of my private indicator, but I removed the buy/sell part (which is the private part). I think this will help a lot with your guy's trading.
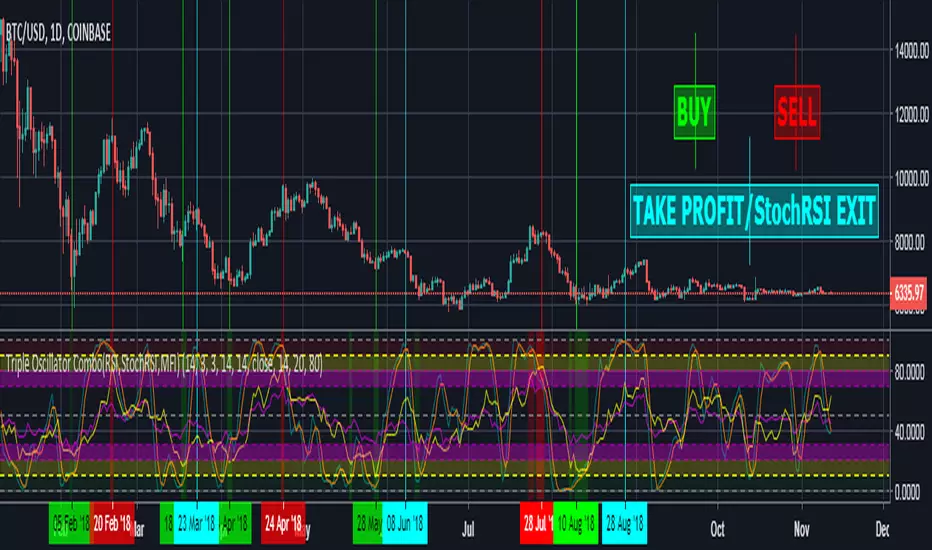
Triple Oscillator Combo(RSI,StochRSI,MFI) IlluminatedThis oscillator basically is three in one oscillator with every overbought/oversold condition on different levels being illuminated/highlighted in the oscillator background for ease of spotting potential trade opportunity .
Oscillators involved :-
1. RSI (Relative Strength Index)
2. StochRSI (Stocahstic Relative Strength Index)
3. MFI (Money Flow Index)
Tip :
a. While spotting bullish/bearish divergences, RSI is recommended more than MFI .
b. While spotting oversold/overbought conditions, MFI is recommended more than RSI (that is why MFI oversold/overbought conditions are
highlighted much brighter than that of RSI in the oscillator background).
c. Always use Stoch RSI with other indicators and never as a stand alone/independent (use Stoch RSI as grain of a salt) as it just helps you position
your entry exit better .
> You can always change configuration in setting/format as per your own requirement.
Renko scalp (buy/sell) indicatorThis script is based on some variations of Rocket (from Until1Mil group) scalping strategies.
It uses Renko to determine buy/sell areas.
More details can be found on my steemit page (same user as here).

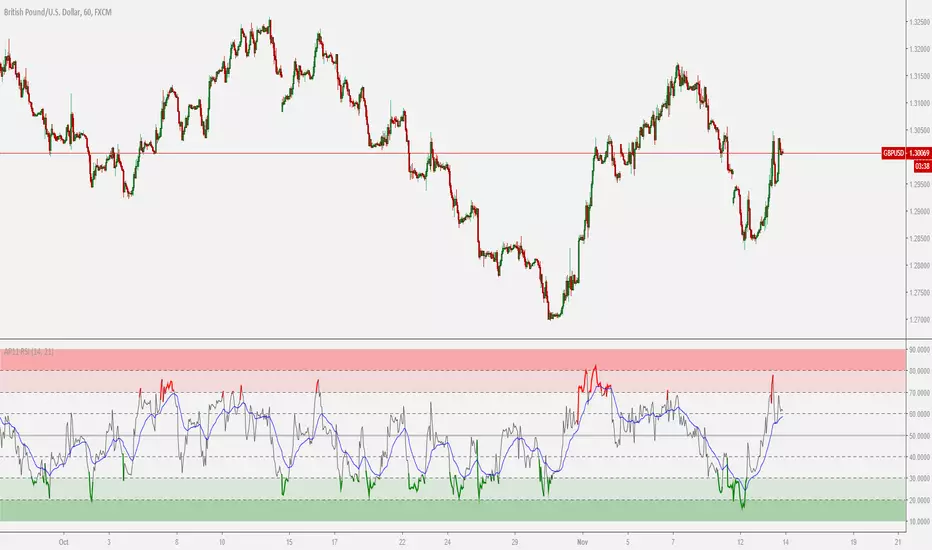
RSI StrapFollowers, this RSI is for you!
RSI Strap uses a normal Relative Strength Index (RSI) to determine what price level is in the over-bought or over-sold range.
This minimalist overlay improves the technical trading experience as indicators take up a lot of space and leave your chart area cluttered.
Change the RSI length, as well as the overbought and oversold levels in the indicator settings panel.
The default RSI length is set at 14, and the overbought and oversold levels are 70% and 30% respectively.
Happy Trading!
Find this indicator by searching "RSI Strap" in the public indicator library.
Don't forget to like!

Merge Of RSI & Stochastic RSI [salar88]This Indicator Include Stochastic RSI And Multiple Time Frame RSI
I Wish Its gonna useful for tradingview users

TTM Apollo 11 RSIColor coded RSI to give a better indication of when to buy or sell based on the RSI level along with an included EMA signal to help describe the trend.

RSI Swing SignalThis indicator is a tool designed to be used with Steven Hart's RSI Exhaustion strategy. For more information google TheTradingChannel or look him up on YouTube :)
The default RSI settings for this strategy are:
RSI Overbought: 80
RSI Oversold: 20
Length: 7
When the RSI gets above 80, the line will turn red and the script will begin looking for a specific type of engulfing candle to go short. The same is true when the RSI gets below 20, but the line will turn green and look for longs. It is best used as a back-testing aid, but it can also be used to send emails or SMS alerts whenever the conditions are met. It can also be used as an alternative colored RSI indicator by removing the signals in the settings menu and changing the RSI parameters to whatever you normally use. This can aid in RSI divergence and overbought/sold strategies.
Entries:
The bright green and bright red lines represent the first type of engulfing candle.
The dark green and red lines represent the second type of engulfing candle.
Some pairs perform best with only one of these entries, while others work fine with both.
This is a counter-trend or consolidation strategy, and is best used in combination with trend-continuation or trend-following strategies. As always, make sure you back-test it before you use it to trade as it works better on some pairs than others.

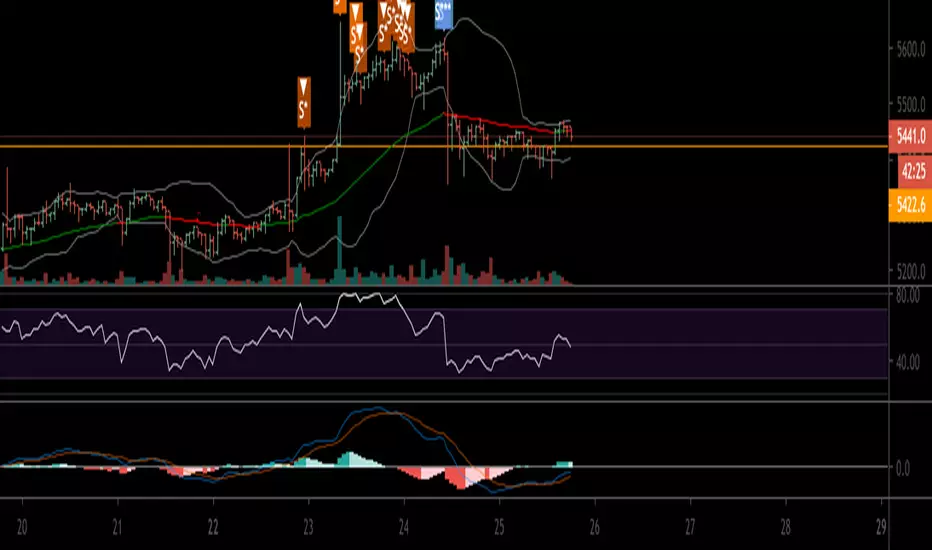
RSI buy/sell partitionsLook overbought and overbought to predict the time of the transaction.
RSI overbought:
- RSI = 21 to 30 (default configuration): The graph showing the letters 'Buy' and candles will have different colors.
- RSI < 21 (default configuration): The graph showing the letters 'Buy' displays bold and the candles will have high light background colors.
RSI oversold:
- RSI = 70 to 79 (default configuration): The chart that shows the word 'sell' and the candlestick will have different colors.
- RSI > 80 (default configuration): Display chart for 'Sell' displays bold and candles will have high light background colors.

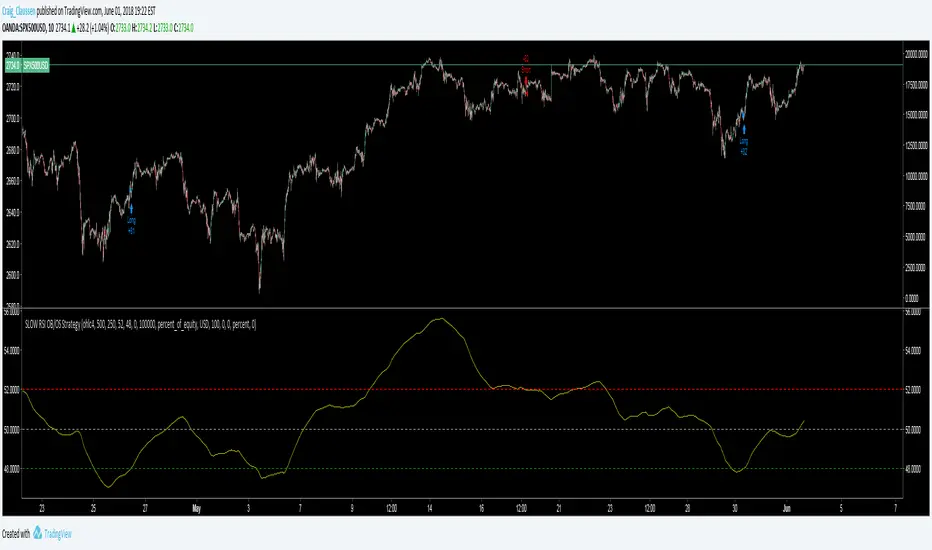
SLOW RSI OB/OS StrategySlowing the RSI down opens up a whole new world of possibilities.
This concept can work for a lot of TA indicators including the MACD.
See script source code for further description. Feel free to add pyramid trades at your own discretion in your format menu.
No this doesn't repaint!