Bull Bear Divergence IndicatorThe script is written for Constance Brown-like anayis with divergence signals between price and indicator (i.e. stock close / RSI divergence)
Note: Though the example here with NVDA shows good reversal predictions, best results generally are optained with un-normalized indicators and oscilators like CB#s comosite index.
(For Trading view written by LazyBear.) I use two different lines: an indi high line for baerish, and an indi low line for bullish divergences.
The script only shows divergences to pivot pairs next to each other, not between actual pivot and those "a few pivots ago"
For individual work, chose your indicator and replace rsi in line 10 with it, anything else is auto. Sript bottom: optional comparison lines addable.
חפש סקריפטים עבור "Divergence"

MACD Divergence auto displayed on chart, with alertsMACD Pivot Divergence Detector
This tool identifies MACD histogram divergences based on confirmed pivot highs and lows.
Instead of comparing swing points on the MACD line, this script focuses specifically on the histogram, which measures momentum shifts between MACD and Signal.
How it works
The script detects confirmed pivots using a two-bar swing structure.
When price breaks above a previous pivot high, the script compares the MACD histogram value at that pivot to the current histogram value:
• If price makes a higher high while the histogram makes a lower high, a potential bearish divergence is marked.
The reverse logic is applied for bullish divergence when price breaks below a pivot low.
What makes this script unique
It uses pivot-confirmed histogram values, not lookback-based divergence.
It evaluates divergence only at actual highs/lows, reducing false positives.
It marks divergence directly on the candles for visual clarity.
Alert conditions are included for automated detection.
How to use
Bullish signals may highlight potential momentum loss in downtrends; bearish signals may highlight momentum loss near highs. Divergence does not guarantee reversal and should be combined with broader context, structure, or trend analysis.

Aethix Cipher DivergencesAethix Cipher Divergences v6
Core Hook: Custom indicator inspired by VuManChu B, Grok-enhanced for crypto intel—blends WaveTrend (WT) oscillator with multi-divergences for buy/sell circles (green/teal buys #00FFFF, red sells) and dots (divs, gold overbought alerts).
Key Features:
WaveTrend Waves: Dual waves (teal WT1, darker teal WT2) with VWAP (purple for neon vibe), overbought/oversold lines, crosses for signals.
Divergences: Regular/hidden for WT, RSI, Stoch—red bearish, green bullish dots; extra range for deeper insights.
RSI + MFI Area: Colored area (green positive, red negative) for sentiment/volume flow.
Stochastic RSI: K/D lines with fill for overbought/oversold trends.
Schaff Trend Cycle: Purple line for cycle smoothing.
Sommi Patterns: Flags (pink bearish, blue bullish) and diamonds for HTF patterns, purple higher VWAP.
MACD Colors on WT: Dynamic WT shading based on MACD for enhanced reads.

True High/Low RSI for DivergenceThis Pine Script creates a highly specialized RSI (Relative Strength Index) indicator designed to provide a more accurate signal for divergence trading. Its official title is "True High/Low RSI for Divergence."
Here is a breakdown of its core features:
1. Dual RSI Calculation based on Highs and Lows:
Unlike a standard RSI that typically uses the closing price of a candle, this indicator calculates two separate RSI lines:
A "High RSI" : This line calculates the RSI based on the high price of each candle. It is intended to track momentum peaks more accurately.
A "Low RSI" : This line calculates the RSI based on the low price of each candle. It is designed to track momentum troughs more accurately.
The main purpose of this separation is to avoid the potential errors that can occur when using an average price (like the close or hl2) during periods of high volatility. By using the true extremes of the price candles, the indicator aims to show a more "true" representation of momentum for identifying divergences between price and the indicator.
2. Dynamic Transparency:
This is a key visual feature. The RSI lines are not always fully visible. They dynamically fade into view as they enter significant overbought or oversold zones:
The Low RSI line (red by default) is invisible when above a value of 50. As it drops from 49 towards 30, it becomes progressively more opaque (more visible). It reaches full opacity at an RSI value of 30, visually alerting the user to strengthening oversold conditions.
The High RSI line (blue by default) is invisible when below a value of 50. As it rises from 51 towards 70, it also becomes progressively more opaque. It is fully opaque at an RSI value of 70, highlighting strengthening overbought conditions.
3. User Customization:
The script allows for user flexibility. You can change:
The colors for both the High and Low RSI lines.
The RSI calculation length (default is 14).
The price source for each RSI line (though they are specifically designed to use high and low).
In summary, this indicator is a purpose-built tool for traders who rely on divergence. It provides a more precise and visually intuitive way to track momentum at its true peaks and troughs, helping to make more informed trading decisions.
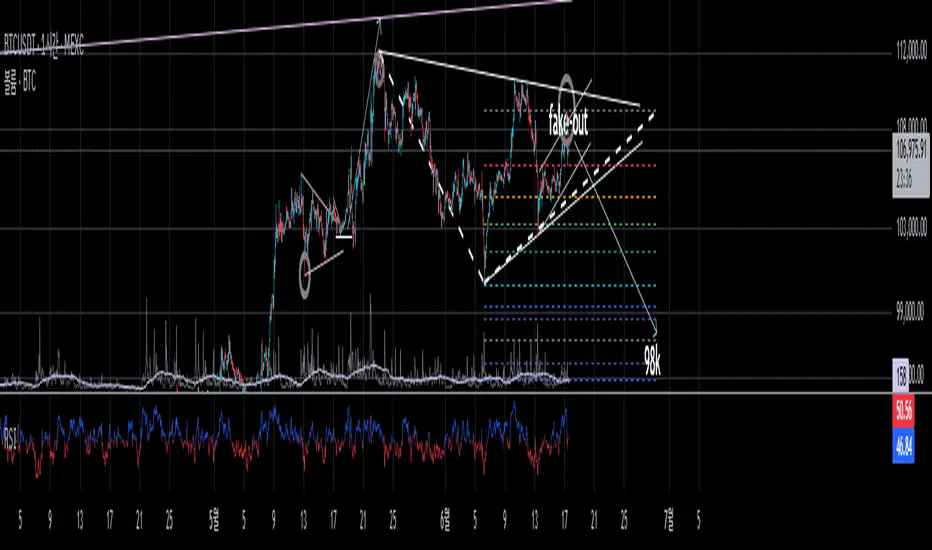
Enhanced MFI Divergence with Pivot SignalsEnhanced MFI Divergence with Pivot Signals
This custom Pine Script indicator identifies bullish and bearish divergences between price action and the Money Flow Index (MFI), enhancing the trader's ability to spot potential reversal zones with visual clarity and optional confirmation filters.
📊 Key Features:
🔹 MFI Divergence Detection
The script detects:
Bullish divergence when price forms a lower low but MFI forms a higher low.
Bearish divergence when price forms a higher high but MFI forms a lower high.
🔹 Pivot-Based Logic
To ensure high-confidence signals, the script uses pivot point logic to mark local highs and lows on both price and MFI. This avoids noise and focuses only on meaningful swing points.
🔹 Optional Confirmation Filter
You can enable a filter that checks if MFI is above 50 during bullish divergence (implying buying pressure) and below 50 for bearish divergence (implying selling pressure), adding an extra layer of confirmation.
🔹 Signal Markers
Signals are visually displayed on the chart using colored triangles:
Green triangle up for bullish divergence
Red triangle down for bearish divergence
🔹 Background Color Shading
The background is optionally shaded green or red based on MFI’s relationship to its smoothed WMA, helping you visually interpret trend bias.
🔹 Pivot Point Debugging Tools
Circles and crosses mark pivot points on price and MFI for debugging and visual clarity.
🔹 Alerts Ready
Real-time alerts notify you instantly when a bullish or bearish MFI divergence occurs, allowing for quick decision-making.
⚙️ How It Helps
This indicator is designed to help traders:
Anticipate price reversals by identifying hidden strength or weakness in momentum,
Avoid false breakouts,
Confirm entries or exits based on volume-weighted momentum divergence.
It works especially well when used alongside trend-following tools like moving averages, support/resistance zones, or additional volume indicators.
COIN/BTC Volume-Weighted DivergenceThe COIN/BTC Volume-Weighted Divergence indicator identifies buy and sell signals by analyzing deviations between Coinbase and Bitcoin prices relative to their respective VWAPs (Volume-Weighted Average Price). This method isolates points of potential trend reversals, overextensions, or relative mispricing based on volume-adjusted price benchmarks.
The indicator leverages Coinbase’s high beta relative to Bitcoin in bull markets. A buy signal occurs when Coinbase is below VWAP (indicating undervaluation) while Bitcoin is above VWAP (signaling strong broader momentum). A sell signal is generated when Coinbase trades above VWAP (indicating overvaluation) while Bitcoin moves below VWAP (indicating weakening momentum).
This divergence logic enables traders to identify misalignment between Bitcoin-driven market trends and Coinbase’s price behavior. The indicator effectively identifies undervalued entry points and signals exits before speculative extensions are correct. It provides a systematic approach to trading during trending conditions, aligning decisions with volume-weighted price dynamics and inter-asset relationships.
How It Works
1. VWAP:
“fair value” benchmark combining price and volume.
• Above VWAP: Bullish momentum.
• Below VWAP: Bearish momentum.
2. Divergence:
• Coinbase Divergence: close - coin_vwap (distance from COIN’s VWAP).
• Bitcoin Divergence: btc_price - btc_vwap (distance from BTC’s VWAP).
3. Signals:
• Buy: Coinbase is below VWAP (potentially oversold), and Bitcoin is above VWAP (broader bullish trend).
• Sell: Coinbase is above VWAP (potentially overbought), and Bitcoin is below VWAP (broader bearish trend).
4. Visualization:
• Green triangle: Buy signal.
• Red triangle: Sell signal.
Strengths
• Combines price and volume for reliable insights.
• Highlights potential trend reversals or overextensions.
• Exploits correlations between Coinbase and Bitcoin.
Limitations
• Struggles in sideways markets.
• Sensitive to volume spikes, which may distort VWAP.
• Ineffective in strong trends where divergence persists.
Improvements
1. Z-Scores: Use statistical thresholds (e.g., ±2 std dev) for stronger signals.
2. Volume Filter: Generate signals only during high-volume periods.
3. Momentum Confirmation: Combine with RSI or MACD for better reliability.
4. Multi-Timeframe VWAP: Use intraday, daily, and weekly VWAPs for deeper analysis.
Complementary Tools
• Momentum Indicators: RSI, MACD for trend validation.
• Volume-Based Metrics: OBV, cumulative delta volume.
• Support/Resistance Levels: Enhance reversal accuracy.

RSI Failure Swings & AO DivergencesHello!
The script identifies RSI divergences, similar to other public scripts; however, RSI failure swings are also distinguished. When a failure swing is identified, the script calculates the highest RSI measurement (bottom failure swing) or the lowest RSI measurement (top failure swing) between the two RSI pivot points. A continually updating line is plotted at the "fail point" until it is penetrated for two sessions! In addition, the script displays the RSI fail point measurement. RSI bearish divergences are only distinguished when both RSI peaks form above 70. bullish divergences are only distinguished when both RSI troughs form below 30. Top failure swings require the initial RSI peak be above 70, the second RSI peak can form at any measurement. Bottom failure swings require the initial RSI trough be below 30, the second RSI trough can form at any measurement.
Included are Awesome Oscillator divergences. The indicator is a bit tricky; the oscillator does not incorporate an upper or lower extremity. Consequently, the script uses interpolated percentiles to characterize relatively high measurements and relatively low measurements. Bearish divergences that form within the 90th - 99th percentile are distinguished, and bullish divergences that form within the 1 - 10th percentile are distinguished. This can CERTAINLY be changed should you copy the source code and think of something better! For AO, white columns reflect a difference measurement >= 0; black bars reflect a difference measurement < 0

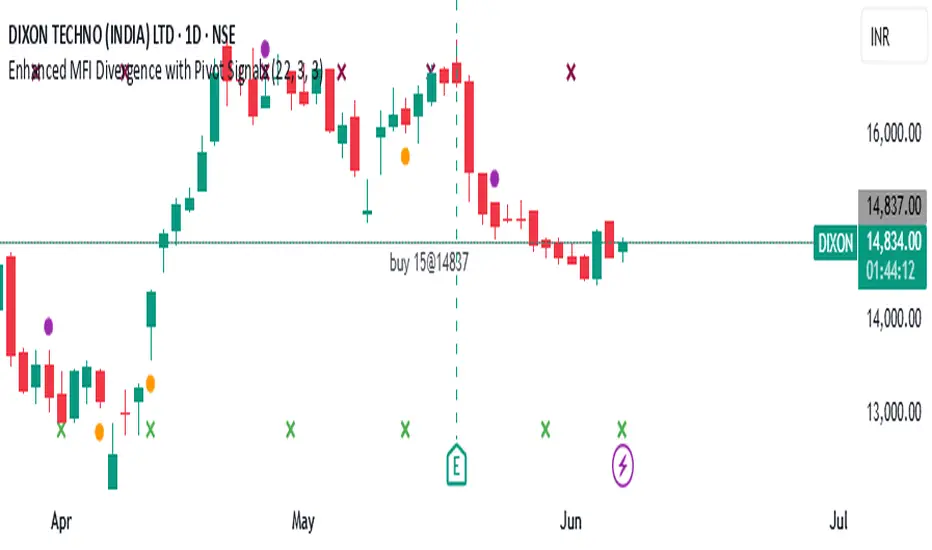
RSX-D [ID: AC-P]The "AC-P" version of Jaggedsoft's RSX Divergence and Everget's RSX script is my personal customized version of RSX with the following additions and modifications:
LSMA-D line that averages in three LSMA components to form a composite, the LSMA-D line. Offset for the LSMA-D line is set to -2 to offset latency from averaging togther the LSMA components to form a composite - recommended to adjust to your timeframe and asset/pair accordingly.
Divergence component from JustUncle, RicardoSantos, and Neobutane divergence scripts
Crossover indication and alerts for Midline, and custom M1 and M2 levels for both RSX and the LSMA-D line from Daveatt's CCI Stochastic Script
EMA21/55 zone cross highlighting option
SMA9/EMA45 MA option from my RSI sma/ema Cu script
Libertus Divergences and Pivot labels from Jaggedsoft's RSX Divergence script are hidden/off by default
Designed for darkmode by default. Minor visual changes from Jaggedsoft's and Everget's script(s) for darkmode and visual aesthetic.
Please Note:
Divergences that use fractal-based detection logic, offset, or a combination of both generally have a 1-2 bar/candle lag. This is an INHERENT limitation of divergence detection with fractals and offsets. Divergences generally will have a higher strikerate on HTF than LTF due to the 1-2 bar lag. While I'm not going to rule out a programming solution or math construct/formula that attempts to alleivates the 1-2 bar lag for divergences, this script is not it - please keep that in mind when using divergence components with a fractal base and offset.
LSMA-D is a composite of three LSMA lines, all with offset options. Different lengths and Offset values can compensate/adjust for the smoothing/latency from RSX, but only up to a certain point. For each LSMA, the least square regression line is calculated for the previous time periods, so the idea is that with finely tuned adjustments, you can get crossover/crossunder signals from the RSX with the LSMA-D line that you simply can't get with the SMA9/EMA45 due to the already smoothed RSX.
The defaults for the RSX and various components for the LSMA-D here will MOSTLY LIKELY NOT WORK OR BE APPLICABLE to every timeframe and asset that you trade - adjust, backtest, and test accordingly. The defaults are here are MEANT to be adjusted to the asset class and timeframe that you are trading.
If you're not familiar with the LSMA, tradingview author Alexgrover has a few great scripts that go into detail how the LSMA works, in addition to different interpretations and implementations of the LSMA.
References/Acknowledgements:
//@version=4
// Copyright (c) 2019-present, Alex Orekhov (everget)
// Jurik RSX script may be freely distributed under the MIT license.
//
//-------------------------------------------------------------------
// Acknowledgements:
//---- Base script:
// RSX Divergence — SharkCIA by Jaggedsoft
//
// Jurik Moving Average by Everget
//
//---- Divergences/Signals:
// Libertus RSI Divergences
//
// Price Divergence Dectector V3 by JustUncle
//
// Price Divergence Detector V2 by RicardoSantos
//
// Stochastic RSI with Divergences by Neobutane
//
// CCI Stochastic by Daveatt
//
//---- Misc. Reference:
// RSI SMA/EMA Cu by Auroagwei
//
// CBCI Cu by Auroagwei
//
// Chop and explode by fhenry0331
//
// T-Step LSMA by RafaelZioni
//
// Scripts by Jaggedsoft for structure and formatting
// Scripts by Everget for structure and formatting
//-------------------------------------------------------------------
// RSX-D v08
// Author: Auroagwei
// www.tradingview.com
//-------------------------------------------------------------------
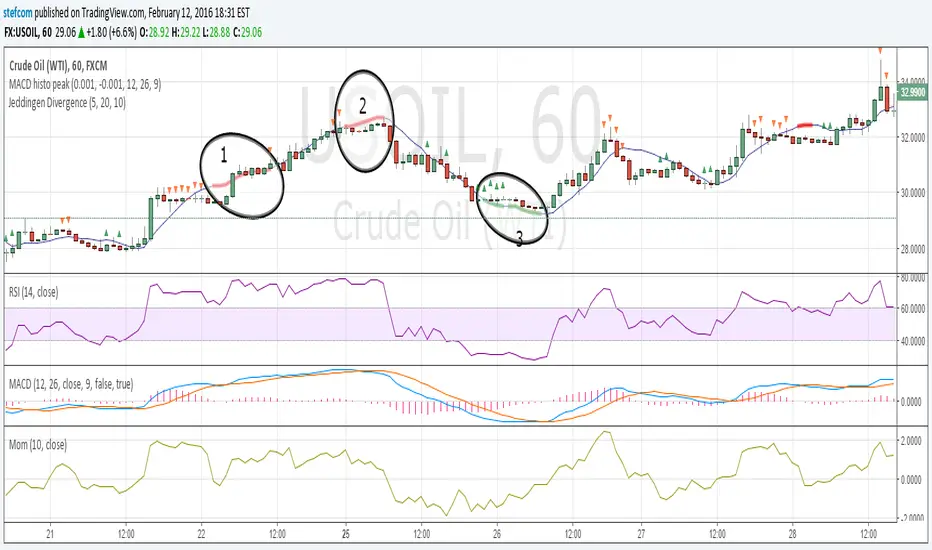
Stefan Krecher: Jeddingen DivergenceThe main idea is to identify a divergence between momentum and price movement. E.g. if the momentum is rising but price is going down - this is what we call a divergence. The divergence will be calculated by comparing the direction of the linear regression curve of the price with the linear regression curve of momentum.
A bearish divergence can be identified by a thick red line, a bullish divergence by a green line.
When there is a divergence, it is likeley that the current trend will change it's direction.
Looking at the chart, there are three divergences that need to get interpreted:
1) bearish divergence, RSI is overbought but MACD does not clearly indicate a trend change. Right after the divergence, price and momentum are going up. No clear signal for a sell trade
2) bearish divergence, RSI still overbought, MACD histogram peaked, MACD crossed the signal line, price and momentum are going down. Very clear constellation for a sell trade.
3) two bullish diverences, RSI is oversold, MACD crossover near the end of the second divergence, price and momentum started rising. Good constellation for a buy trade. Could act as exit signal for the beforementioned sell trade.
More information on the Jeddingen Divergence is available here: www.forexpython.com
Larry Williams POIV A/D [tradeviZion]Larry Williams' POIV A/D - Release Notes v1.0
=================================================
Release Date: 01 April 2025
OVERVIEW
--------
The Larry Williams POIV A/D (Price, Open Interest, Volume Accumulation/Distribution) indicator implements Williams' original formula while adding advanced divergence detection capabilities. This powerful tool combines price movement, open interest, and volume data to identify potential trend reversals and continuations.
FEATURES
--------
- Implements Larry Williams' original POIV A/D formula
- Divergence detection system:
* Regular divergences for trend reversal signals
* Hidden divergences for trend continuation signals
- Fast Mode option for earlier pivot detection
- Customizable sensitivity for divergence filtering
- Dynamic color visualization based on indicator direction
- Adjustable smoothing to reduce noise
- Automatic fallback to OBV when Open Interest is unavailable
FORMULA
-------
POIV A/D = CumulativeSum(Open Interest * (Close - Close ) / (True High - True Low)) + OBV
Where:
- Open Interest: Current period's open interest
- Close - Close : Price change from previous period
- True High - True Low: True Range
- OBV: On Balance Volume
DIVERGENCE TYPES
---------------
1. Regular Divergences (Reversal Signals):
- Bullish: Price makes lower lows while indicator makes higher lows
- Bearish: Price makes higher highs while indicator makes lower highs
2. Hidden Divergences (Continuation Signals):
- Bullish: Price makes higher lows while indicator makes lower lows
- Bearish: Price makes lower highs while indicator makes higher highs
REQUIREMENTS
-----------
- Works best with futures and other instruments that provide Open Interest data
- Automatically adapts to work with any instrument by using OBV when OI is unavailable
USAGE GUIDE
-----------
1. Apply the indicator to any chart
2. Configure settings:
- Adjust sensitivity for divergence detection
- Enable/disable Fast Mode for earlier signals
- Customize visual settings as needed
3. Look for divergence signals:
- Regular divergences for potential trend reversals
- Hidden divergences for trend continuation opportunities
4. Use the alerts system for automated divergence detection
KNOWN LIMITATIONS
----------------
- Requires Open Interest data for full functionality
- Fast Mode may generate more signals but with lower reliability
ACKNOWLEDGEMENTS
---------------
This indicator is based on Larry Williams' work on Open Interest analysis. The implementation includes additional features for divergence detection while maintaining the integrity of the original formula.

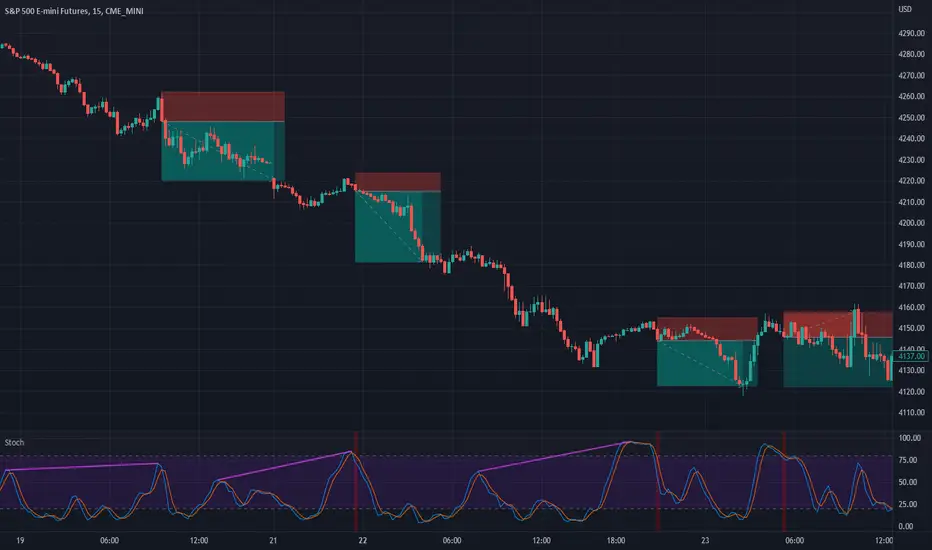
Stochastic with DivergencesReuploading as there was an issue with the description.
This indicator uses the popular Stochastic indicator as its base. I have included the ability to draw divergences on the indicator as they occur live. By default it will be off, select the settings for the indicator and about halfway down there will be a dropdown menu that says "Off". Select it and then select which divergences you want to draw: Regular, Hidden, or Both. I like to draw both. I find that hidden divergence is really nice during a trending market and the regular divergence is works great in a range market. I also feel that the regular divergence is great during a trending market if you are given the signal but then wait for the next price movement for a double top/bottom to occur. The Stochastic indicator itself is often used in a ranging market by selling when it is overbought and buying once it indicates oversold (much like the RSI indicator). I find that it can work in trending markets if you only take overbought in a down trend and oversold in an up trend. In the above picture you can see that I had used it to trade this downtrend using both the Hidden Divergence and Sell Signals to catch the trend continuation until it failed on the fourth trade. From here I would usually start using the Stochastic as simply an oscillating indicator and buy/sell based on overbought/oversold. I've also added an option to enable the Stochastic RSI if you'd rather use that, as well as a fill option which simply colors in the space between the Stochastic and Signal lines. The Signals option will put on highlights of when to buy or sell based on overbought/oversold areas that agree with the long term trend (based on the 200 EMA).
Divergence is a short way of saying there was a higher or lower movement compared to normal but the price did not represent that movement, indicating strength or weakness in a specific direction.
Regular divergence is an indication of a trend reversal. Regular bullish divergence occurs when the price chart shows a lower low while the stochastic shows a higher low. Regular bearish divergence occurs when the price chart shows a higher high while the stochastic shows a lower high.
Hidden divergence is an indication of a trend continuation. Hidden bullish divergence occurs when the price chart shows a higher low while the stochastic shows a lower low. Hidden bearish divergence occurs when the price chart shows a lower high while the stochastic shows a higher high.
The "Only Trending Divergences" option, if enabled, will only show bearish divergences during a down trend (price is below 200 EMA) and only show bullish divergences during an uptrend (price is above 200 EMA). I like to use this option and have set it to ON by default.
The "Middle Filter" option, if enabled, ensures that Highs on the stochastic indicator will not be counted as Highs unless they are above the middle value of the oscillator (which is 50), same goes for lows: they will not be counted as Lows unless they are below the middle value of the oscillator.
I also include buy/sell signals that coincide with the trend (based on the 200 EMA). If price is currently below the 200 EMA and the stochastic indicator is overbought (over 80), you can get a sell signal when it the blue line crosses down below 80. This sell signal shows that you are in a down trend and the price just was overbought but is now likely to continue pushing downwards. The opposite works for buy signals: Above 200 EMA, stochastic goes below 20, when it crosses above 20 it will show a green highlight to indicate price is likely to push upwards.
I think the default options are likely the best to use. The only one I tend to change on occasion is the "Pivots to look back" which I adjust usually to either 1 or 3.
VR Volume Ratio + Divergence (Pro)成交量比率 (Volume Ratio, VR) 是一項通過分析股價上漲與下跌日的成交量,來研判市場資金氣氛的技術指標。本腳本基於傳統 VR 公式進行了優化,增加了**「趨勢變色」與「自動背離偵測」**功能,幫助交易者更精準地捕捉量價轉折點。
Introduction
Volume Ratio (VR) is a technical indicator that measures the strength of a trend by comparing the volume on up-days versus down-days. This script enhances the classic VR formula with "Trend Color Coding" and "Auto-Divergence Detection", helping traders identify volume-price reversals more accurately.
核心功能與參數
公式原理: VR = (Qu + Qf/2) / (Qd + Qf/2) * 100
Qu: 上漲日成交量 (Up volume)
Qd: 下跌日成交量 (Down volume)
Qf: 平盤日成交量 (Flat volume)
參數 (Length):預設為 26 日,這是市場公認最有效的短中線參數。
關鍵水位線 (Key Levels):
< 40% (底部區):量縮極致,市場情緒冰點,常對應股價底部,適合尋找買點。
100% (中軸):多空分界線。
> 260% (多頭警戒):進入強勢多頭行情,但需注意過熱。
> 450% (頭部區):成交量過大,市場情緒亢奮,通常為頭部訊號。
視覺優化 (Visuals):
紅漲綠跌:當 VR 數值大於前一日顯示為紅色(動能增強);小於前一日顯示為綠色(動能退潮)。
背離訊號 (Divergence):自動標記量價背離。
▲ 底背離 (Bullish):股價創新低,但 VR 指標墊高(主力吸籌)。
▼ 頂背離 (Bearish):股價創新高,但 VR 指標走弱(買氣衰竭)。
Features & Settings
Formula Logic: Calculated as VR = (Qu + Qf/2) / (Qd + Qf/2) * 100.
Default Length: 26, widely regarded as the optimal setting for short-to-medium term analysis.
Key Zones:
< 40% (Oversold/Bottom): Extreme low volume, often indicating a market bottom and potential buying opportunity.
100% (Neutral): The balance point between bulls and bears.
> 260% (Bullish Zone): Strong uptrend, volume is expanding.
> 450% (Overbought/Top): Extreme high volume, often indicating a market top and potential reversal.
Visual Enhancements:
Color Coding: Line turns Red when VR rises (Momentum Up) and Green when VR falls (Momentum Down).
Divergence Signals: Automatically marks divergence points on the chart.
▲ Bullish Divergence: Price makes a lower low, but VR makes a higher low (Accumulation).
▼ Bearish Divergence: Price makes a higher high, but VR makes a lower high (Distribution).
應用策略建議
抄底策略:當 VR 跌破 40% 後,指標線由綠翻紅,或出現「▲底背離」訊號時,為極佳的波段進場點。
逃頂策略:當 VR 衝過 450% 進入高檔區,一旦指標線由紅翻綠,或出現「▼頂背離」訊號時,建議分批獲利了結。
Strategy Guide
Bottom Fishing: Look for entries when VR drops below 40% and turns red, or when a "▲ Bullish Divergence" label appears.
Taking Profit: Consider selling when VR exceeds 450% and turns green, or when a "▼ Bearish Divergence" label appears.
Disclaimer: This tool is for informational purposes only and does not constitute financial advice. / 本腳本僅供參考,不構成投資建議。

Z-EMA Fusion BandsDesigned with crypto markets in mind, particularly Bitcoin , it builds on the concept that the 1-Week 50 EMA often serves as a long-term bull/bear market threshold — an area where institutional bias, momentum shifts, and cyclical rotations tend to occur.
🔹 Core Components & Synergies:
1. 1W 50 EMA (Higher Timeframe)
- This EMA is calculated on a weekly timeframe, regardless of your current chart.
- In crypto, price above the 1W 50 EMA typically aligns with long-term bull market phases, while extended periods below can signify bearish macro structure.
- The slope of the EMA is also analyzed to add directional confidence to trend strength.
2. ±1 Standard Deviation Bands
- Surrounding the 50 EMA, these bands visualize normal price dispersion relative to trend.
- When price consistently hugs or breaks outside these bands, it often reflects market expansion, volatility events, or mean-reversion opportunity.
3. Z-Score Gradient Fill
- The area between the bands is filled using a Z-score-based gradient, which dynamically adjusts color based on how far price is from the EMA (in terms of standard deviations).
- Color shifts from aqua (near EMA) to fuchsia (far from EMA) help you spot price compression, equilibrium, or overextension at a glance.
- The fill also uses transparency scaling, making it fade as price stretches further, emphasizing the core structure.
4. Directional EMA Coloring
- The EMA line itself is colored based on:
- The slope of the EMA (rising/falling)
- Whether the HTF candle is bullish or bearish
- This provides intuitive color-coded confirmation of momentum alignment or potential exhaustion.
5. Price/EMA Divergence Detection
- The script detects bullish and bearish divergence between price and the EMA (rather than using a traditional oscillator).
- Bullish Divergence: Price makes a lower low, EMA makes a higher low.
- Bearish Divergence: Price makes a higher high, EMA makes a lower high.
- These signals often mark transitional zones where momentum fades before a trend reversal or correction.
📊 Suggested Uses:
🔸 Swing and Position Trading:
- Use the 1W 50 EMA as a macro-trend anchor.
- Stay long-biased when price is above with positive slope, and short-biased when below.
- Consider entries near band edges for mean-reversion plays, especially if confluence forms with divergence signals.
🔸 Volatility-Based Filtering:
- Use the Z-score fill to identify volatility compression (near EMA) or expansion (edge of bands).
- Combine this with breakout strategies or dynamic position sizing.
🔸 Divergence Confirmation:
- Combine divergence markers with HTF EMA slope for high-probability setups.
- Bullish div + EMA flattening/rising can signal the start of accumulation after a macro dip.
🔸 Multi-Timeframe Analysis:
- Works well as a structural overlay on intraday charts (1H, 4H, 1D).
- Use this indicator to track long-term bias while executing lower timeframe trades.
⚠️ Disclaimer:
This indicator is designed for educational and informational purposes only. It does not constitute financial advice or a recommendation to buy or sell any asset.
Always use proper risk management, and combine with your own analysis, tools, and strategy. Performance in past market conditions does not guarantee future results.

Weighted RSI DivergenceWeighted RSI Divergence
A powerful divergence engine that grades every RSI divergence by strength, context, and confluence — helping you filter noise and focus only on the highest-probability reversal setups.
This script combines RSI divergences with five confirmation layers to produce confidence-weighted signals, clearer trade decisions, and alert-ready setups for both bullish and bearish reversals.
What This Indicator Detects
Bullish Divergence → Price makes a lower low while RSI makes a higher low
Bearish Divergence → Price makes a higher high while RSI makes a lower high
Confirmation Factors (Each Adds +1 to the Score)
Volume Spike: Above-average volume on the divergence bar
Trend Alignment: Divergence occurs in harmony with higher-timeframe trend dynamics
Key Level Proximity: Price tests significant support or resistance
Momentum Extremes: RSI reaches oversold/overbought thresholds
Candle Reversal Pattern: Engulfing, pin bar, or similar reversal structure
Confidence Scoring
1–2 → Low Confidence (gray)
3 → Medium Confidence (yellow)
4–5 → High Confidence (green/red)
Higher scores = higher-probability setups.
Visual Components
RSI plot with dynamic gradient coloring
Divergence lines mapped to RSI pivots
Signal labels showing confidence + factors
Background highlighting for high-confidence events
Real-time confidence meter for active bar conditions
Optional data table for factor-by-factor breakdown
Alerts Included
High-confidence bullish & bearish divergences
Medium-confidence signals
Any divergence meeting your minimum threshold
Best Practices
Prioritize setups with 4 or 5 confirmations
Use higher timeframes (4H, 1D, 1W) for more reliable signals
Combine with market structure and price action (S/R, HTF trend, liquidity zones)
Counter-trend divergences require stronger scores to validate
Final Notes
This script focuses on clarity, risk reduction, and selective trade timing. The confidence system helps distinguish weak divergences from high-probability reversal conditions — giving traders a structured, repeatable edge.

RSI Divergence (Regular + Hidden, @darshakssc)This indicator detects regular and hidden divergence between price and RSI, using confirmed swing highs and swing lows (pivots) on both series. It is designed as a visual analysis tool, not as a signal generator or trading system.
The goal is to highlight moments where price action and RSI momentum move in different directions, which some traders study as potential early warnings of trend exhaustion or trend continuation. All divergence signals are only drawn after a pivot is fully confirmed, helping to avoid repainting.
The script supports four divergence types:
Regular Bullish Divergence
Regular Bearish Divergence
Hidden Bullish Divergence
Hidden Bearish Divergence
Each type is drawn with a different color and labeled clearly on the chart.
Core Concepts Used
1. RSI (Relative Strength Index)
The script uses standard RSI, calculated on a configurable input source (default: close) and length (default: 14).
RSI is treated purely as a momentum oscillator – the script does not enforce oversold/overbought interpretations.
2. Pivots / Swings
The indicator defines swing highs and swing lows using ta.pivothigh() and ta.pivotlow():
A swing high forms when a bar’s high is higher than a specified number of bars to the left and to the right.
A swing low forms when a bar’s low is lower than a specified number of bars to the left and to the right.
The same pivot logic is applied to both price and RSI.
Because pivots require “right side” bars to form, the indicator:
Waits for the full pivot to be confirmed (no forward-looking referencing beyond the rightBars parameter).
Only then considers that pivot for divergence detection.
This helps prevent repainting of divergence signals.
How Divergence Is Detected
The script always uses the two most recent confirmed pivots for both price and RSI. It tracks:
Last two swing lows in price and RSI
Last two swing highs in price and RSI
Their pivot bar indexes and values
A basic minimum distance filter between the pivots (in bars) is also applied to reduce noise.
1. Regular Bullish Divergence
Condition:
Price makes a lower low (LL) between the last two lows
RSI makes a higher low (HL) over the same two pivot lows
The RSI difference between the two lows is greater than or equal to the user-defined minimum (Min RSI Difference)
The two low pivots are separated by at least Min Bars Between Swings
Interpretation:
Some traders view this as bearish momentum weakening while price prints a new low. The script only marks this structure; it does not assume any outcome.
On the chart:
Drawn between the previous and current price swing lows
Labeled: “Regular Bullish”
Color: Green (by default in the script)
2. Regular Bearish Divergence
Condition:
Price makes a higher high (HH) between the last two highs
RSI makes a lower high (LH) over the same two pivot highs
RSI difference exceeds Min RSI Difference
Pivots are separated by at least Min Bars Between Swings
Interpretation:
Some traders see this as bullish momentum weakening while price prints a new high. Again, the indicator simply highlights this divergence.
On the chart:
Drawn between the previous and current price swing highs
Labeled: “Regular Bearish”
Color: Red
3. Hidden Bullish Divergence
Condition:
Price makes a higher low (HL) between the last two lows
RSI makes a lower low (LL) over the same two lows
RSI difference exceeds Min RSI Difference
Pivots meet the minimum distance requirement
Interpretation:
Some traders interpret hidden bullish divergence as a potential trend continuation signal within an existing uptrend. The indicator does not classify trends; it just tags the pattern when price and RSI pivots meet the conditions.
On the chart:
Drawn between the previous and current price swing lows
Labeled: “Hidden Bullish”
Color: Teal
4. Hidden Bearish Divergence
Condition:
Price makes a lower high (LH) between the last two highs
RSI makes a higher high (HH) over those highs
RSI difference exceeds Min RSI Difference
Pivots meet the minimum distance filter
Interpretation:
Some traders associate hidden bearish divergence with potential downtrend continuation, but again, this script only visualizes the structure.
On the chart:
Drawn between the previous and current price swing highs
Labeled: “Hidden Bearish”
Color: Orange
Inputs and Settings
1. RSI Settings
RSI Source – Price source for RSI (default: close).
RSI Length – Period for RSI calculation (default: 14).
These control the responsiveness of the RSI. Shorter lengths may show more frequent divergence; longer lengths smooth the signal.
2. Swing / Pivot Settings
Left Swing Bars (leftBars)
Right Swing Bars (rightBars)
These define how strict the pivot detection is:
Higher values → fewer, more significant swings
Lower values → more swings, more signals
Because the script uses ta.pivothigh / ta.pivotlow, a pivot is only confirmed once rightBars candles have closed after the candidate bar. This is an intentional design to reduce repainting and make pivots stable.
3. Divergence Filters
Min Bars Between Swings (Min Bars Between Swings)
Requires a minimum bar distance between the two pivots used to form divergence.
Helps avoid clutter from pivots that are too close to each other.
Min RSI Difference (Min RSI Difference)
Requires a minimum absolute difference between RSI values at the two pivots.
Filters out very minor changes in RSI that may not be meaningful.
4. Visibility Toggles
Show Regular Divergence
Show Hidden Divergence
You can choose to display:
Both regular and hidden divergence, or
Only regular divergence, or
Only hidden divergence
This is useful if you prefer to focus on one type of structure.
5. Alerts
Enable Alerts
When enabled, the script exposes four alert conditions:
Regular Bullish Divergence Confirmed
Regular Bearish Divergence Confirmed
Hidden Bullish Divergence Confirmed
Hidden Bearish Divergence Confirmed
Each alert fires after the corresponding divergence has been fully confirmed based on the pivot and bar confirmation logic. The script does not issue rapid or intrabar signals; it uses confirmed historical conditions.
You can set these in the TradingView Alerts dialog by choosing this indicator and selecting the desired condition.
Visual Elements
On the main price chart, the indicator:
Draws a line between the two price pivots involved in the divergence.
Adds a small label at the latest pivot, describing the divergence type.
Colors are used to differentiate divergence categories (Green/Red/Teal/Orange).
This makes it easy to visually scan the chart for zones where price and RSI have diverged.
What to Look For (Analytical Use)
This indicator is intended as a visual helper, especially when:
You want to quickly see where price made new highs or lows while RSI did not confirm them in the same way.
You are studying momentum exhaustion, shifts, or continuation using RSI divergence as one of many tools.
You want to compare divergence occurrences across different timeframes or instruments.
Important:
The indicator does not tell you when to enter or exit trades.
It does not rank or validate the “quality” of a divergence.
Divergence can persist or fail; it is not a guarantee of reversal or continuation.
Many traders combine divergence analysis with:
Higher timeframe context
Trend filters (moving averages, structure)
Support/resistance zones or liquidity areas
Volume, structure breaks, or other confirmations
Disclaimer
This script is provided for educational and analytical purposes only.
It does not constitute financial advice, trading advice, or investment recommendations.
No part of this indicator is intended to suggest, encourage, or guarantee any specific trading outcome.
Users are solely responsible for their own decisions and risk management.

Volume Delta Oscillator with Divergence█ OVERVIEW
The Volume Delta Oscillator with Divergence is a technical indicator designed for the TradingView platform, helping traders identify potential trend reversal points and market momentum shifts through volume delta analysis and divergence detection. The indicator combines a smoothed volume delta oscillator with moving average-based signals, overbought/oversold levels, and divergence visualization, enhanced by configurable gradients and alerts for quick decision-making.
█ CONCEPT
The core idea of the indicator is to measure net buying or selling pressure through volume delta, smooth it for greater clarity, and detect divergences between price action and the oscillator. The indicator does not use external data, making it a compromise but practical tool for analyzing market dynamics based on available price and volume data. It provides insights into market dynamics, overbought/oversold conditions, and potential reversal points, with an attractive visual presentation.
█ WHY USE IT?
- Divergence detection: Identifies bullish and bearish divergences between price and the oscillator, signaling potential reversals.
- Volume delta analysis: Measures cumulative volume delta to assess buying/selling pressure, expressed as a percentage for cross-market comparability.
- Signal generation: Creates buy/sell signals based on overbought/oversold level crossovers, zero line crossovers, and moving average zero line crossovers.
- Visual clarity: Uses gradients, fills, and dynamic colors for intuitive chart analysis.
- Flexibility: Numerous settings allow adaptation to various markets (e.g., forex, crypto, stocks) and trading strategies.
█ HOW IT WORKS?
- Volume delta calculation: Computes net buying/selling pressure per candle as volume * (close - open) / (high - low), aggregated over a specified period (Cumulative Delta Length).
- Smoothing: Applies an EMA (Smoothing Length) to the cumulative delta percentage, creating a smoother oscillator (Delta Oscillator).
- Moving Average: Calculates an SMA (Moving Average Length) of the smoothed delta for trend confirmation (Moving Average (SMA)).
- Divergence detection: Identifies bullish and bearish divergences by comparing price and oscillator pivot highs/lows within a specified range (Pivot Length).
- Normalization: Delta is expressed as a percentage of total volume, ensuring consistency across instruments and timeframes.
- Signals: Generates signals for:
Crossing the oversold level upward (buy) or overbought level downward (sell).
Crossing the zero line by the oscillator or moving average (buy/sell).
Bullish/bearish divergences, marked with labels.
- Visualization: Draws the oscillator and moving average with dynamic colors, gradient fills, and transparent bands and labels, with configurable overbought/oversold levels.
- Alerts: Built-in alerts for divergence detection, overbought/oversold crossovers, and zero line crossovers (both oscillator and moving average).
█ SETTINGS AND CUSTOMIZATION
- Cumulative Delta Length: Period for aggregating volume delta (default: 14).
- Smoothing Length (EMA): EMA length for smoothing the delta oscillator (default: 2). Higher values smooth the signal but reduce the number of generated signals.
- Moving Average Length (SMA): SMA length for the moving average line (default: 40). Higher values allow SMA to be analyzed as a trend indicator, but require adjusting overbought/oversold levels for MA, as longer MA oscillates less.
- Pivot Length (Left/Right): Number of candles for detecting pivot highs/lows in divergence calculations (default: 2). Higher values can reduce noise but introduce a delay equal to the set value.
- Overbought/Oversold Levels: Thresholds for the oscillator (default: 18/-18) and for the moving average (default: 10/-10). For the moving average, no arrows appear; instead, the band changes color from gray to green (oversold) or red (overbought), which can strengthen entry signals for delta.
- Signal Type: Select signals to display: "Overbought/Oversold", "Zero Line", "MA Zero Line", "All", or "None" (default: Overbought/Oversold).
- Colors and gradients: Customize colors for bullish/bearish oscillator, moving average, zero line, overbought/oversold levels, and divergence labels.
- Transparency: Adjust gradient fill transparency (default: 70) and band/label transparency (default: 40) for consistent appearance.
- Visualizations: Enable/disable the moving average, gradients for zero/overbought/oversold levels, and gradient fills.
█ USAGE EXAMPLES
- Momentum analysis: Observe the delta oscillator above 0 for bullish momentum or below 0 for bearish momentum. The moving average (SMA), being smoothed, reacts more slowly and can confirm trend direction as a noise filter.
- Reversal signals: Look for buy triangles when the oscillator crosses the oversold level upward, especially when the moving average is below the MA oversold threshold. Similarly, look for sell triangles when crossing the overbought level downward, with the moving average above the MA overbought threshold. Divergence labels (bullish/bearish) indicate potential reversals.
- Divergence trading: Use bullish divergence labels (green) for potential buy opportunities and bearish labels (red) for sell opportunities, especially when confirmed by price action or other indicators.
- Customization: Adjust the cumulative delta length, smoothing, and moving average length to specific instruments and timeframes to minimize false signals.
█ NOTES FOR USERS
- Combine the indicator with other tools, such as Fibonacci levels, RSI, or pivot points, to increase accuracy.
- Test different settings for cumulative delta length, smoothing, and moving average length on your chosen instrument and timeframe to find optimal values.

SMT Divergence x outofoptions🔍 SMT Divergence — Advanced Market Correlation Analysis
This was created with and approved by @outofoptions to bring you smaller SMTs based on his original SMT Divergence indicator
SMT Divergence is a sophisticated technical analysis indicator designed to identify high-probability reversal and continuation signals through intelligent correlation analysis between related markets. This powerful tool reveals hidden market dynamics by comparing price action divergences across correlated instruments, providing traders with institutional-level market insight.
🎯 Core Capabilities:
Multi-Market Analysis : Automatically compares your chart with a correlated instrument to identify divergence patterns and market inefficiencies
Smart Liquidity Detection : Advanced algorithms identify key liquidity levels and sweep patterns for enhanced signal accuracy
Dynamic Divergence Mapping : Real-time visualization of bullish and bearish divergences with customizable line styles and colors
Intelligent Signal Validation : Optional candle-based confirmation system to filter high-probability setups from noise
Automated Line Management : Smart removal of invalidated divergences to maintain clean, actionable chart analysis
📊 Professional Features:
The SMT Divergence indicator excels at revealing market structure imbalances that often precede significant price movements. By analyzing the relationship between correlated markets, it identifies when institutional money may be positioned differently than retail sentiment suggests, providing early warning signals for potential reversals.
⚙️ Advanced Customization:
Flexible correlation pair selection for any market combination
Customizable visual styling with multiple line types and color schemes
Adjustable validation criteria for different trading styles
Professional alert system with detailed message customization
Automatic cleanup of broken or invalidated divergences
🎨 Visual Excellence:
Clean, professional line drawing with customizable styling
Dynamic labeling system with size and color options
Real-time divergence tracking and management
Institutional-grade chart presentation
Optimized performance for extended analysis periods
📈 Ideal For:
Swing traders seeking high-probability reversal signals
Multi-market analysts comparing correlated instruments
Institutional-style traders using correlation analysis
Advanced technical analysts studying market structure
Those seeking early warning signals for trend changes
🔔 Smart Alerts:
Comprehensive alert system with customizable messaging allows you to stay informed of new divergences across multiple timeframes and market sessions, ensuring you never miss critical market developments.
💡 Market Intelligence:
SMT Divergence transforms complex inter-market relationships into clear, actionable signals, giving you the same analytical edge used by professional trading institutions to identify market turning points before they become obvious to retail traders.
Educational Tool: This indicator is designed for educational and analytical purposes. Divergence analysis requires understanding of market correlation principles. Always combine with proper risk management and additional analysis methods.

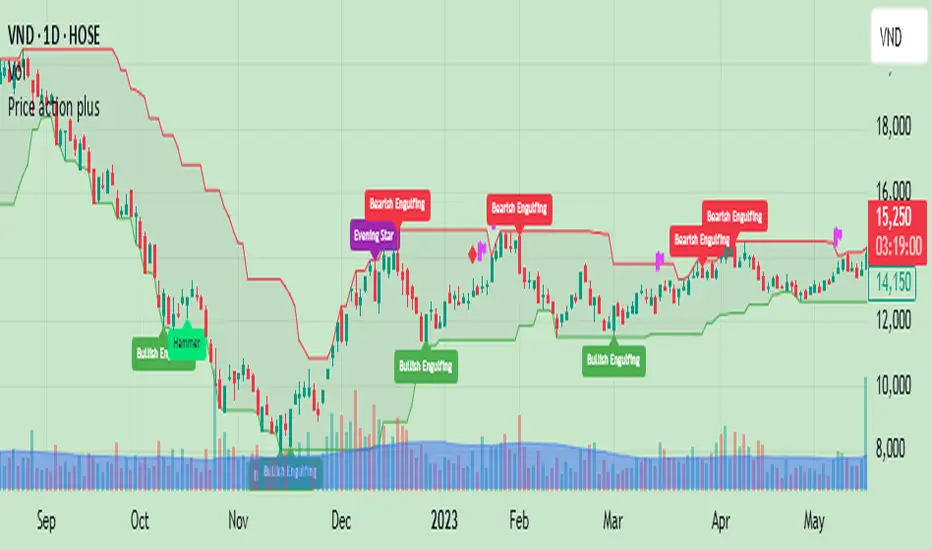
Price action plus//The system combines the divergence of A/D and OBV with identifying reversal points using Japanese candlestick patterns, creating an enhanced version of price action. This helps investors more easily and accurately recognize reversal patterns in technical analysis.
Divergence of A/D vs. OBV includes:
Positive divergence: Identifies smart money leaving the market.
Negative divergence: Identifies smart money entering the market.
Reversal candlestick patterns include:
Buy signals: Morning Star, Bullish Engulfing, Hammer.
Strong Buy signals: Buy signals + Negative divergence
Sell signals: Evening Star, Bearish Engulfing, Shooting Star.
Strong Sell signals : Sell signals + Positive divergence
//Hope this system will be helpful for you!
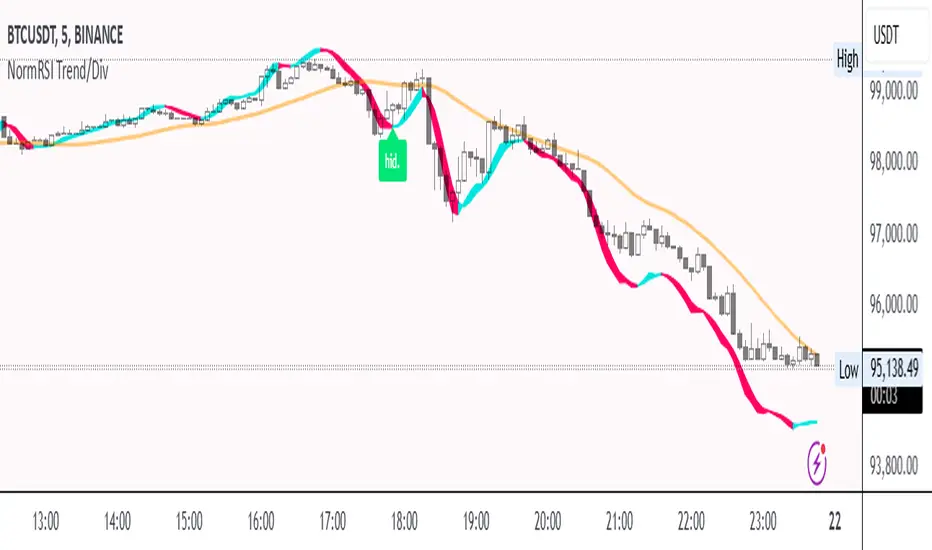
Normalized RSI Trendline with DivergencesNormalized RSI Trendline with Divergences
🔹 Overview
The Normalized RSI Trendline with Divergences indicator enhances traditional RSI analysis by normalizing RSI values within a defined range and applying a trend-following approach. It also detects bullish and bearish divergences to highlight potential trend reversals.
🔹 Features
✔ Normalized RSI Calculation – The RSI values are normalized between -1 and 1 to provide a clearer representation of market momentum.
✔ Trend & Center Lines – A trendline based on linear regression and an adaptive moving average (ALMA) for smoother trend visualization.
✔ Divergence Detection – Identifies regular and hidden divergences, displaying signals directly on the chart.
✔ Customizable Parameters – Users can adjust the signal period, lookback range, trend length, and divergence sensitivity to fit different trading strategies.
🔹 How to Use
Trend Following: The trendline helps identify the overall market direction.
Divergence Signals:
🟢 Bullish Divergence (Potential upward reversal)
🔴 Bearish Divergence (Potential downward reversal)
🟩 Hidden Bullish Divergence (Trend continuation signal)
🟧 Hidden Bearish Divergence (Trend continuation signal)
This script is suitable for trend traders, swing traders, and divergence-based strategies. Customize the settings to match your preferred trading style. 🚀
📌 Disclaimer: This script is for educational purposes only and does not constitute financial advice. Always conduct your own analysis before making trading decisions.
RSI BB StdDev SignalOverview
The RSI BB StdDev Signal Indicator is a powerful tool designed to enhance your trading strategy by combining the Relative Strength Index (RSI) with Bollinger Bands (BB). This unique combination allows traders to identify potential buy and sell signals more accurately by leveraging the strengths of both indicators. The RSI helps in identifying overbought and oversold conditions, while the Bollinger Bands provide a dynamic range to assess volatility and potential price reversals.
Key Features
— RSI Calculation: The indicator calculates the RSI based on user-defined parameters, allowing for customization to fit different trading styles.
— Bollinger Bands Integration: The RSI values are smoothed using a moving average, and Bollinger Bands are applied to this smoothed RSI to generate buy and sell signals.
— Divergence Detection: The indicator includes an optional feature to detect and alert on bullish and bearish divergences between the RSI and price action.
— Customizable Alerts: Users can set up alerts for buy and sell signals, as well as for divergences, ensuring they never miss a trading opportunity.
— Visual Aids: The indicator plots the RSI, Bollinger Bands, and signals on the chart, making it easy to visualize and interpret the data.
How It Works
1. RSI Calculation:
— The RSI is calculated using the change in the source input (default is close price) over a specified period.
— The RSI values are then plotted on the chart with customizable overbought and oversold levels.
2. Smoothing and Bollinger Bands:
— The RSI values are smoothed using a moving average (SMA, EMA, SMMA, WMA, VWMA) selected by the user.
— Bollinger Bands are applied to the smoothed RSI to create dynamic upper and lower bands.
3. Signal Generation:
—Buy signals are generated when the RSI crosses above the lower Bollinger Band.
—Sell signals are generated when the RSI crosses below the upper Bollinger Band.
—These signals are plotted on both the RSI pane and the main price chart for easy reference.
4. Divergence Detection:
— The indicator can detect and alert on regular bullish and bearish divergences between the RSI and price action.
— Bullish divergences occur when the price makes a lower low, but the RSI makes a higher low.
— Bearish divergences occur when the price makes a higher high, but the RSI makes a lower high.
Usage
1. Setting Up:
— Add the indicator to your TradingView chart.
— Customize the RSI length, source, and other parameters in the settings panel.
— Enable or disable the divergence detection based on your trading strategy.
2. Interpreting Signals:
— Use the buy and sell signals generated by the RSI crossing the Bollinger Bands as potential entry and exit points.
— Pay attention to divergences for additional confirmation of trend reversals.
3. Alerts:
— Set up alerts for buy and sell signals to receive notifications in real-time.
— Enable divergence alerts to be notified of potential trend reversals.
Conclusion
The RSI BB StdDev Signal Indicator is a comprehensive tool that combines the strengths of the RSI and Bollinger Bands to provide traders with more accurate and reliable signals. Whether you are a beginner or an experienced trader, this indicator can enhance your trading strategy by offering clear visual cues and customizable alerts.
Note
This indicator is provided with open-source code, allowing users to understand its logic and customize it further if needed. The detailed description and customizable settings ensure that traders of all levels can benefit from its unique features.

RSI Overlay Table with Pivot-Based Divergence and SortingThis script offers an advanced RSI-based overlay table designed to identify and highlight divergences across multiple timeframes (Daily, Weekly, Monthly) for up to 13 tickers. It employs a pivot-based detection mechanism that spots positive and negative divergences, helping traders identify potential trend reversals or continuations.
Key Features
1. Pivot-Based Divergence Detection:
The script uses pivot points to identify both positive and negative divergences using the RSI indicator and price movements.
User-adjustable pivot settings enhance detection sensitivity, providing traders with an opportunity to fine-tune divergence signals for different market conditions.
2. Multi-Timeframe Analysis:
Displays RSI values along with divergence signals for daily, weekly, and monthly timeframes.
Enables traders to monitor short-term, swing, and long-term trends on a single table, providing a comprehensive view.
3. Customizable Alerts and Visual Cues:
The script generates alerts whenever a divergence is detected, ensuring timely notifications.
Overbought and oversold levels are color-coded based on user-defined thresholds, with the "P-" and "N-" prefixes indicating positive and negative divergences, respectively.
4. User-Friendly Interface:
An intuitive table design allows for easy comparison of RSI levels and divergence signals across multiple tickers.
Offers customizable table positioning options (bottom left, center, right, or middle right) for convenient chart integration.
How to Use
Input Your Tickers: Add up to 13 tickers that you wish to monitor.
Adjust Pivot Settings: Fine-tune the 'Pivot Left Bars' and 'Pivot Right Bars' to optimize the pivot detection process.
Set Overbought/Oversold Levels: Define the RSI thresholds according to your trading strategy.
Enable Alerts: Receive notifications for divergence signals detected on any timeframe.
Concepts Underlying the Calculations
The script leverages the RSI (Relative Strength Index), a popular momentum indicator, to measure the velocity and magnitude of price changes. By comparing RSI values with pivot points, the script identifies divergences that suggest potential reversals. This method ensures more reliable signals than simple bar comparisons, as it accounts for broader market movements over time.
Why This Script Is Unique
This RSI overlay script stands out due to its multi-ticker, multi-timeframe divergence analysis and the use of pivot-based detection for higher accuracy. The integration of an alert system, combined with color-coded visual cues, makes it an actionable and comprehensive tool for traders.
Turkish Translation
RSI Overlay Tablosu - Pivot Tabanlı Uyumsuzluk ve Sıralama ile
Bu script, birden fazla zaman diliminde (Günlük, Haftalık, Aylık) 13 adede kadar seçilen hisse senetleri veya varlıklar için RSI tabanlı ayrışmaları belirleyen ve vurgulayan gelişmiş bir overlay tablosu sunar. Pivot tabanlı tespit mekanizması, trend dönüşlerini veya devamlarını belirlemeye yardımcı olacak şekilde pozitif ve negatif ayrışmaları tespit eder.
Özellikler
1. Pivot Tabanlı Uyumsuzluk Tespiti:
Pivot noktalarını kullanarak RSI göstergesi ve fiyat hareketleri arasındaki pozitif ve negatif uyumsuzlukları tespit eder.
Kullanıcı ayarlı pivot ayarları, uyumsuzluk sinyallerinin hassasiyetini artırır ve farklı piyasa koşullarına uygun hale getirir.
2. Çoklu Zaman Dilimi Analizi:
Günlük, haftalık ve aylık zaman dilimlerinde RSI değerlerini ve ayrışma sinyallerini gösterir.
Kısa vadeli, orta vadeli ve uzun vadeli trendleri tek bir tabloda izlemenize olanak tanır.
3. Kullanıcı Dostu Arayüz ve Uyarılar:
Pozitif ve negatif ayrışmaları tespit ettiğinde uyarılar oluşturur.
Kullanıcı tanımlı eşiklere göre aşırı alım ve aşırı satım seviyelerini renk kodlarıyla gösterir.
Nasıl Kullanılır
İzlemek istediğiniz varlıkları ekleyin (en fazla 13 adet).
Pivot ayarlarını yapılandırarak tespit işlemini optimize edin.
RSI eşik seviyelerini belirleyin ve uyarıları etkinleştirin.

Edri Extreme Points Buy & SellEDRI EXTREME POINTS BUY & SELL INDICATOR
This Buy and Sell (non-repainting) indicator uses signals based on the combined CCI/Momentum and RSI indicators and optional regular divergence.
The idea of the indicator is to look for a potential reversal after the price reached extreme points (overbought or oversold) and signals an entry when the price shows signs of momentum for reversal.
Optionally, it considers finding a divergence while RSI is at the extreme levels to improve the predictability of a possible reversal.
Additionally, the indicator includes a simple Mean Reversion visual on the chart to assist users in identifying extreme price levels and potential reversal opportunities. It features upper and lower bands that can be optionally plotted, showing calculated values where price bounces at those extreme levels.
The purpose of these bands is to help traders avoid getting trapped in the middle of a trend and to guide them to buy low and sell high. (It's important to note that this is purely a visual aid and does not impact the generation of trade signals.)
By utilizing the Mean Reversion bands alongside the entry conditions, traders can gain insights into potential price reversals and make more informed decisions about when to enter or exit trades.
Buy and Sell Entry conditions:
• The indicator looks at the CCI/Momentum indicator to turn positive (if buy) or negative (if sell) after the RSI was overbought or oversold in the recent past.
• It also checks if there is a 3-period regular bullish divergence in the RSI (if buy), or regular bearish divergence (if sell) and consider these in the entry condition.
• If these conditions are met, this indicator suggests that it may be a good time to enter a trade.
In summary this is how this indicator works:
• The indicator takes input settings such as the choice between using CCI or Momentum as the entry signal source, length parameters for CCI/Momentum, RSI levels for overbought and oversold conditions, RSI length, and options to plot mean reversion bands on the chart.
• It calculates the CCI and Momentum and RSI values based on user-defined length..
• It checks for regular bullish and bearish divergences (3 periods) in the RSI if the option is enabled.
• The script plots shapes on the chart to indicate the buy and sell signals based on the entry conditions.
• If the mean reversion bands option is enabled, it calculates the mean reversion, standard deviation, upper band, and lower band values.
• It also plots the upper band, mean reversion line, and lower band on the chart if the mean reversion bands option is enabled.
• This indicator includes alert conditions to generate alerts for the buy and sell signals.
• On top of that, users can opt to use only one alert for both buy and sell signals. (This can save Trading view subscribers with limited alerts.)
Important! Please do not consider everything you read here as financial advice. Additionally, do not rely solely on indicators for making your trading decisions. It is important to note that no indicator or strategy is perfect. Therefore, it is always recommended to backtest everything and practice proper risk management.
I appreciate your feedback on this indicator. As I am new to script development, I am open to comments and suggestions to improve it. If you encounter any issues while using this indicator, please let me know in the comments section. If you find it helpful, I kindly ask for your support in boosting it. Thank you for your cooperation.

RSI Screener and Divergence [5ema]
Displayed on the RSI chart according to a custom timeframe.
Displays the RSI tracking table of various timeframes.
Identify normal divergence, hidden divergence on RSI chat.
Show buy and sell signals (strong, weak) on the board.
Send notifications when RSI has a buy or sell signal.
-----
I reused some functions, made by (i believe that):
©paaax : The table position function.
@everget : The RSI divergence function.
@QuantNomad : The function calculated value and array to show on table for input symbols.
I have commented in my code. Thanks so much!
-----
How it works:
1. Input :
input.int length of RSI => calculate RSI.
input.int upper/lower => checking RSI overbought/oversold.
input.int right bars / left bars => returns price of the pivot low & high point => checking divergence.
input.int range upper / lower bars => compare the low & high point => checking divergence.
input.timeframe => request.security another time frame.
input.string table position => display screener table.
2. Input bool:
plot RSI on chart.
Plot Regular Bullish divergence .
Regular Bearish divergence.
Hidden Bullish divergence .
Hidden Bearish divergence.
3. Basic calculated:
Make function for RSI , pivot low & high point of RSI and price.
Request.security that function for earch time frame.
Result RSI, Divergence.
4. Condition of signal:
Buy condition:
RSI oversold (1)
Bullish divergence (2).
=> Buy if (1) and (2), review buy (1) or (2).
Sell condition:
RSI overbought (3).
Bearish divergence (4).
=> Sell if (3) and (4), review sell (3) or (4).
5. Table screener:
Time frame.
RSI (green - oversold, red - overbought)
Divergence (⬈⬈ - regular bullish , ⬊⬊ regular bearish , ⬊ - hidden bullish , ⬈ - hidden bearish ).
Signal (🟢 - Buy, 🔴 - sell, green 〇 - review buy, red 〇 - review sell)
----
This indicator is for reference only, you need your own method and strategy.
If you have any questions, please let me know in the comments.
