ZVOL — Z-Score Volume Heatmapⓩ ZVOL transforms raw volume into a statistically calibrated heatmap using Z-score thresholds. Unlike classic volume indicators that rely on fixed MA comparisons, ZVOL calculates how many standard deviations each volume bar deviates from its mean. This makes the reading adaptive across timeframes and assets, in order to distinguish meaningful crowd behavior from random volatility.
📊 The core display is a five-zone histogram, each encoded by color and statistical depth. Optional background shading mirrors these zones across the entire pane, revealing subtle compression or structural rhythm shifts across time. By grounding the volume reading in volatility-adjusted context, ZVOL inhibits impulsive trading tactics by compelling the structure, not the sentiment, to dictate the signal.
🥵 Heatmap Coloration:
🌚 Suppressed volume — congestion, coiling phases
🩱 Stable flow — early trend or resting volume
🏀 High activity — emerging pressure
💔 Extreme — possible climax or institutional print
🎗️ A dynamic Fibonacci-based 21:34-period EMA ribbon overlays the histogram. The fill area inverts color on crossover, providing a real-time read on tempo, expansion, or divergence between price structure and crowd effort.
💡 LTF Usage Suggestions:
• Confirm breakout legs when orange or red zones align with range exits
• Fade overextended moves when red bars appear into resistance
• Watch for rising EMAs and orange volume to front-run impulsive moves
• Combine with volatility suppression (e.g. ATR) to catch compression → expansion transitions
🥂 Ideal Pairings:
• OBVX Conviction Bias — to confirm directional intent behind volume shifts
• SUPeR TReND 2.718 — for directional filters
• ATR Turbulence Ribbon — to detect compression phases
👥 The OBVX Conviction Bias adds a second dimension to ZVOL by revealing whether crowd effort is aligning with price direction or diverging beneath the surface. While ZVOL identifies statistical anomalies in raw volume, OBVX tracks directional commitment using cumulative volume and moving average cross logic. Use them together to spot fake-outs, anticipate structure-confirmed breakouts, or time pullbacks with volume-based conviction.
🔬 ZVOL isn’t just a volume filter — it’s a structural lens. It reveals when crowd effort is meaningful, when it's fading, and when something is about to shift. Designed for structure-aware traders who care about context, not noise.
חפש סקריפטים עבור "Divergence"

Moving Average Convergence DivergenceThis script is written in Pine Script (version 6) for TradingView and implements the **Moving Average Convergence Divergence (MACD)** indicator. The MACD is a popular momentum oscillator used to identify trend direction, strength, and potential reversals. This version includes customizable inputs, visual enhancements (like crossover markers), and alerts for key events. Below is a detailed explanation of the script:
---
### **1. Purpose**
- The script calculates and displays the MACD line, signal line, and histogram.
- It highlights key events such as MACD/signal line crossovers and zero-line crosses with shapes and colors.
- It provides alerts for changes in the histogram's direction (rising to falling or vice versa).
---
### **2. User Inputs**
- **Fast Length**: Period for the fast moving average (default: 12).
- **Slow Length**: Period for the slow moving average (default: 26).
- **Source**: Data input for calculation (default: closing price, `close`).
- **Signal Smoothing**: Period for the signal line (default: 9, range: 1–50).
- **Oscillator MA Type**: Type of moving average for MACD calculation (options: SMA or EMA, default: EMA).
- **Signal Line MA Type**: Type of moving average for the signal line (options: SMA or EMA, default: EMA).
---
### **3. MACD Calculation**
The MACD is calculated in three parts:
1. **MACD Line**: Difference between the fast and slow moving averages.
- Fast MA: Either SMA or EMA of the source over `fast_length`.
- Slow MA: Either SMA or EMA of the source over `slow_length`.
- Formula: `macd = fast_ma - slow_ma`.
2. **Signal Line**: A moving average (SMA or EMA) of the MACD line over `signal_length`.
- Formula: `signal = sma_signal == "SMA" ? ta.sma(macd, signal_length) : ta.ema(macd, signal_length)`.
3. **Histogram**: Difference between the MACD line and the signal line.
- Formula: `hist = macd - signal`.
---
### **4. Key Events Detection**
#### **MACD/Signal Line Crossovers**
- **Bullish Cross**: MACD crosses above the signal line (`ta.crossover(macd, signal)`).
- **Bearish Cross**: MACD crosses below the signal line (`ta.crossunder(macd, signal)`).
#### **Zero Line Crosses**
- **Cross Above Zero**: MACD crosses above 0 (`ta.crossover(macd, 0)`).
- **Cross Below Zero**: MACD crosses below 0 (`ta.crossunder(macd, 0)`).
---
### **5. Colors**
- **MACD Line**: Green (#089981) if MACD > signal (bullish), red (#f23645) if MACD < signal (bearish).
- **Signal Line**: White (`color.white`).
- **Histogram**:
- Positive (MACD > signal): Light green (#B2DFDB) if decreasing, darker green (#26A69A) if increasing.
- Negative (MACD < signal): Light red (#FFCDD2) if increasing in magnitude, darker red (#FF5252) if decreasing in magnitude.
- **Zero Line**: Gray with 50% transparency (`color.new(#787B86, 50)`).
---
### **6. Visual Outputs**
#### **Plotted Lines**
- **MACD Line**: Plotted with dynamic coloring based on its position relative to the signal line.
- **Signal Line**: Plotted in white.
- **Histogram**: Displayed as columns, with colors indicating direction and momentum.
- **Zero Line**: Horizontal line at 0 for reference.
#### **Shapes for Key Events**
- **Bullish Cross Below Zero**: Green circle on the MACD line when MACD crosses above the signal line while still below zero.
- **Bearish Cross Above Zero**: Red circle on the MACD line when MACD crosses below the signal line while still above zero.
- **Cross Above Zero**: Green upward label at the zero line when MACD crosses above 0.
- **Cross Below Zero**: Red downward label at the zero line when MACD crosses below 0.
---
### **7. Alerts**
- **Rising to Falling**: Triggers when the histogram switches from positive (or zero) to negative.
- Condition: `hist >= 0 and hist < 0`.
- Message: "MACD histogram switched from rising to falling".
- **Falling to Rising**: Triggers when the histogram switches from negative (or zero) to positive.
- Condition: `hist <= 0 and hist > 0`.
- Message: "MACD histogram switched from falling to rising".
---
### **8. How It Works**
1. **Trend Direction**:
- MACD above signal line (green) suggests bullish momentum.
- MACD below signal line (red) suggests bearish momentum.
2. **Momentum Strength**:
- Histogram height shows the strength of the momentum (larger bars = stronger momentum).
- Histogram color changes indicate whether momentum is increasing or decreasing.
3. **Reversal Signals**:
- Crossovers between MACD and signal lines often signal potential trend changes.
- Zero-line crosses indicate shifts between bullish (above 0) and bearish (below 0) territory.
---
### **9. How to Use**
1. Add the script to TradingView.
2. Adjust inputs (e.g., fast/slow lengths, MA types) to suit your trading style.
3. Monitor the chart:
- Green MACD and upward histogram bars suggest bullish conditions.
- Red MACD and downward histogram bars suggest bearish conditions.
- Watch for circles (crossovers) and labels (zero-line crosses) for trade signals.
4. Set up alerts to notify you of histogram direction changes.
---
### **10. Key Features**
- **Customization**: Flexible MA types and periods.
- **Visual Clarity**: Dynamic colors and shapes highlight key events.
- **Alerts**: Notifies users of momentum shifts via histogram changes.
- **Intuitive**: Combines all MACD components (line, signal, histogram) in one indicator.
This script is ideal for traders who rely on MACD for momentum analysis and want clear visual cues and alerts for decision-making.

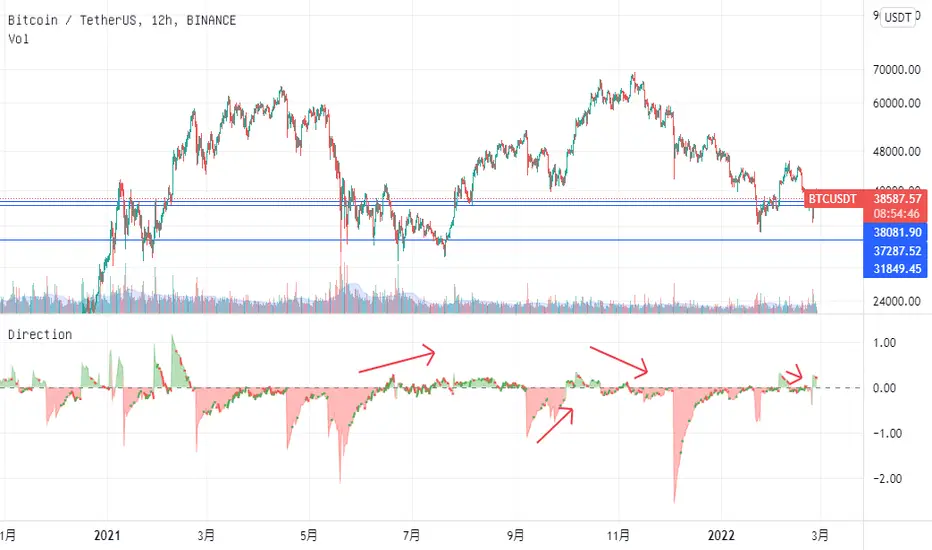
Money Flow Divergence IndicatorOverview
The Money Flow Divergence Indicator is designed to help traders and investors identify key macroeconomic turning points by analyzing the relationship between U.S. M2 money supply growth and the S&P 500 Index (SPX). By comparing these two crucial economic indicators, the script highlights periods where market liquidity is outpacing or lagging behind stock market growth, offering potential buy and sell signals based on macroeconomic trends.
How It Works
1. Data Sources
S&P 500 Index (SPX500USD): Tracks the stock market performance.
U.S. M2 Money Supply (M2SL - Federal Reserve Economic Data): Represents available liquidity in the economy.
2. Growth Rate Calculation
SPX Growth: Percentage change in the S&P 500 index over time.
M2 Growth: Percentage change in M2 money supply over time.
Growth Gap (Delta): The difference between M2 growth and SPX growth, showing whether liquidity is fueling or lagging behind market performance.
3. Visualization
A histogram displays the growth gap over time:
Green Bars: M2 growth exceeds SPX growth (potential bullish signal).
Red Bars: SPX growth exceeds M2 growth (potential bearish signal).
A zero line helps distinguish between positive and negative growth gaps.
How to Use It
✅ Bullish Signal: When green bars appear consistently, indicating that liquidity is outpacing stock market growth. This suggests a favorable environment for buying or holding positions.
❌ Bearish Signal: When red bars appear consistently, meaning stock market growth outpaces liquidity expansion, signaling potential overvaluation or a market correction.
Best Timeframes for Analysis
This indicator works best on monthly timeframes (M) since it is designed for long-term investors and macro traders who focus on broad economic cycles.
Who Should Use This Indicator?
📈 Long-term investors looking for macroeconomic trends.
📊 Swing traders who incorporate liquidity analysis in their strategies.
💰 Portfolio managers assessing market liquidity conditions.
🚀 Use this indicator to stay ahead of market trends and make informed investment decisions based on macroeconomic liquidity shifts! 🚀

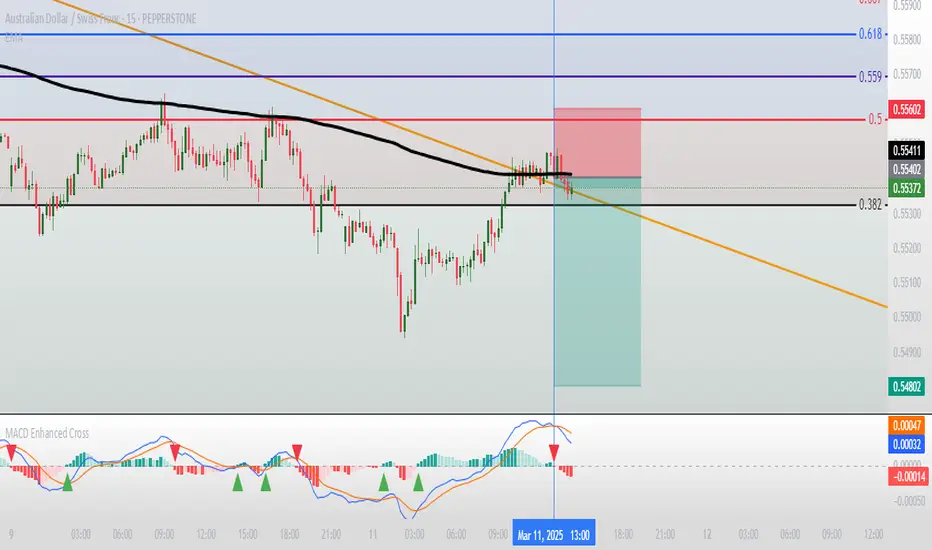
Moving Average Convergence Divergence with Enhanced Cross Alerts
Overview of Features and Settings
- Customizable Parameters:
- Fast and Slow Periods: Users can set the duration for both the fast (default 12) and slow (default 26) moving averages.
- Source Selection: The indicator uses the closing price (close) by default, though this can be modified to any other data source.
- Signal Smoothing: The smoothing period for the signal line is adjustable (default 9), and you can choose whether to use SMA or EMA for both the oscillator and the signal line calculations.
Calculation Logic
1. Calculation of Moving Averages:
- The fast and slow moving averages are computed based on the chosen moving average type (SMA or EMA) over the specified periods.
- The MACD line is then determined as the difference between these two moving averages.
2. Signal Line and Histogram:
- Signal Line: Created by smoothing the MACD line, with the option to choose between SMA and EMA.
- Histogram: Represents the difference between the MACD line and the signal line, visually indicating the divergence between the two.
Detection of Cross Events
The script identifies two specific cross events with additional filtering conditions:
- Bullish Cross:
- The MACD line **crosses above** the signal line.
- The previous value of the histogram is negative, and both the MACD and the signal line are below zero.
- This condition suggests that a cross occurring in the negative territory might indicate a potential upward trend reversal.
- **Bearish Cross:**
- The MACD line **crosses below** the signal line.
- The previous value of the histogram is positive, and both the MACD and the signal line are above zero.
- This condition indicates that a cross in the positive territory may signal a potential downward trend reversal.
For each event, there are dedicated alert conditions defined that trigger notifications when the criteria are met.
Visualization
- Displayed Elements:
- Histogram: Rendered as a column chart with colors that change based on the rate of change. For instance, a rising positive histogram uses a stronger green, whereas a declining positive histogram uses a lighter shade.
- MACD and Signal Lines: Displayed as separate lines with distinct colors to differentiate them.
- Zero Line: A horizontal line is drawn to help visually pinpoint the zero level.
- Crossing Signals:
- Optional markers in the form of arrows appear on the chart:
- **Bullish Cross: A green, upward-pointing triangle at the bottom.
- **Bearish Cross: A red, downward-pointing triangle at the top.
Summary
This indicator not only incorporates the traditional MACD components but also offers the following additional benefits:
- **Enhanced Accuracy:** Extra conditions (such as checking the previous histogram value and the position of the lines relative to zero) improve the identification of significant cross events.
- **Customization:** Users can personalize the moving average types and periods, making the indicator adaptable to different trading strategies.
- **Visual Assistance:** The combination of histogram columns, lines, and markers helps quickly pinpoint potential trend reversals, thereby aiding trading decisions.
This comprehensive description is intended to clearly demonstrate to users how the indicator works, outlining its calculations, filtering conditions, and its role in identifying cross events within technical analysis.
Bar Color - Moving Average Convergence Divergence [nsen]The Pine Script you've provided creates a custom indicator that utilizes the MACD (Moving Average Convergence Divergence) and displays various outputs, such as bar color changes based on MACD signals, and a table of data from multiple timeframes. Here's a breakdown of how the script works:
1. Basic Settings (Input)
• The script defines several user-configurable parameters, such as the MACD values, bar colors, the length of the EMA (Exponential Moving Average) periods, and signal smoothing.
• Users can also choose timeframes to analyze the MACD values, like 5 minutes, 15 minutes, 1 hour, 4 hours, and 1 day.
2. MACD Calculation
• It uses the EMA of the close price to calculate the MACD value, with fast_length and slow_length representing the fast and slow periods. The signal_length is used to calculate the Signal Line.
• The MACD value is the difference between the fast and slow EMA, and the Signal Line is the EMA of the MACD.
• The Histogram is the difference between the MACD and the Signal Line.
3. Plotting the Histogram
• The Histogram values are plotted with colors that change based on the value. If the Histogram is positive (rising), it is colored differently than if it's negative (falling). The colors are determined by the user inputs, for example, green for bullish (positive) signals and red for bearish (negative) signals.
4. Bar Coloring
• The bar color changes based on the MACD's bullish or bearish signal. If the MACD is bullish (MACD > Signal), the bar color will change to the color defined for bullish signals, and if it's bearish (MACD < Signal), the bar color will change to the color defined for bearish signals.
5. Multi-Timeframe Data Table
• The script includes a table displaying the MACD trend for different timeframes (e.g., 5m, 15m, 1h, 4h, 1d).
• Each timeframe will show a colored indicator: green (🟩) for bullish and red (🟥) for bearish, with the background color changing based on the trend.
6. Alerts
• The script has alert conditions to notify the user when the MACD shows a bullish or bearish entry:
• Bullish Entry: When the MACD turns bullish (crosses above the Signal Line).
• Bearish Entry: When the MACD turns bearish (crosses below the Signal Line).
• Alerts are triggered with custom messages such as "🟩 MACD Bullish Entry" and "🟥 MACD Bearish Entry."
Key Features:
• Customizable Inputs: Users can adjust the MACD settings, histogram colors, and timeframe options.
• Visual Feedback: The color changes of the histogram and bars provide instant visual cues for bullish or bearish trends.
• Multi-Timeframe Analysis: The table shows the MACD trend across multiple timeframes, helping traders monitor trends in different timeframes.
• Alert Conditions: Alerts notify users when key MACD crossovers occur.

ILD inverse liquidity Divergence StrategyDetermine Bias (Bullish):
H4 chart shows an uptrend with higher highs and higher lows.
Identify a swing high where resting liquidity (buy-side) is likely above.
Look for SMT Divergence (Lower Timeframes):
On M15, EUR/USD makes a higher high while GBP/USD fails to, signaling potential manipulation.
Spot an Inverse Fair Value Gap (IFVG):
Price has impulsively moved up, leaving a fair value gap below.
Wait for a Retracement (Entry):
Price retraces into the IFVG near a Fibonacci 61.8% retracement level.
Enter long here with a SL below the gap.
Set Risk-to-Reward:
SL = 10 pips below the entry.
TP = 20 pips above (1:2 R:R), targeting a resting liquidity zone above a recent swing high.
Monitor and Exit:
Price moves into the liquidity zone, hits TP, and completes the trade.

S&P 500 E-Mini TrackerThis script generates a reference price for the S&P 500 ETF - SPY based on the current price of the ES contract, which is an E-Mini Futures contract representing the S&P 500 index. The indicator plots this reference price on the chart, providing a unique view of the relationship between these two popular markets.
Advantages:
Identifies divergence between the ES and SPY prices, indicating potential trading opportunities or shifts in market sentiment.
Confirms trends by showing the correlation between the ES and SPY prices.
Eliminates the need for multiple charts, allowing traders to focus on a single screen and make more informed decisions.
Customizable Parameters:
Color Scheme: Choose from various color options to customize the appearance of the indicator.
Line Style: Select from different line styles to change the visual representation of the reference price.
Divisor: Set the dividing factor to adjust the ratio at which the reference price is calculated. (Default value: 10). It is recommended to keep it at 10 for SPY.
To use it with other Stocks/ ETFs, use simple ratio math to calculate the divisor and you can customize the indicator to scale accordingly.
By using this indicator, traders can gain a deeper understanding of the relationship between the E-Mini and SPY markets, making it easier to identify trading opportunities and confirm trends.

200 MAPD - Relative Price with candlesticks and divergenceThis is a MAPD (moving average percent difference) indicator that plots the results in candlestick format and with an option to show divergencies of a specific look back period. It's built with 200 moving average, which cannot be adjusted. A divergence is when the actual asset price moves in the opposite direction than the MAPD.
MAPD measures the percent difference of the asset price from the moving average, in this case, 200 moving average.
MAPD is my favorite indicator because it's an leading indicator, capable of predicting upcoming directions pretty accurately if you learn how to use it and how it works on your specific asset. With candlesticks instead of line you can also apply your own price action techniques.
I created this to be somewhat of a substitute for the actual price of the asset, meaning that price action analysis should be applied on this indicator and asset price is used as a secondary to spot divergencies.
The chart showing on this description is my own discretionary plotting of technical aspects. Divergencies will be enabled per default, but my preference is to have them off and plot my own analysis. And turn them on to get an overview from time to time. You can also change the look back period for the divergencies as you like.
I would say it works best from 1 hour to 1 day, maybe 1 week if you're bottom fishing in a big bear trend.
If you try it out and like it i would love to hear how you find it useful in the comments, will be helpful for me and others :)

Price Volume DivergencePrice Volume Divergence (PVD) is designed to add extra confluence to volume analysis and mark potential reversals in the prevailing trend.
The script uses a simple correlation of price and volume over the predefined time horizon in "PVD Length".
If the correlation is positive (>0) the plotted line gets coloured blue.
If the correlation is negative (<0) the plotted line get coloured in red.
PVD should not be used on its own but in conjunction with other indicators!

Velocity Acceleration Convergence Divergence Indicator [CC]I created the Velocity Acceleration Convergence Divergence Indicator, and it is quite a mouthful if I do say so. I based this script on my two previous scripts: Velocity Indicator and Velocity Acceleration Indicator . This acts like a typical MACD but is much faster with the responses. This indicator is created by finding the difference between the Velocity Indicator and Velocity Acceleration Indicator to determine the overall trend strength of the underlying stock. Like the other scripts, I coded the general buy and sell signals the same, so you would want to buy when the indicator crosses over above the zero midline and sell when it crosses below the zero midline. I have also used the same colors, so darker colors for strong signals and lighter colors for normal signals.
Please let me know if you would like me to publish another script or if you want something custom done!

QQE Weighted Oscillator [LuxAlgo]The QQE (Quantitative Qualitative Estimation) Weighted Oscillator improves on its original version by weighting the RSI based on the indications given by the trailing stop, requiring more effort in order for a cross with the trailing stop to occur.
🔶 USAGE
The QQE Weighted Oscillator is comprised of a smoothed RSI oscillator and a trailing stop derived from this same RSI. The oscillator can be used to indicate whether the market is overbought/oversold as well as an early indication of trend reversals thanks to the leading nature of the RSI.
Using higher Factor values will return a longer-term trailing stop.
Like with a regular RSI divergence can be indicative of a reversal.
Further weighting will control how much "effort" is required for the trailing stop to cross the RSI. For example. For example, an RSI above the trailing stop will require a higher degree of negative price variations in order for a potential cross to occur when using higher weights.
This can cause higher weightings to return more cyclical and smoother results.
🔶 SETTINGS
Length: Length of the RSI oscillator.
Factor: Multiplicative factor used for the trailing stop calculation.
Smooth: Degree of smoothness of the RSI oscillator.
Weight: Degree of weighting used for the RSI calculation.

Pearson's R Convergence DivergenceThis script calculates the convergence divergence and breakouts from the deviations for a fast and slow linear regression slope.
This can be used to predict major market moves before they happen.
For users familiar with MacD, the blue line is similar to the MacD line and the orange line the signal.
The difference is this is not a moving average comparison but a comparison between Pearson's R values.
-0.1 (positive direction)
0.1 (negative direction)
This is why the colors look inverse for a typical MacD.
How to use this:
The idea is that when both trends converge in the 0.8 or -0.8 range and you see a breakout cross occur on either line then the price has a high likelihood of reversing its current trend.
If you see a green cross it means the top of the linear regression for the 'fast' or 'slow' linear regression deviation was broken by the current price. This can signify that upward movement is coming soon.
On the flip side a red cross means the bottom of the linear regression for the 'fast' or 'slow' linear regression deviation was broken by the current price. This can signify that downward movement is coming soon.
These crosses mean a lot more if the pearson's R value is already maxed out near 0.8 or -0.8.
This indicator works because the more sure a trend becomes the more likely it is to break as more traders see the pattern.
The histogram colors do not mean much being 'red' or 'green', what you want to look for is when the histogram starts to approach the 0 mark. This signifies that both linear regression trends are about to reach their peak before reversing trend. So don't confuse this with how you might read the MacD even though it looks very similar. The histogram sloping towards the 0 line will give you a clue how long it might take before the reversal occurs .
Please PM me if you have any questions, and enjoy!

Vector MACDCalculates five vector moving averages of different periods and averages them.
Origin moving average is ALMA from the mid point of the candles (hl2.)
Vector moving averages are the difference between Hull Moving Averages and the Origin MA.
It is a momentum indicator that shows when long term and short term trends agree with the move. It moves stronger, when all the vectors point to the same direction.
Look for divergence to detect trend changes.

Adaptive Fisherized KSTIntroduction
Heyo guys, here is a new adaptive fisherized indicator of me.
I applied Inverse Fisher Transform, Ehlers dominant cycle analysis,
smoothing and divergence analysis on the Know Sure Thing (KST) indicator.
Moreover, the indicator doesn't repaint.
Usage
I didn't backtest the indicator, but I recommend the 5–15 min timeframe.
It can be also used on other timeframs, but I have no experience with that.
The indicator has no special filter system, so you need to find an own combo in order to build a trading system.
A trend filter like KAMA or my Adaptive Fisherized Trend Intensity Index could fit well.
If you find a good combo, let me know it in the comments pls.
Signals
Zero Line
KST crossover 0 => Enter Long
KST crossunder 0 => Enter Short
Cross
KST crossover KST MA => Enter Long
KST crossunder KST MA => Enter Short
Cross Filtered
KST crossover KST MA and KST above 0 => Enter Long
KST crossunder KST MA and KST under 0 => Enter Short
KST crossunder 0 => Exit Long
KST crossover 0 => Exit Short
More to read: KST Explanation
Enjoy and let me know your opinion!
--
Credits to
- @tista
- @blackcat1402
- @DasanC
- @cheatcountry

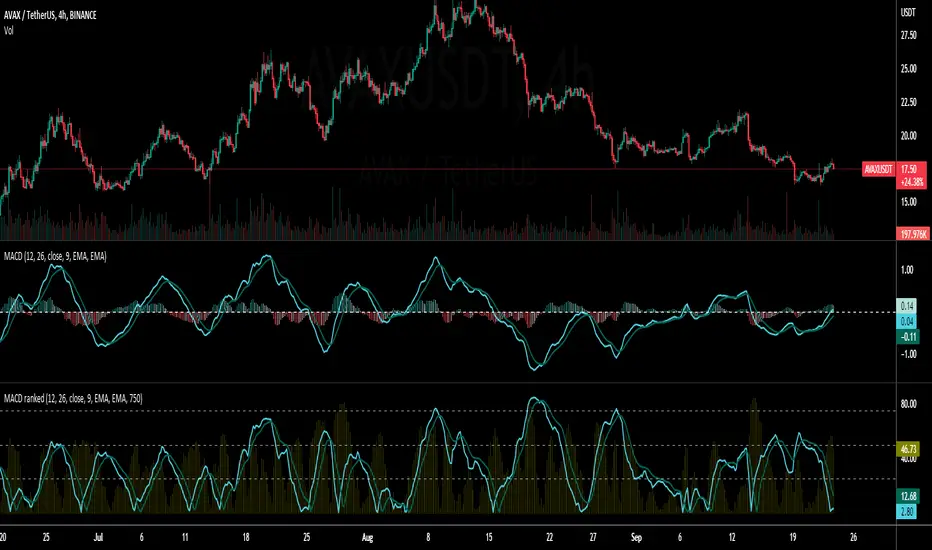
Percentile Rank of Moving Average Convergence DivergenceThis simple indicator provides you three useful information of the Moving Average Convergence Divergence (MACD) indicator:
The percentile rank of the current value of the MACD line, displayed by the bright blue line.
The percentile rank of the current value of the Signal line, displayed by the dark blue line.
The percentile rank of the current value of the Histogram line, displayed by the olive histogram.
This indicator can be useful to identify the strength of trend. This indicator makes the assumption that market tends to revert into the opposite direction. If the market has been trending a lot, it should consolidate for a while later. If the market has been consolidating for a long time, it would begin trending real soon.
When we see a low percentile rank, no matter which line it is, this tells that the market hasn't been moving much, or there is little momentum. If the percentile rank stays below the median or even below the first quartile for a long time, this could suggest that the market is ready for the next trend since it has stored quite some energy.
When we see a high percentile rank, no matter which line it is, this tells that the market has been trending a lot, or there is much momentum. If the percentile rank stays above the median or even above the third quartile for a long time, it is probable that the market has used up much of its energy and is going to take a rest (consolidate).
Ultimate RSI - Divergence + S/R + Reverse RSIThis is a modification of the TradingView RSI with some of my favourite RSI features added.
This includes Divergence indicators. EMA with colour change on cross, Support and resistance lines and reverse RSI.
A reverse calc has also been added. This will allow you to input 3 different RSI values for a price prediction. This is good to use with the support and resistance lines and can give you key areas on the chart where the price may bounce/reject.
All colours and modifications can be turned on/off.
Enjoy! :)

Neo's %KIn my opinion the %K is the only part of the stochastic that you actually need. It's the fast RSI, so it responds much better to large price movements and reveals divergence a lot sooner than %D. The %D has no real confluence with the rest of my strategy so, I only use %K.

[_ParkF]RSI (+ichimoku cloud)RSI
Typical RSI indicators were plotted with candles and expressed wick to resemble a candle chart,
and linear regression was added to predict changes in force intensity,
which allowed us to confirm support and resistance within linear regression .
In addition, divergence signal was marked as an additional basis for the price fluctuation point due to support and resistance .
In other words,
if the diversity signal appears together when the rsi candle is supported and resisted within linear regression ,
this is the basis for predicting that it is a point of change in the existing trend.
Finally, the period value and standard deviation of linear regression can be arbitrarily modified and used.
I hope it will help you with your trading.
--------------------------------------------------------------------------------------------------------------------------------------------------------------
(+ichimoku cloud)
Clouds made of the preceding span 1 and the preceding span 2 of the balance table can predict the trend by displaying the current price balance ahead of the future.
In addition to the role of clouds in the above-described balance sheet, this indicator also shows the cloud band support and resistance of the current RSI value.
일반적인 RSI 지표를 캔들화 하였고 꼬리까지 포함하여 캔들 차트와 유사하게 표현 하고,
캔들화한 RSI 지표에 선형회귀(채널)를 추가 하여 RSI 지표 특유의 힘의 강도의 변화를 지지와 저항으로 확인할 수 있게 해봤습니다.
또한 다이버전스 신호를 추가하여 선형회귀(채널)로 인한 지지와 저항에 따른 가격 변동의 근거로 삼을 수 있습니다.
즉, 선형회귀(채널) 안에서 RSI 캔들이 지지와 저항을 받을 때 다이버전스 신호가 함께 나타난다면 이는 기존 추세의 변화 지점임을
예측해 볼 수 있는 근거가 됩니다.
마지막으로 선형회귀(채널)의 기간값과 표준편차는 임의로 수정하여 사용할 수 있습니다.
당신의 트레이딩에 도움이 되었으면 합니다.
--------------------------------------------------------------------------------------------------------------------------------------------------------------
(+일목균형표의 구름)
일목균형표의 선행스팬1과 선행스팬2로 만들어진 구름은 현재 가격의 균형을 미래에 선행하여 표시하여 추세를 예측해볼 수 있습니다.
본 지표에서는 위에서 설명한 일목균형표의 구름의 역할과 더불어 현 RSI 값의 구름대 지지, 저항 또한 확인해볼 수 있습니다.
* I would like to express my gratitude to zdmre for revealing the linear regression source.

[_ParkF]RSIRSI
Typical RSI indicators were plotted with candles and expressed wick to resemble a candle chart,
and linear regression was added to predict changes in force intensity,
which allowed us to confirm support and resistance within linear regression.
In addition, divergence signal was marked as an additional basis for the price fluctuation point due to support and resistance.
In other words,
if the diversity signal appears together when the rsi candle is supported and resisted within linear regression,
this is the basis for predicting that it is a point of change in the existing trend.
Finally, the period value and standard deviation of linear regression can be arbitrarily modified and used.
I hope it will help you with your trading.
일반적인 RSI 지표를 캔들화 하였고 꼬리까지 포함하여 캔들 차트와 유사하게 표현 하고,
캔들화한 RSI 지표에 선형회귀(채널)를 추가 하여 RSI 지표 특유의 힘의 강도의 변화를 지지와 저항으로 확인할 수 있게 해봤습니다.
또한 다이버전스 신호를 추가하여 선형회귀(채널)로 인한 지지와 저항에 따른 가격 변동의 근거로 삼을 수 있습니다.
즉, 선형회귀(채널) 안에서 RSI 캔들이 지지와 저항을 받을 때 다이버전스 신호가 함께 나타난다면 이는 기존 추세의 변화 지점임을
예측해 볼 수 있는 근거가 됩니다.
마지막으로 선형회귀(채널)의 기간값과 표준편차는 임의로 수정하여 사용할 수 있습니다.
당신의 트레이딩에 도움이 되었으면 합니다.
* I would like to express my gratitude to zdmre for revealing the linear regression source.

volatility-weighted price change divergenceEMA of intrabar-volatility-weighted price change minus EMA of price change. It puts more weights on candles that have large volatility inside, and assumes that the direction of those high-volatility candles are more meaningful than low-volatility ones. Therefore, we take the difference between the volatility-weighted price change and the regular price change and plot the EMA. The indicator may be used as a tool to find divergence and potential reversal, or hints of continuation of a strong trend. Note that this indicator can change a lot with different time frames and settings, so take care to backtest before using. Recommended settings are 15m resolution for time frames longer than 4H and 1m resolution (with 200 EMA length) for time frames below 4H. The resolution is used to find the intrabar volatility.
Wave Trend OscillatorThis is a very standard version of the Wave Trend Oscillator.
The Channel and Average values are displayed as lines, most people display them as areas.
The Channel and Average difference is displayed as a histogram, most people display it as a tiny noisy area.
I was unable to find a standard version of the Wave Trend Oscillator.
The colorful hyped up versions of this indicator made me feel like a clown while using them.
I have essentially copied the style of the MACD with this indicator, to keep things professional.
With this WTO, you can change the timeframe and source.
You can also change the histogram average length and multiplier, making it usable.
The typical way that people display the histogram is completely unusable and just for appearance.
Now it does a decent job showing when the momentum of the WTO's downward movement is slowing down, just like how the MACD histogram works.
This indicator is essentially a normalized MACD, though they are calculated differently.
The Wave Trend Oscillator is useful for spotting/monitoring changed in mid-trend momentum.
In my experience, divergence in this indicator is a strong signal.
If the MACD is too slow for you, then this is a great alternative; without all the extra fluff people usually add to it.

ATR Volume DivergenceThe indicator measures ATR relative to VOLUME of each candle, marks the candles where there is more volume than in the previous one, but a lower ATR - signifying a compression in price movement - resistance. It also marks the candle where there is a greater ATR than in the previous candle, but lower volume - signifying an expansion in price movement - vacuum.
P.S. Bring indicator to FRONT to see the colored candles clearly

Abz Bonds/BTC divergenceDraft release: This indicator shows the comparative returns from US bonds vs BTC.
I was inspired by this Twitter thread: twitter.com
If you compare the price action of Bitcoin against bond returns over the last year, there's an extraordinary degree of correlation. This may give insights into what's coming next for BTC , but at some point the relationship will inevitably break down. In the meantime, there's much to gain.
DYOR.
Feedback welcome though it may take a while for me to respond.