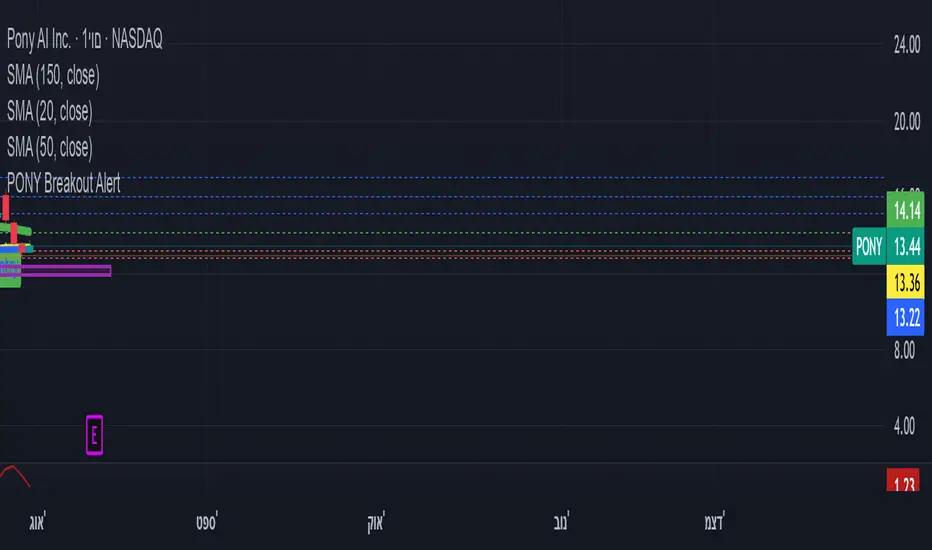
ombs- PONY Breakout Alert
🧠 תקציר הסקריפט: **PONY Breakout Alert 📈
🔍 **מטרה**:
לזהות **פריצה מעלה של רמת 14.15** תוך כדי **מחזור מסחר גבוה מהממוצע**, כדי לאתר **הזדמנות מסחר שורית**.
---
⚙️ רכיבי הסקריפט:
* 📌 **רמת כניסה**:
`entryLevel = 14.15`
* 📊 **תנאי כניסה**:
* סגירת מחיר **מעל 14.15**
* נפח מסחר **גבוה ב־20% מהממוצע ל־20 הימים האחרונים**
* 🔔 **התראה ויזואלית**:
* סמל ירוק "Entry" מופיע מתחת לנר על הגרף
* קווים קבועים לרמות יעד וסטופלוס
* 🎯 **יעדי רווח**:
* Target 1 – 15.15
* Target 2 – 16.00
* Target 3 – 17.00
* 🛑 **סטופלוס**:
* שמרני: 13.20
* אגרסיבי: 12.80
* 🔔 **התראה אוטומטית** (`alertcondition`):
תשלח הודעה:
*"PONY פרצה מעל 14.15 עם מחזור גבוה – שקול כניסה לעסקה."*
---
📝 מתאים עבור:
* סוחרי ניתוח טכני 🧮
* מי שמחפש כניסה מבוססת על פריצה + נפח 📊
* שימוש על גרף יומי בלבד 📅
---
🧠 Script Summary: PONY Breakout Alert 📈
🔍 Objective:
Detect a breakout above the 14.15 level accompanied by high trading volume, in order to identify a bullish trading opportunity.
⚙️ Script Components:
📌 Entry Level:
entryLevel = 14.15
📊 Entry Conditions:
Price closes above 14.15
Volume is 20% higher than the 20-day average
🔔 Visual Alert:
A green "Entry" label appears below the bar on the chart
Static horizontal lines mark targets and stop-loss levels
🎯 Profit Targets:
Target 1 – 15.15
Target 2 – 16.00
Target 3 – 17.00
🛑 Stop Loss:
Conservative: 13.20
Aggressive: 12.80
🔔 Automated Alert (alertcondition):
Sends a message:
"PONY has broken above 14.15 with high volume – consider a long position."
📝 Ideal For:
Technical traders 🧮
Those seeking breakouts confirmed by volume 📊
Daily chart setups only 📅
חפש סקריפטים עבור "breakout"
Inside Bar Breakout with TP/SL - ModifiedInside Bar Breakout Trade Plan
Strategy Overview
This plan utilizes the Inside Bar Breakout indicator to identify high-probability breakout trades. The strategy capitalizes on consolidation patterns (inside bars) followed by breakouts from mother bars, with predefined risk management.

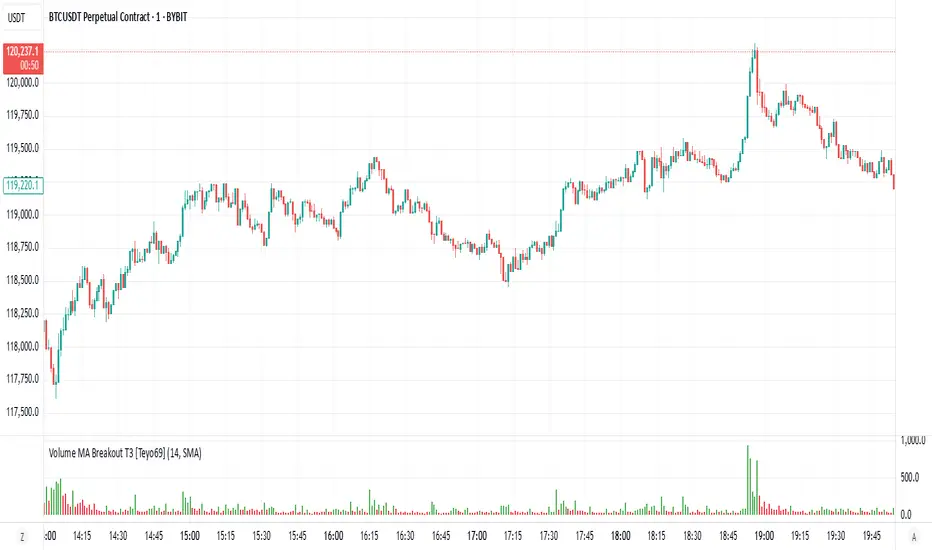
Volume MA Breakout T3 [Teyo69]🧭 Overview
Volume MA Breakout T3 highlights volume bars that exceed a dynamic moving average threshold. It helps traders visually identify volume breakouts—periods of significant buying or selling pressure—based on user-selected MA methods (SMA, EMA, DEMA).
🔍 Features
Volume Highlighting: Green bars indicate volume breakout above the MA; red bars otherwise.
Custom MA Options: Choose between SMA, EMA, or Double EMA for volume smoothing.
Dynamic Threshold: The moving average line adjusts based on user-defined length and method.
⚙️ Configuration
Length: Number of bars used for the moving average calculation (default: 14).
Method: Type of moving average to use:
"SMA" - Simple Moving Average
"EMA" - Exponential Moving Average
"Double EMA" - Double Exponential Moving Average
📈 How to Use
Apply to any chart to visualize volume behavior relative to its MA.
Look for green bars: These suggest volume is breaking out above its recent average—potential signal of momentum.
Red bars indicate normal/subdued volume.
⚠️ Limitations
Does not provide directional bias—use with price action or trend confirmation tools.
Works best with additional context (e.g., support/resistance, candle formations).
🧠 Advanced Tips
Use shorter MAs (e.g., 5–10) in volatile markets for more responsive signals.
Combine with OBV, MFI, or accumulation indicators for confluence.
📌 Notes
This is a volume-based filter, not a signal generator.
Useful for breakout traders and volume profile enthusiasts.
📜 Disclaimer
This script is for educational purposes only. Always test in a simulated environment before live trading. Not financial advice.
Bollinger BandWidth Squeeze BreakoutBollinger BandWidth Squeeze Breakout
Description:
This indicator merges classic Bollinger BandWidth (BBW) with TTM Squeeze Pro-style compression dots. It identifies volatility contractions, very effective at identifying chop or ranging markets, and color-codes the BBW line based on directional breakout bias—helping traders anticipate explosive moves before they happen.
It supports multi-level squeeze detection:
High Compression (Orange) : Tightest squeeze — highly coiled setup
Medium Compression (Red) : Moderate squeeze — building pressure
Low Compression (Black) : Light squeeze — early contraction
(No dot means no squeeze – free expansion)
How It Works
Bollinger BandWidth (BBW):
Calculated as the percent width between Bollinger Bands over a selected moving average (SMA, EMA, etc.). A rising BBW suggests volatility expansion; falling BBW indicates compression.
Directional Bias (BBW Color):
The line is colored green when recent bars show upside breakout pressure, red when downside pressure dominates, and gray when neutral. This is based on cumulative position of price relative to the Bollinger Bands.
TTM Squeeze Pro Dots:
Compression dots plotted on the zero line represent volatility squeeze levels, using up to 3 Keltner Channel thresholds:
Orange Dot : High compression (tightest squeeze zone)
Red Dot : Medium compression
Black Dot : Low compression
(No dot means no squeeze — price is expanding)
Expansion & Contraction Context:
Plots historical highest/lowest BBW values (user-defined period) to help spot extreme conditions.
How to Interpret:
Use squeeze dots to identify when the market is “chop/ranging.” Breakouts from these zones often come with sharp moves.
BBW Line Color = Bias Filter:
Green → Bullish expansion pressure
Red → Bearish expansion pressure
Gray → Neutral or undecided
Use this to filter direction before entering a breakout or momentum trade.
Inputs:
Length : Period for BB and Keltner calculations
MA Type : Choose from SMA, EMA, SMMA, WMA, VWMA, or None
StdDev : Standard deviation for BB
Expansion/Contraction Lengths : Historical window to track BBW extremes
Source : Input source for all calculations (default: Close)
Keltner Multipliers : Customize thresholds for high/mid/low compression
Best For:
Traders looking to anticipate breakout direction
Scalpers and swing traders seeking early volatility cues
Anyone using BB or TTM Squeeze logic in their setups
Pro Tips:
Combine with momentum tools (e.g., RSI, MACD, SMI, CCI) to confirm breakout thrust
Use squeeze dot color shifts (red/orange → no dot) as a breakout timing tool
Use historical BBW highs/lows as context for relative volatility expansion

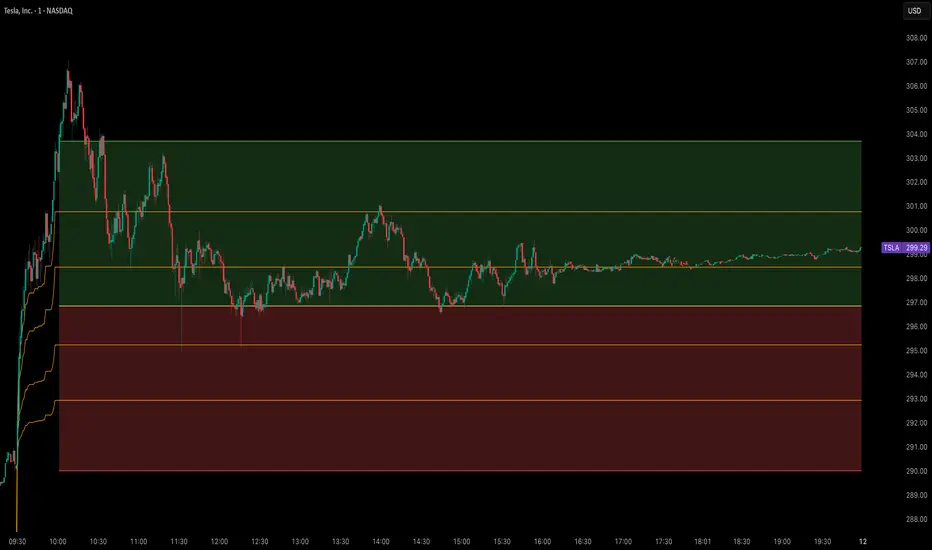
Opening Range Breakout (15 mins Range)Take the guesswork out of your trading with the Opening Range Breakout Pro script. This tool automatically marks the high and low of the first 15 minutes of the NYSE session, then highlights the first candle to break out above or below this range—removing ambiguity from your trade entries.
The opening range is one of the most powerful concepts in day trading. By identifying the price range set during the market’s first minutes, you gain a clear framework for your trades. When price breaks out above the range, it often signals a strong bullish move; a break below signals bearish momentum. This script visually marks these moments, so you can react quickly and confidently.
Why use Opening Range Breakout Pro?
• Defined Entry and Exit Points: The script gives you clear, objective breakout levels—no more guessing when to enter a trade.
• Removes Emotional Trading: With visual cues for breakouts, you can follow a systematic approach and avoid hesitation or FOMO.
• Backtested, Time-Tested Strategy: The opening range breakout has been used by professional traders for decades to capture early trends and maximize profit potential.
• High Reward Potential: By capitalizing on the volatility and momentum of the opening session, traders often catch the best moves of the day.
• Easy to Use: Just add to your chart—no configuration needed. The script works on any NYSE stock, on a 5-minute chart.
How it works:
• Draws the opening 15-minute high and low as orange lines.
• Labels the range prices for quick reference.
• Marks the first candle to close above the range with an orange ▲, and the first to close below with an orange ▼.
Take control of your trading day, remove uncertainty, and trade with confidence—just like the pros.

OBV ATR Strategy (OBV Breakout Channel) bas20230503ผมแก้ไขจาก OBV+SMA อันเดิม ของเดิม ดูที่เส้น SMA สองเส้นตัดกันมั่นห่วยแตกสำหรับที่ผมลองเทรดจริง และหลักการเบรค ได้แรงบันดาลใจ ATR จาก เทพคอย ที่ใช้กับราคา แต่นี้ใช้กับ OBV แทน
และผมใช้เจมินี้ เพื่อแก้ ให้ เป็น strategy เพื่อเช็คย้อนหลังได้ง่ายกว่าเดิม
หลักการง่ายคือถ้ามันขึ้น มันจะขึ้นเรื่อยๆ
เขียน แบบสุภาพ (น่าจะอ่านได้ง่ายกว่าผมเขียน)
สคริปต์นี้ได้รับการพัฒนาต่อยอดจากแนวคิด OBV+SMA Crossover แบบดั้งเดิม ซึ่งจากการทดสอบส่วนตัวพบว่าประสิทธิภาพยังไม่น่าพอใจ กลยุทธ์ใหม่นี้จึงเปลี่ยนมาใช้หลักการ "Breakout" ซึ่งได้รับแรงบันดาลใจมาจากการใช้ ATR สร้างกรอบของราคา แต่เราได้นำมาประยุกต์ใช้กับ On-Balance Volume (OBV) แทน นอกจากนี้ สคริปต์ได้ถูกแปลงเป็น Strategy เต็มรูปแบบ (โดยความช่วยเหลือจาก Gemini AI) เพื่อให้สามารถทดสอบย้อนหลัง (Backtest) และประเมินประสิทธิภาพได้อย่างแม่นยำ
หลักการของกลยุทธ์: กลยุทธ์นี้ทำงานบนแนวคิดโมเมนตัมที่ว่า "เมื่อแนวโน้มได้เกิดขึ้นแล้ว มีโอกาสที่มันจะดำเนินต่อไป" โดยจะมองหาการทะลุของพลังซื้อ-ขาย (OBV) ที่แข็งแกร่งเป็นพิเศษเป็นสัญญาณเข้าเทร
----
สคริปต์นี้เป็นกลยุทธ์ (Strategy) ที่ใช้ On-Balance Volume (OBV) ซึ่งเป็นอินดิเคเตอร์ที่วัดแรงซื้อและแรงขายสะสม แทนที่จะใช้การตัดกันของเส้นค่าเฉลี่ย (SMA Crossover) ที่เป็นแบบพื้นฐาน กลยุทธ์นี้จะมองหาการ "ทะลุ" (Breakout) ของพลัง OBV ออกจากกรอบสูงสุด-ต่ำสุดของตัวเองในรอบที่ผ่านมา
สัญญาณกระทิง (Bull Signal): เกิดขึ้นเมื่อพลังการซื้อ (OBV) แข็งแกร่งจนสามารถทะลุจุดสูงสุดของตัวเองในอดีตได้ บ่งบอกถึงโอกาสที่แนวโน้มจะเปลี่ยนเป็นขาขึ้น
สัญญาณหมี (Bear Signal): เกิดขึ้นเมื่อพลังการขาย (OBV) รุนแรงจนสามารถกดดันให้ OBV ทะลุจุดต่ำสุดของตัวเองในอดีตได้ บ่งบอกถึงโอกาสที่แนวโน้มจะเปลี่ยนเป็นขาลง
ส่วนประกอบบนกราฟ (Indicator Components)
เส้น OBV
เส้นหลัก ที่เปลี่ยนเขียวเป็นแดง เป็นทั้งแนวรับและแนวต้าน และ จุด stop loss
เส้นนี้คือหัวใจของอินดิเคเตอร์ ที่แสดงถึงพลังสะสมของ Volume
เมื่อเส้นเป็นสีเขียว (แนวรับ): จะปรากฏขึ้นเมื่อกลยุทธ์เข้าสู่ "โหมดกระทิง" เส้นนี้คือระดับต่ำสุดของ OBV ในอดีต และทำหน้าที่เป็นแนวรับไดนามิก
เมื่อเส้นกลายเป็นสีแดงสีแดง (แนวต้าน): จะปรากฏขึ้นเมื่อกลยุทธ์เข้าสู่ "โหมดหมี" เส้นนี้คือระดับสูงสุดของ OBV ในอดีต และทำหน้าที่เป็นแนวต้านไดนามิก
สัญลักษณ์สัญญาณ (Signal Markers):
Bull 🔼 (สามเหลี่ยมขึ้นสีเขียว): คือสัญญาณ "เข้าซื้อ" (Long) จะปรากฏขึ้น ณ จุดที่ OBV ทะลุขึ้นไปเหนือกรอบด้านบนเป็นครั้งแรก
Bear 🔽 (สามเหลี่ยมลงสีแดง): คือสัญญาณ "เข้าขาย" (Short) จะปรากฏขึ้น ณ จุดที่ OBV ทะลุลงไปต่ำกว่ากรอบด้านล่างเป็นครั้งแรก
วิธีการใช้งาน (How to Use)
เพิ่มสคริปต์นี้ลงบนกราฟราคาที่คุณสนใจ
ไปที่แท็บ "Strategy Tester" ด้านล่างของ TradingView เพื่อดูผลการทดสอบย้อนหลัง (Backtest) ของกลยุทธ์บนสินทรัพย์และไทม์เฟรมต่างๆ
ใช้สัญลักษณ์ "Bull" และ "Bear" เป็นตัวช่วยในการตัดสินใจเข้าเทรด
ข้อควรจำ: ไม่มีกลยุทธ์ใดที่สมบูรณ์แบบ 100% ควรใช้สคริปต์นี้ร่วมกับการวิเคราะห์ปัจจัยอื่นๆ เช่น โครงสร้างราคา, แนวรับ-แนวต้านของราคา และการบริหารความเสี่ยง (Risk Management) ของตัวคุณเองเสมอ
การตั้งค่า (Inputs)
SMA Length 1 / SMA Length 2: ใช้สำหรับพล็อตเส้นค่าเฉลี่ยของ OBV เพื่อดูเป็นภาพอ้างอิง ไม่มีผลต่อตรรกะการเข้า-ออกของ Strategy อันใหม่ แต่มันเป็นของเก่า ถ้าชอบ ก็ใช้ได้ เมื่อ SMA สองเส้นตัดกัน หรือตัดกับเส้น OBV
High/Low Lookback Length: (ค่าพื้นฐาน30/แก้ตรงนี้ให้เหมาะสมกับ coin หรือหุ้น ตามความผันผวน ) คือระยะเวลาที่ใช้ในการคำนวณกรอบสูงสุด-ต่ำสุดของ OBV
ค่าน้อย: ทำให้กรอบแคบลง สัญญาณจะเกิดไวและบ่อยขึ้น แต่อาจมีสัญญาณหลอก (False Signal) เยอะขึ้น
ค่ามาก: ทำให้กรอบกว้างขึ้น สัญญาณจะเกิดช้าลงและน้อยลง แต่มีแนวโน้มที่จะเป็นสัญญาณที่แข็งแกร่งกว่า
แน่นอนครับ นี่คือคำแปลฉบับภาษาอังกฤษที่สรุปใจความสำคัญ กระชับ และสุภาพ เหมาะสำหรับนำไปใช้ในคำอธิบายสคริปต์ (Description) ของ TradingView ครับ
---Translate to English---
OBV Breakout Channel Strategy
This script is an evolution of a traditional OBV+SMA Crossover concept. Through personal testing, the original crossover method was found to have unsatisfactory performance. This new strategy, therefore, uses a "Breakout" principle. The inspiration comes from using ATR to create price channels, but this concept has been adapted and applied to On-Balance Volume (OBV) instead.
Furthermore, the script has been converted into a full Strategy (with assistance from Gemini AI) to enable precise backtesting and performance evaluation.
The strategy's core principle is momentum-based: "once a trend is established, it is likely to continue." It seeks to enter trades on exceptionally strong breakouts of buying or selling pressure as measured by OBV.
Core Concept
This is a Strategy that uses On-Balance Volume (OBV), an indicator that measures cumulative buying and selling pressure. Instead of relying on a basic Simple Moving Average (SMA) Crossover, this strategy identifies a "Breakout" of the OBV from its own highest-high and lowest-low channel over a recent period.
Bull Signal: Occurs when the buying pressure (OBV) is strong enough to break above its own recent highest high, indicating a potential shift to an upward trend.
Bear Signal: Occurs when the selling pressure (OBV) is intense enough to push the OBV below its own recent lowest low, indicating a potential shift to a downward trend.
On-Screen Components
1. OBV Line
This is the main indicator line, representing the cumulative volume. Its color changes to green when OBV is rising and red when it is falling.
2. Dynamic Support & Resistance Line
This is the thick Green or Red line that appears based on the strategy's current "mode." This line serves as a dynamic support/resistance level and can be used as a reference for stop-loss placement.
Green Line (Support): Appears when the strategy enters "Bull Mode." This line represents the lowest low of the OBV in the recent past and acts as dynamic support.
Red Line (Resistance): Appears when the strategy enters "Bear Mode." This line represents the highest high of the OBV in the recent past and acts as dynamic resistance.
3. Signal Markers
Bull 🔼 (Green Up Triangle): This is the "Long Entry" signal. It appears at the moment the OBV first breaks out above its high-low channel.
Bear 🔽 (Red Down Triangle): This is the "Short Entry" signal. It appears at the moment the OBV first breaks down below its high-low channel.
How to Use
Add this script to the price chart of your choice.
Navigate to the "Strategy Tester" panel at the bottom of TradingView to view the backtesting results for the strategy on different assets and timeframes.
Use the "Bull" and "Bear" signals as aids in your trading decisions.
Disclaimer: No strategy is 100% perfect. This script should always be used in conjunction with other forms of analysis, such as price structure, key price-based support/resistance levels, and your own personal risk management rules.
Inputs
SMA Length 1 / SMA Length 2: These are used to plot moving averages on the OBV for visual reference. They are part of the legacy logic and do not affect the new breakout strategy. However, they are kept for traders who may wish to observe their crossovers for additional confirmation.
High/Low Lookback Length: (Most Important Setting) This determines the period used to calculate the highest-high and lowest-low OBV channel. (Default is 30; adjust this to suit the asset's volatility).
A smaller value: Creates a narrower channel, leading to more frequent and faster signals, but potentially more false signals.
A larger value: Creates a wider channel, leading to fewer and slower signals, which are likely to be more significant.

ORB Breakout Indicator - NQ1!The purpose of this indicator is to assist traders in rapidly identifying high-probability Opening Range Breakout (ORB) setups on the NQ1! 1-minute time frame (Nasdaq Futures)
Key Features:
Opening Range: Automatically plots the high and low of the 1st 15min of the (NYSE session) (09:30–09:45 EST)
Breakout Signals : Illustrates the first candle that breaks upward or downward and:
Green arrow for a bullish breakout
Red arrow for a bearish breakout
Clean Visuals: Dynamic lines show the high and low of the ORB window for easy reference.
(DON'T USE THIS ONLY FOR ENTRY SIGNALS, PAIR THIS WITH OTHER INFLUENCES TO GET HIGH PROBABILITY BREAKOUTS)
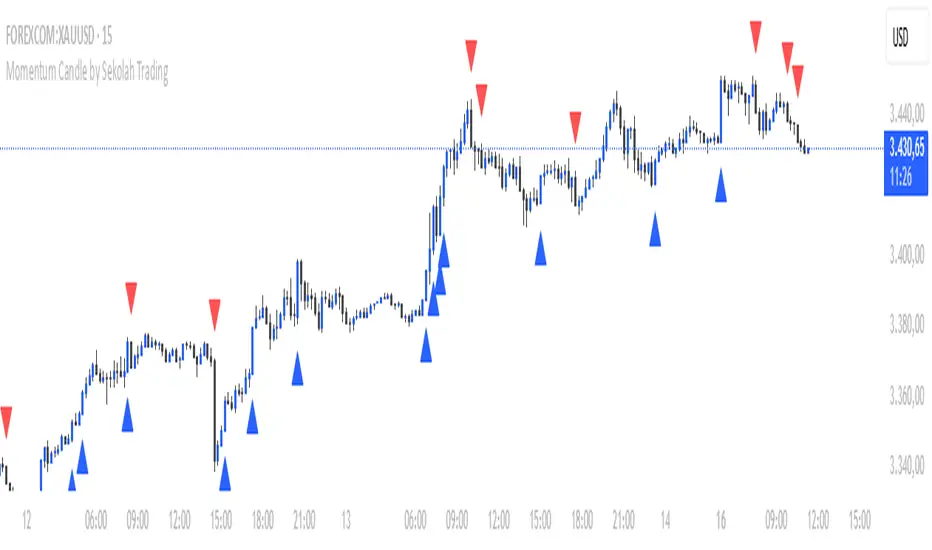
Momentum Candle by Sekolah Trading## 🔷 Introduction
**Momentum Candle by Sekolah Trading** is a proprietary price action tool that identifies high-conviction candles with large bodies and minimal wicks, based on dynamically adjusted thresholds tailored to each pair and timeframe. This script helps traders recognize moments of price acceleration that often precede breakouts, trend continuation, or sharp reversals.
---
## 🔷 What Makes This Script Unique (Originality & Utility)
Unlike traditional candle filters that rely on static size comparisons, this indicator uses:
- **Instrument-specific pip sensitivity**: Automatically detects if the pair is XAUUSD, JPY-based, or other Forex instruments.
- **Timeframe-based calibration**: Adjusts body size thresholds dynamically for 5m, 15m, 30m, and 1h.
- **Wick ratio control**: Validates only candles with short wicks (<30%), filtering indecisive moves.
- **Non-repainting logic**: Signals appear after candle close, with no future data lookahead.
This logic has been tested and refined internally by **Sekolah Trading**, designed for scalpers and intraday traders who rely on clean price action structure.
---
## 🔷 How It Works
1. **Pair & Timeframe Detection**
Adjusts `minRange` dynamically based on:
- Gold (XAUUSD), JPY pairs, or other Forex
- Timeframe: 5m to 1h
2. **Candle Structure Analysis**
- Calculates body = `abs(open - close)`
- Wick = `upper + lower shadows`
- Valid only if wick is under 30% of total candle
3. **Conditions for Signal**
- Body ≥ minRange
- Wick ≤ 30%
- Clear bullish or bearish direction
4. **Plots**
- 🔺 Blue triangle = Bullish momentum candle
- 🔻 Red triangle = Bearish momentum candle
---
## 🔷 How to Use
1. **Add to any 5m–1h chart**, ideally on XAUUSD or major Forex pairs
2. **Wait for signal triangle** to appear at the close of a candle
3. Use with:
- Trend indicators (MA, Supertrend, etc.)
- Support/resistance zones
- Breakout levels
4. **Set alerts** using:
`Momentum Candle (Body)`
---
## 🔷 Why This Script is Closed-Source
This indicator includes proprietary logic created by **Sekolah Trading** for professional and community use:
- Original dynamic pip sensitivity calibration
- Custom multi-condition filtering
- Non-reused, non-public logic with adaptive precision
The source is protected to prevent unauthorized duplication. However, all relevant logic and intent have been clearly explained above as required by TradingView’s House Rules.
---
## 🔷 Disclaimer
This indicator does not provide financial advice or guaranteed signals. Always combine with your own analysis and risk management. Historical performance does not guarantee future results.
---
## 🔷 Suggested Tags
`momentum`, `price action`, `breakout`, `forex`, `xauusd`, `jpy`, `scalping`, `candle`, `non-repainting`, `trend confirmation`
NY Opening Range Breakout - MA StopCore Concept
This strategy trades breakouts from the New York opening range (9:30-9:45 AM NY time) on intraday timeframes, designed for scalping and day trading.
Setup Requirements
Timeframe: Works on any timeframe under 15 minutes (1m, 2m, 3m, 5m, 10m)
Session: New York market hours
Range Period: 9:30-9:45 AM NY time (15-minute opening range)
Entry Rules
Long Entries:
Wait for a candle to close above the opening range high
Enter long on the next candle (before 12:00 PM NY time)
Must be above moving average if using MA-based take profit
Short Entries:
Wait for a candle to close below the opening range low
Enter short on the next candle (before 12:00 PM NY time)
Must be below moving average if using MA-based take profit
Risk Management
Stop Loss:
Long trades: Opening range low
Short trades: Opening range high
Take Profit Options:
Fixed Risk Reward: 1.5x the range size (customizable ratio)
Moving Average: Exit when price crosses back through MA
Both: Whichever comes first
Key Features
Trade Direction Options:
Long Only
Short Only
Both directions
Moving Average Filter:
Prevents entries that would immediately hit stop loss
Uses EMA/SMA/WMA/VWMA with customizable length
Acts as dynamic support/resistance
Time Restrictions:
No entries after 12:00 PM NY time (customizable cutoff)
One trade per direction per day
Daily reset of all variables
Visual Elements
Red/green lines showing opening range
Purple line for moving average
Entry and breakout signals with shapes
Take profit and stop loss levels plotted
Information table with current status
Strategy Logic Flow
Morning: Capture 9:30-9:45 range high/low
Wait: Monitor for breakout (previous candle close outside range)
Filter: Check MA condition if using MA-based exits
Enter: Trade on next candle after breakout
Manage: Exit at fixed TP, MA cross, or stop loss
Reset: Start fresh next trading day
This is a momentum-based breakout strategy that capitalizes on early market volatility while using the opening range as natural support/resistance levels.

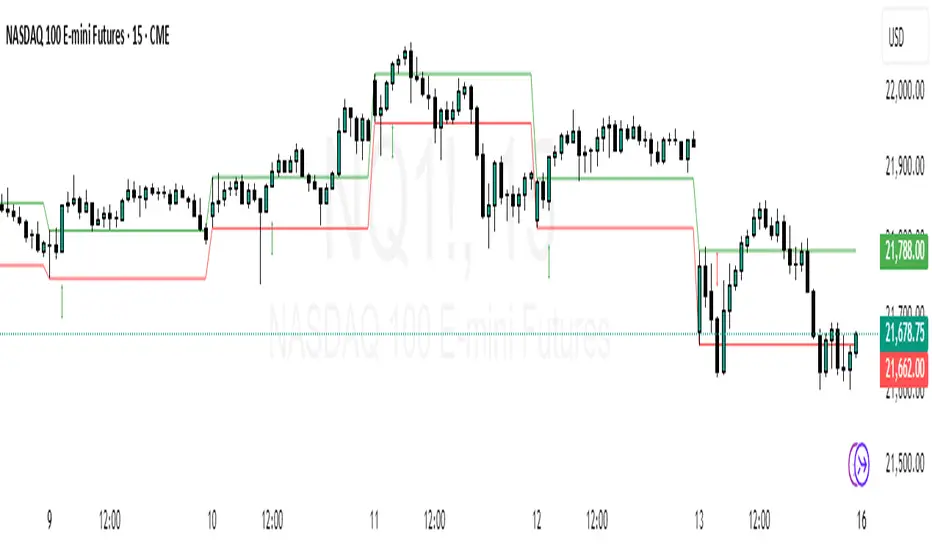
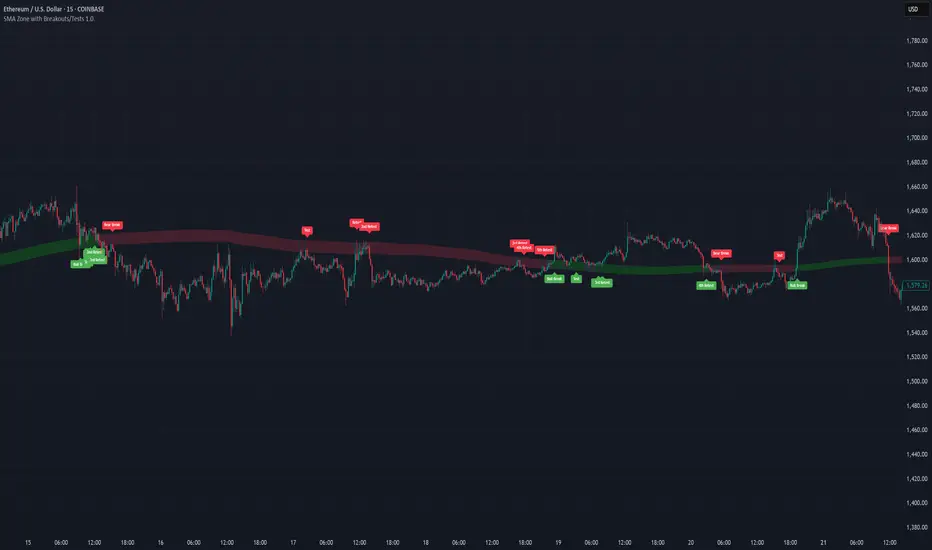
SMA Zone with Breakouts/Tests 1.0.This indicator plots a dynamic “SMA Zone” between two simple moving averages (one applied to lows, one to highs) and highlights key interaction points with the zone:
Breakouts
Bull Break: price closes above the upper SMA
Bear Break: price closes below the lower SMA
Requires confirmation via either above-average volume or an unusually wide bar (spread > ATR) closing near its extreme
Tests & Retests
After a breakout, the first re-entry into the zone edge is labeled “Test,” subsequent re-entries are numbered “Retest,” “2nd Retest,” etc.
Zone Weakening: each additional Test/Retest signifies diminished zone strength—fewer reliable boundaries remain (Traditional S/R theory)
Alerts
Fires a unified “Zone Signal” alert on every Break, Test, and Retest (set condition to “Any alert() function call”).
Disclaimer:
This is not financial advice and should not be used as a standalone trading signal.
It’s designed to draw your attention to important price-zone interactions so you can manually tune in.
The logic can be further enhanced or combined with other indicators/algorithms as part of a more complex trading system.
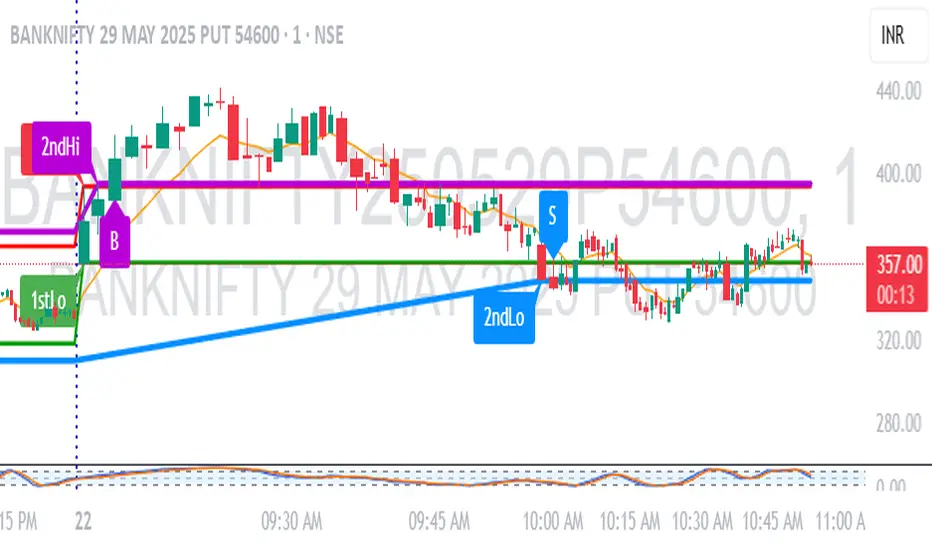
1M Scalp Setup – 2ndHi/2ndLo Breakout1M Scalp Setup – 2ndHi/2ndLo Breakout
This script is designed for 1-minute chart scalpers seeking high-probability intraday breakout setups based on early session price action. The strategy revolves around identifying the first high and low of the day, and then detecting the second breach (2nd high or 2nd low) to anticipate breakout entries.
🔍 Core Logic:
EMA Filter : A configurable EMA (default 8-period) is plotted for trend context.
1st High/Low Detection : Captures the very first high and low of each trading day.
2nd High/Low Markers : Identifies the second time price breaks the initial high or low, acting as a potential signal zone.
Breakout Signals :
A Buy Signal is triggered when price closes above the 2nd high.
A Sell Signal is triggered when price closes below the 2nd low.
Each signal is only triggered once per day to reduce noise and avoid overtrading.
🖌️ Visual Markers:
1stHi and 1stLo : Early session levels (red and green).
2ndHi and 2ndLo : Key breakout reference points (purple and blue).
B and S Labels : Buy and Sell triggers marked in real-time once breakouts occur.
⚙️ Inputs:
EMA Length (default: 8)
Customizable Colors for Buy/Sell signals and key markers
This tool is best used in fast-moving markets or during high-volume sessions. Combine with volume or higher-timeframe confirmation for improved accuracy.
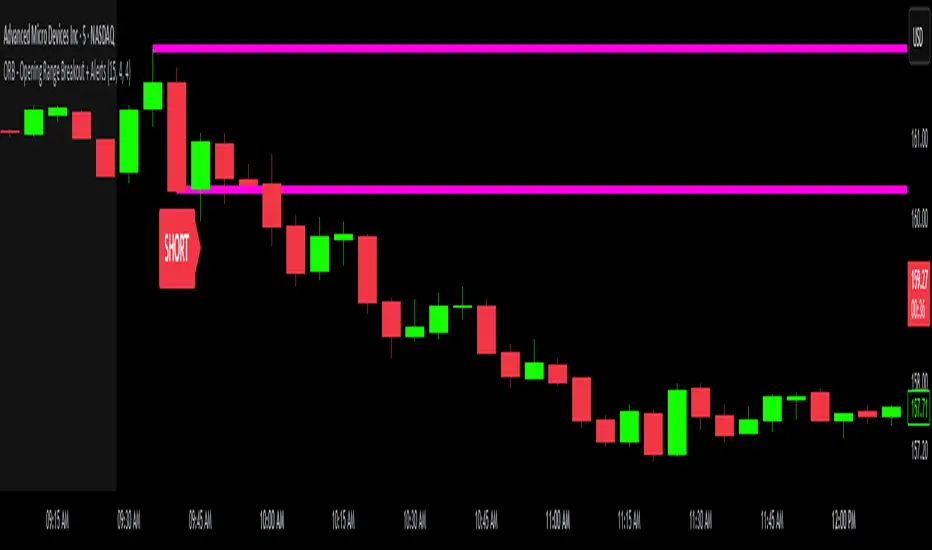
ORB - Opening Range Breakout + AlertsThe only ORB indicator you'll ever need.
- Flexible Range: Tailor the opening range (e.g., 5m, 15m, 30m) to your trading style.
- Key Levels: Auto-plots striking pink/purple support/resistance lines post-range for clear trade setups.
- Breakout Alerts: Reliable LONG/SHORT signals on 5m chart for confirmed breakouts; enable/disable as needed.
- Personalized Design: Customize line color and thickness for optimal visibility.
A friendly reminder that no tool or indicator guarantees success. Integrate this into a robust trading plan.
VWAP Breakout Strategy + EMAs + Clean Cycle/TP/SL PlotsHere’s a quick user-guide to get you up and running with your “VWAP Breakout Strategy + EMAs + Clean Cycle/TP/SL Plots” script in TradingView:
⸻
1. Installing the Script
1. Open TradingView, go to Pine Editor (bottom panel).
2. Paste in your full Pine-v6 code and hit Add to chart.
3. Save it (“Save as…”): give it a memorable name (e.g. “VWAP Breakout+EMAs”).
⸻
2. Configuring Your Inputs
Once it’s on the chart, click the ⚙️ Settings icon to tune:
Setting Default What it does
ATR Length 14 Period for average true range (volatility measure)
ATR Multiplier for Stop 1.5 How many ATRs away your stop-loss sits
TP1 / TP2 Multipliers (ATR) 1.0 / 2.0 Distance of TP1 and TP2 in ATR multiples
Show VWAP / EMAs On Toggles the blue VWAP line & EMAs (100/34/5)
Full Cycle Range Points 200 Height of the shaded “cycle zone”
Pivot Lookback 5 How many bars back to detect a pivot low
Round Number Step 500 Spacing of your dotted horizontal lines
Show TP/SL Labels On Toggles all the “ENTRY”, “TP1”, “TP2”, “STOP” tags
Feel free to adjust ATR multipliers and cycle-zone size based on the instrument’s typical range.
⸻
3. Reading the Signals
• Long Entry:
• Trigger: price crosses above VWAP
• You’ll see a green “Buy” tag at the low of the signal bar, plus an “ENTRY (Long)” label at the close.
• Stop is plotted as a red dashed line below (ATR × 1.5), and TP1/TP2 as teal and purple lines above.
• Short Entry:
• Trigger: price crosses below VWAP
• A red “Sell” tag appears at the high, with “ENTRY (Short)” at the close.
• Stop is the green line above; TP1/TP2 are dashed teal/purple lines below.
⸻
4. Full Cycle Zone
Whenever a new pivot low is detected (using your Pivot Lookback), the script deletes the old box and draws a shaded yellow rectangle from that low up by “Full Cycle Range Points.”
• Use this to visualize the “maximum expected swing” from your pivot.
• You can quickly see whether price is still traveling within a normal cycle or has overstretched.
⸻
5. Round-Number Levels
With Show Round Number Levels enabled, you’ll always get horizontal dotted lines at the nearest multiples of your “Round Number Step” (e.g. every 500 points).
• These often act as psychological support/resistance.
• Handy to see confluence with VWAP or cycle-zone edges.
⸻
6. Tips & Best-Practices
• Timeframes: Apply on any intraday chart (5 min, 15 min, H1…), but match your ATR length & cycle-points to the timeframe’s typical range.
• Backtest first: Use the Strategy Tester tab to review performance, tweak ATR multipliers or cycle size, then optimize.
• Combine with context: Don’t trade VWAP breakouts blindly—look for confluence (e.g. support/resistance zones, higher-timeframe trend).
• Label clutter: If too many labels build up, you can toggle Show TP/SL Labels off and rely just on the lines.
⸻
That’s it! Once you’ve added it to your chart and dialed in the inputs, your entries, exits, cycle ranges, and key levels will all be plotted automatically. Feel free to experiment with the ATR multipliers and cycle-zone size until it fits your instrument’s personality. Happy trading!

Hybrid: RSI + Breakout + DashboardHybrid RSI + Breakout Strategy
Adaptive trading system that switches modes based on market regime:
Ranging: Buys when RSI < 30 and sells when RSI > 70.
Trending: Enters momentum breakouts only in the direction of the 200-EMA bias, with ADX confirming trend strength.
Risk Management: Trailing stop locks profits and caps drawdown.
Optimized for BTC, ETH, and SOL on 1 h–1 D charts; back-tested from 2017 onward. Educational use only—run your own tests before deploying live funds.

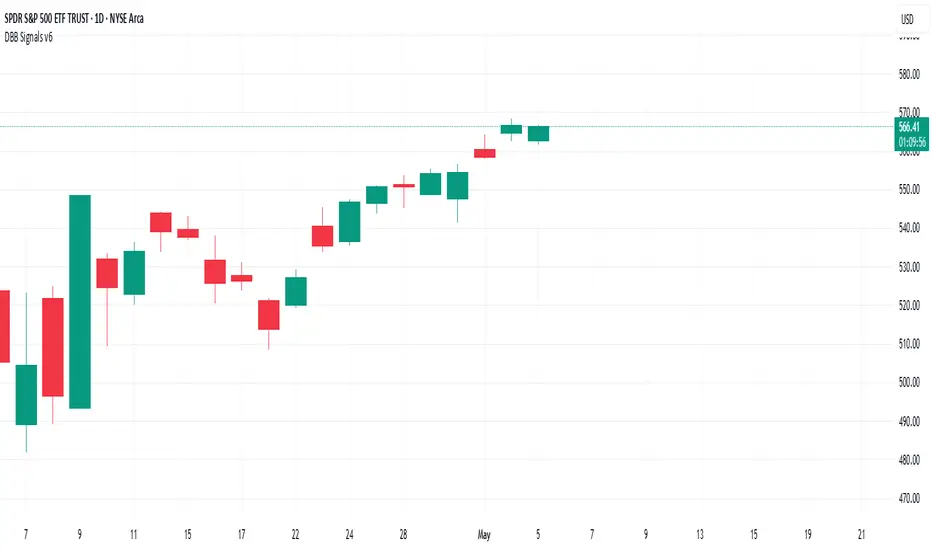
Darvas Box Breakout Signals v6 (Manus)Purpose:
This script is designed for TradingView to automatically identify potential "Darvas Boxes" on your price chart and signal when the price breaks out of these boxes.
How it Works:
Finds Highs: It looks back over a set number of bars (default is 20, but you can change this) to find the highest price point.
Confirms Box Top: It waits until the price stays below that high point for a specific number of bars (default is 3) to confirm the top of the box.
Confirms Box Bottom: After the top is confirmed, it looks for the lowest price reached and waits until the price stays above that low point for the same number of bars (3) to confirm the bottom of the box.
Draws Box (Optional): If enabled in the settings, it draws lines on the chart representing the top and bottom of the confirmed box.
What Signals It Shows:
Breakout Signal: When the price closes above the top line of a confirmed box, it plots a green upward-pointing triangle above that price bar. This suggests the stock might be starting a move higher.
Breakdown Signal: When the price closes below the bottom line of a confirmed box, it plots a red downward-pointing triangle below that price bar. This suggests the stock might be starting a move lower.
Key Features:
Uses the Darvas Box theory logic.
Provides clear visual signals for potential entries based on breakouts or breakdowns.
Allows customization of the lookback period and confirmation bars via the indicator settings.
Written in Pine Script version 6.
Remember, this script just provides signals based on price patterns; it doesn't predict the future or guarantee profits. It should be used as one tool within the larger trading plan we discussed, especially considering risk management.
Opening Range Breakout Cloud Indicator by TenAMTraderOpening Range Breakout Cloud Indicator – by TenAMTrader
This indicator visually maps out the Opening Range of the trading day — the price high and low between a configurable start and end time (default: 9:30 AM–10:00 AM EST). It helps traders identify breakout levels, key intraday zones, and price behavior relative to the early range.
🔹 What It Shows:
Opening High, Low, and Midpoint lines for each day.
Clouds between the midpoint and high/low for visual clarity.
Optional Second Range (e.g., 9:30–9:45 AM) for more aggressive early signals.
Historical Ranges are preserved, allowing you to view previous days' levels on the chart.
Custom Alerts when price crosses the Opening High, Low, or Midpoint.
Full customization: colors, range times, and display toggles.
🔔 Use It For:
Spotting breakouts or rejections at key levels.
Finding early support/resistance zones.
Planning trades using intraday structure.
⚠️ Use this tool as part of a broader trading strategy. No indicator guarantees results — always trade at your own discretion.
BTC Breakout Alert📈 BTC Breakout & Fakeout Detector with Volume, RSI & MACD Filters
This script helps identify high-confidence breakout setups by combining price action, volume spikes, and optional momentum filters (RSI & MACD). It’s designed to alert you when Bitcoin (or any asset) breaks above a defined resistance level with strong conviction — and warns you if that move turns out to be a fakeout.
🔍 Features:
✅ Confirmed Breakout Alerts: Triggers when price closes above your set resistance level with volume ≥ 1.5× the 20-period average.
⚠️ Fakeout Detection: Highlights when price closes back below resistance within a few candles after breakout.
📊 Momentum Filters:
RSI > 50 for bullish confirmation
MACD line > signal line to support breakout momentum
🔔 Custom Alerts: Built-in alert conditions for both breakout and fakeout events.
🔼🔽 Visual Markers: Arrows plotted directly on the chart for clear entry and caution zones.
🕒 Works on all timeframes and any asset that includes volume data.
Ideal for breakout traders who want more than just a price spike — this tool ensures volume and momentum alignment, helping you reduce false signals and react with more confidence.

OpeningRange (Trading_Tix)Purpose:
The indicator highlights the high, low, and middle (50%) price levels of a specified session's opening range. These levels can serve as key support and resistance zones for trading strategies. The indicator also offers options to extend these levels beyond the session into later timeframes, making it useful for tracking breakout or trend continuation setups.
Key Features:
1. Session Detection:
The indicator identifies a specific session period using the user-defined Session Time. It calculates the start time, high, and low prices during this period:
rangeTime: Defines the session time range (default: 5:00 PM to 2:59 AM).
extendTime: Defines the extended time range where lines/backgrounds can be prolonged.
2. Opening Range Calculation:
High (high_val) and Low (low_val)**:
Tracks the highest and lowest prices during the session.
Middle Line:
A midpoint is calculated by averaging high_val and low_val.
3. Visual Elements:
Horizontal Lines:
Drawn at the high, low, and middle levels.
Customizable in width and color.
Shaded Background Box:
Covers the range between high and low prices.
The box’s color and transparency can be adjusted.
Line and Box Extension:
Optionally extends these elements into the extended time range.
4. Customization:
Users have the flexibility to:
Toggle visibility of lines, middle line, and background box.
Adjust colors, line thickness, and style.
Enable or disable the extension of lines and backgrounds into the extended period.
How It Works:
Initialization:
The script initializes variables to store range data (startTime, high_val, low_val) and drawing objects (lines, boxes).
It detects whether the current bar falls within the session (inSession) or extended timeframe (inExtend).
Plotting:
During the session:
Deletes previous lines and boxes from prior sessions.
Draws new lines at the high, low, and middle levels.
Creates a background box covering the range, if enabled.
During the extended period:
Extends the session lines and box, if the user has opted for extensions.
Updates:
Continuously adjusts the high/low values and updates the lines as new price data arrives.
Use Cases:
This indicator can be valuable for traders who:
Use the opening range to identify potential breakout zones.
Trade based on price consolidation within the range.
Want a visual representation of key price levels to plan entries and exits.
Would you like help refining this script further or adjusting its settings to match your trading style?

ZVOL — Z-Score Volume Heatmapⓩ ZVOL transforms raw volume into a statistically calibrated heatmap using Z-score thresholds. Unlike classic volume indicators that rely on fixed MA comparisons, ZVOL calculates how many standard deviations each volume bar deviates from its mean. This makes the reading adaptive across timeframes and assets, in order to distinguish meaningful crowd behavior from random volatility.
📊 The core display is a five-zone histogram, each encoded by color and statistical depth. Optional background shading mirrors these zones across the entire pane, revealing subtle compression or structural rhythm shifts across time. By grounding the volume reading in volatility-adjusted context, ZVOL inhibits impulsive trading tactics by compelling the structure, not the sentiment, to dictate the signal.
🥵 Heatmap Coloration:
🌚 Suppressed volume — congestion, coiling phases
🩱 Stable flow — early trend or resting volume
🏀 High activity — emerging pressure
💔 Extreme — possible climax or institutional print
🎗️ A dynamic Fibonacci-based 21:34-period EMA ribbon overlays the histogram. The fill area inverts color on crossover, providing a real-time read on tempo, expansion, or divergence between price structure and crowd effort.
💡 LTF Usage Suggestions:
• Confirm breakout legs when orange or red zones align with range exits
• Fade overextended moves when red bars appear into resistance
• Watch for rising EMAs and orange volume to front-run impulsive moves
• Combine with volatility suppression (e.g. ATR) to catch compression → expansion transitions
🥂 Ideal Pairings:
• OBVX Conviction Bias — to confirm directional intent behind volume shifts
• SUPeR TReND 2.718 — for directional filters
• ATR Turbulence Ribbon — to detect compression phases
👥 The OBVX Conviction Bias adds a second dimension to ZVOL by revealing whether crowd effort is aligning with price direction or diverging beneath the surface. While ZVOL identifies statistical anomalies in raw volume, OBVX tracks directional commitment using cumulative volume and moving average cross logic. Use them together to spot fake-outs, anticipate structure-confirmed breakouts, or time pullbacks with volume-based conviction.
🔬 ZVOL isn’t just a volume filter — it’s a structural lens. It reveals when crowd effort is meaningful, when it's fading, and when something is about to shift. Designed for structure-aware traders who care about context, not noise.

BB Breakout + Momentum Squeeze [Strategy]This Strategy is Based on 3 free indicators
- Bollinger Bands Breakout Oscillator: Link
- TTM Squeeze Pro: Link
- Rolling ATR Bands: Link
Bollinger Bands Breakout Oscillator - This tool shows how strong a market trend is by measuring how often prices move outside their normal Bollinger bands range. It helps you see whether prices are strongly moving in one direction or just moving sideways. By looking at how much and how frequently prices push beyond their typical boundaries, you can identify which direction the market is heading over your selected time period.
TM Squeeze Pro - This is a custom version of the TTM Squeeze indicator.
It's designed to help traders spot consolidation phases in the market (when price is coiling or "squeezing") and to catch breakouts early when volatility returns. The logic is based on the relationship between Bollinger Bands and Keltner Channels, combined with a momentum oscillator to show direction and strength.
Rolling ATR Bands - This indicator combines volatility bands (ATR) with momentum and trend signals to show where the market might be breaking out, retesting, or trending. It's highly visual and helpful for traders looking to time entries/exits during trending or volatile moves.
Logic Of the Strategy:
We are going to use the Bollinger Bands Breakout to determine the direction of the market. Than check the Volatility of the price by looking at the TTM Squeeze indicator. And use the ATR Bands to determine dynamic Stop Losses and based on the calculate the Take Profit targets and quantity for each position dynamically.
For the Long Setup:
1. We need to see the that Bull Power (Green line of the Bollinger Bands Breakout Oscilator) is crossing the level of 50.
2. Check the presence of volatility (Green dot based on the TTM Squeeze indicator)
For the Short Setup:
1. We need to see the that Bear Power (Red line of the Bollinger Bands Breakout Oscilator) is crossing the level of 50.
2. Check the presence of volatility (Green dot based on the TTM Squeeze indicator)
Stop Loss is determined by the Lower ATR Band (for the Long entry) and Upper ATR Band (For the Short entry)
Take Profit is 1:1.5 risk reward ration, which means if the Stop loss is 1% the TP target will be 1.5%
Move stop Loss to Breakeven: If the price will go in the direction of the trade for at least half of the Risk Reward target then the stop will automatically be adjusted to the entry price. For Example: the Stop Loss is 1%, the price has move at least 0.5% in the direction of your trade and that will move the Stop Loss level to the Entry point.
You can Adjust the parameters for each indicator used in that script and also adjust the Risk and Money management block to see how the PnL will change.

Adaptable Relative Momentum Index [ParadoxAlgo]The Adaptable Relative Momentum Index (RMI) by ParadoxAlgo is an advanced momentum-based indicator that builds upon the well-known RSI (Relative Strength Index) concept by introducing a customizable momentum length. This indicator measures price momentum over a specified number of periods and applies a Rolling Moving Average (RMA) to both the positive and negative price changes. The result is a versatile tool that can help traders gauge the strength of a trend, pinpoint overbought/oversold levels, and potentially identify breakout opportunities.
⸻
Smart Configuration Feature
What sets this version of the RMI apart is ParadoxAlgo’s exclusive “Smart Configuration” functionality. Instead of manually adjusting parameters, traders can simply select their Asset Class (e.g., Stocks, Forex, Futures/Indices, Crypto, Commodities) and Trading Style (e.g., Scalping, Day Trading, Swing Trading, Short-Term Investing, Long-Term Investing). Based on these selections, the indicator automatically optimizes its core parameters:
• Length – The period over which the price changes are smoothed.
• Momentum Length – The number of bars used to calculate the price change.
By automating this process, users save time on tedious trial-and-error adjustments, ensuring that the RMI’s settings are tailored to the characteristics of specific markets and personal trading horizons.
⸻
Key Features & Benefits
1. Momentum-Based Insights
• Uses RMA to smooth price movements, helping identify shifts in market momentum more clearly than a basic RSI.
• Enhanced adaptability for a wide range of asset classes and time horizons.
2. Simple Yet Powerful Configuration
• Smart Configuration automatically sets optimal parameter values for each combination of asset class and trading style.
• Eliminates guesswork and manual recalibration when switching between markets or timeframes.
3. Overbought & Oversold Visualization
• Integrated highlight zones mark potential overbought and oversold extremes (default at 80 and 20).
• Optional breakout highlighting draws attention to times when the indicator crosses these key thresholds, helping spot possible entry or exit signals.
4. Intuitive Design & Ease of Use
• Clean plotting and color-coded signal lines make it easy to interpret bullish or bearish shifts in momentum.
• Straightforward dropdown menus keep the interface user-friendly, even for novice traders.
⸻
Practical Applications
• Early Trend Detection: Spot emerging trends when the RMI transitions from oversold to higher levels or vice versa.
• Breakout Confirmation: Confirm potential breakout trades by tracking overbought/oversold breakouts alongside other technical signals.
• Support/Resistance Confluence: Combine RMI signals with horizontal support/resistance levels to reinforce trade decisions.
• Trade Timing: Quickly gauge when momentum could be shifting, helping you time entries and exits more effectively.
⸻
Disclaimer
As with any technical indicator, the Adaptable Relative Momentum Index should be used as part of a broader trading strategy that includes risk management, fundamental analysis, and other forms of technical confirmation. Past performance does not guarantee future results.
⸻
Enjoy using the Adaptable RMI and experience a more streamlined, flexible approach to momentum analysis. Feel free to explore different asset classes and trading styles to discover which configurations resonate best with your unique trading preferences.

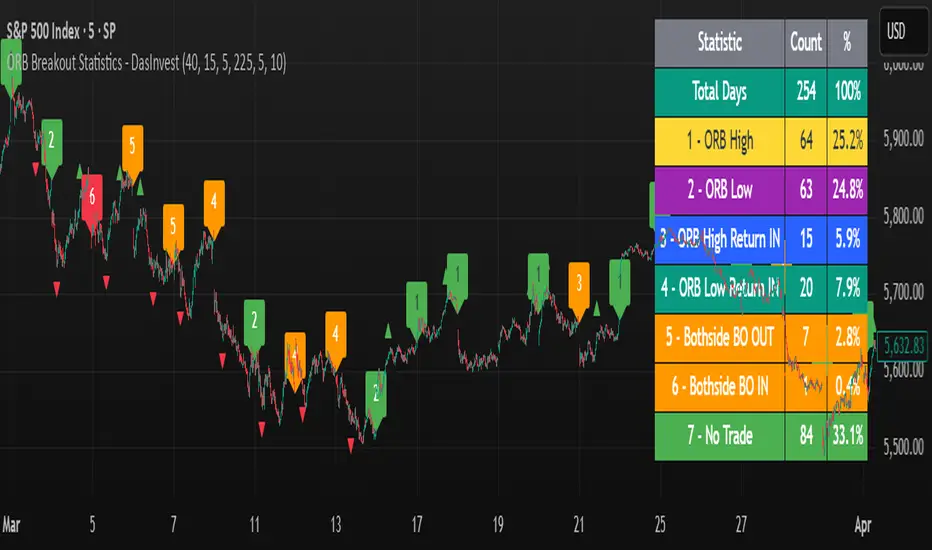
ORB Breakout Statistics with Labels and ProfitOpening Range Breakout Statistics – This indicator identifies the opening range based on user-defined inputs and detects breakouts above the high or below the low. At the end of each trading day, it classifies the session into a specific category based on price action. Additionally, it tracks profit and loss for each classification, allowing you to backtest the strategy using log files.
GLB - Green Line BreakoutThis script helps traders automatically detect Green Line Breakouts (GLBs) — a concept popularized by Dr. Eric Wish. A GLB occurs when a stock breaks out above a long-term pivot high that hasn’t been touched for a specified confirmation period (e.g., 3 months).
📌 Key Features:
Pivot High Detection based on customizable pivot strength.
Flexible Lookback Periods: Choose from 1 week to 5 years or ATH.
Confirmation Logic: Ensures the pivot remains unbroken for a set period before being marked as valid.
Breakout Detection: Marks the first breakout bar with a labeled event.
Dynamic Timeframe Support: Use daily bars or scale automatically with your chart's timeframe.
Historical Anchoring: Draws persistent lines from confirmation to breakout, helping visualize past GLBs.
🛠 Settings Include:
Pivot Strength
Timeframe Mode (Daily or Current)
Lookback Period (1W–ATH)
Confirmation Period (1W–1Y)
