ICT Killzones x FVGs @dancizyeaaICT Killzones x FVGs Indicator
Last update: 19-SEP-2025
Creator: dancizyeaa
This indicator targets key session highs and lows combined with Fair Value Gaps (FVGs) visualization on TradingView charts. It integrates multiple market sessions (Asia, London, New York), drawing killzones, session separators, and key price levels with user-configurable alerts and filtering. It supports dynamic timeframe limits, coloring by FVG size, moving averages, and labels.
The ICT Killzones x FVGs indicator highlights major session high and low price zones with added fair value gaps, assisting traders in identifying potential reversal or breakout areas. It automatically draws session lines, pivot points, and dynamically colors FVG rectangles by size. It includes options for timezone offsets, alert setups for pivot breaks, and versatile visual configuration for clear session segmentation and market structure awareness.
Detailed Function Descriptions
Session Time and Date Handling:
Manages time offsets and date components to correctly align session boundaries and day separators considering timezone differences, including a weekday naming system for chart labeling.
FVG Detection and Coloring:
Detects bullish and bearish Fair Value Gaps based on recent candles, calculates gap size, and colors gaps differently if they are small or normal size to highlight relevant market inefficiencies.
Killzone (Session High/Low Zone) Management:
Creates and updates boxes, lines, and labels representing important market session zones from Asia to New York, including the ability to extend or limit these objects across timeframes and manage range averages.
Pivot Points and Midpoint Labels:
Draws session-specific pivot highs/lows and optional midpoint lines with alert conditions when these levels are broken, allowing traders to track and be notified of key market moves.
Session Separators and Open Lines:
Draws vertical and horizontal lines marking daily, weekly, and monthly open prices and session start/end boundaries with customizable styling, enhancing chart structure clarity.
Moving Average Overlay:
Optionally plots a user-defined simple moving average line for trend analysis, with customizable length and color.
Alert System:
Provides user-configurable alerts on pivot breaks and other key events, ensuring timely trading signals.
User Inputs and Settings:
Extensive input options to customize timezone offset, session visibility, line styles, transparency, label sizes and positions, and filter parameters for FVGs for a tailored trading experience.
חפש סקריפטים עבור "fvg"

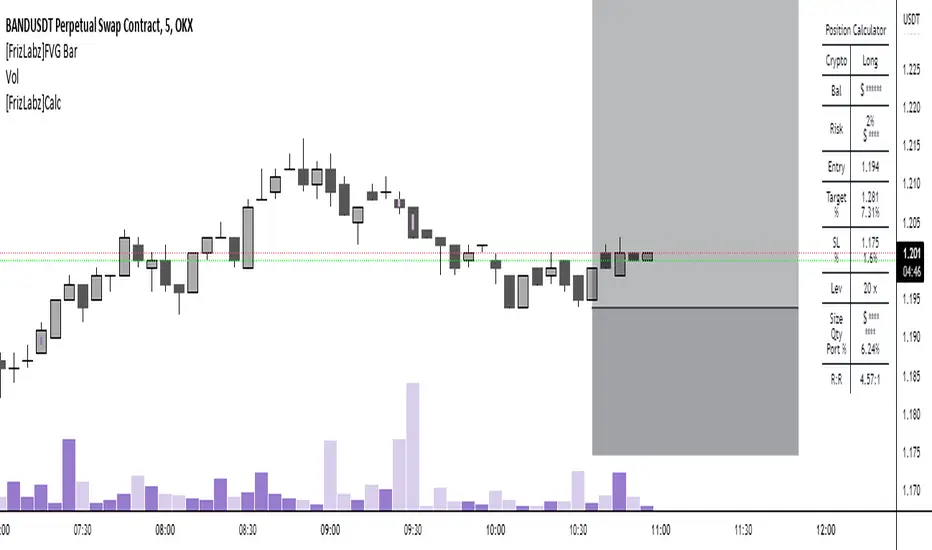
[FrizLabz]FVG Bar
For those of you that like to keep your charts nice and tidy for your Technical Analysis!
FVG = Fair Value Gap
Fair Value Gaps are when impulse movements create an imbalance in price leaving unfilled orders.. they are popular because after one is created we often observe price return to fill these unfilled orders
3 candles make a FVG
When the high/low of most recent candle is lower/high than the low/high of the bar before last
Similar to my other FVG indicator but this one allows you to delete Filled FVGs and have them adjust when filled
Uses a line whose x1 and x2 are on the FVG bar and adjust the size of the FVG with line width because line width on line.new()s doesnt have a cap on line width like plot()s do
Not much too it I made this because a few people were asking if they could delete the FVG after it was Mitigated and since my other uses plots it wasnt possible
so I hope this works for those who were asking about it
hope you enjoy please let me know if you have an idea or find a bug,
Thank You! -
Bearish Breakaway Dual Session-FVGInspired by the FVG Concept:
This indicator is built on the Fair Value Gap (FVG) concept, with a focus on Consolidated FVG. Unlike traditional FVGs, this version only works within a defined session (e.g., ETH 18:00–17:00 or RTH 09:30–16:00).
See the Figure below as an example:
Bearish consolidated FVG & Bearish breakaway candle
Begins when a new intraday high is printed. After that, the indicator searches for the 1st bearish breakaway candle, which must have its high below the low of the intraday high candle. Any candles in between are part of the consolidated FVG zone. Once the 1st breakaway forms, the indicator will shades the candle’s range (high to low). Then it will use this candle as an anchor to search for the 2nd, 3rd, etc. breakaways until the session ends.
Session Reset: Occurs at session close.
Repaint Behavior:
If a new intraday (or intra-session) high forms, earlier breakaway patterns are wiped, and the system restarts from the new low.
Counter:
A session-based counter at the top of the chart displays how many bullish consolidated FVGs have formed.
Settings
• Session Setup:
Choose ETH, RTH, or custom session. The indicator is designed for CME futures in New York timezone, but can be adjusted for other markets.
If nothing appears on your chart, check if you loaded it during an inactive session (e.g., weekend/Friday night).
• Max Zones to Show:
Default = 3 (recommended). You can increase, but 3 zones are usually most useful.
• Timeframe:
Best on 1m, 5m, or 15m. (If session range is big, try higher time frame)
Usage:
See this figure as an example
1. Avoid Trading in Wrong Direction
• No Bearish breakaway = No Short trade.
• Prevents the temptation to countertrade in strong uptrends.
2. Catch the Trend Reversal
• When a bearish breakaway appears after an intraday high, it signals a potential reversal.
• You will need adjust position sizing, watch out liquidity hunt, and place stop loss.
• Best entries of your preferred choices: (this is your own trading edge)
Retest
Breakout
Engulf
MA cross over
Whatever your favorite approach
• Reversal signal is the strongest when price stays within/below the breakaway candle’s
range. Weak if it breaks above.
3. Higher Timeframe Confirmation
• 1m can give false reversals if new lows keep forming.
• 5m often provides cleaner signals and avoids premature reversals.
Summary
This indicator offers 3 main advantages:
1. Prevents wrong-direction trades.
2. Confirms trend entry after reversal signals.
3. Filters false positives using higher timeframes.
Failed example:
Usually happen if you are countering a strong trend too early and using 1m time frame
Last Mention:
The indicator is only used for bearish side trading.

Bullish Breakaway Dual Session-Publish-Consolidated FVG
Inspired by the FVG Concept:
This indicator is built on the Fair Value Gap (FVG) concept, with a focus on Consolidated FVG. Unlike traditional FVGs, this version only works within a defined session (e.g., ETH 18:00–17:00 or RTH 09:30–16:00).
Bullish consolidated FVG & Bullish breakaway candle
Begins when a new intraday low is printed. After that, the indicator searches for the 1st bullish breakaway candle, which must have its low above the high of the intraday low candle. Any candles in between are part of the consolidated FVG zone. Once the 1st breakaway forms, the indicator will shades the candle’s range (high to low). Then it will use this candle as an anchor to search for the 2nd, 3rd, etc. breakaways until the session ends.
Session Reset: Occurs at session close.
Repaint Behavior:
If a new intraday (or intra-session) low forms, earlier breakaway patterns are wiped, and the system restarts from the new low.
Counter:
A session-based counter at the top of the chart displays how many bullish consolidated FVGs have formed.
Settings
• Session Setup:
Choose ETH, RTH, or custom session. The indicator is designed for CME futures in New York timezone, but can be adjusted for other markets.
If nothing appears on your chart, check if you loaded it during an inactive session (e.g., weekend/Friday night).
• Max Zones to Show:
Default = 3 (recommended). You can increase, but 3 zones are usually most useful.
• Timeframe:
Best on 1m, 5m, or 15m. (If session range is big, try higher time frame)
Usage
1. Avoid Trading in Wrong Direction
• No bullish breakaway = No long trade.
• Prevents the temptation to countertrade in strong downtrends.
2. Catch the Trend Reversal
• When a bullish breakaway appears after an intraday low, it signals a potential reversal.
• You will need adjust position sizing, watch out liquidity hunt, and place stop loss.
• Best entries of your preferred choices: (this is your own trading edge)
Retest
Breakout
Engulf
MA cross over
Whatever your favorite approach
• Reversal signal is the strongest when price stays within/above the breakaway candle’s
range. Weak if it breaks below.
3. Higher Timeframe Confirmation
• 1m can give false reversals if new lows keep forming.
• 5m often provides cleaner signals and avoids premature reversals.
Failed Trade Example:
This indicator will repaint if a new intraday session low is updated. So it is possible to have a failed trade. Here is an example from the same session in 1m chart. However, if you enter the trade later at another bullish breakaway candle signal. The loss can be mitigated by the profit.
Therefore you should use smaller position size for your 1st trade. You should also considering using 5m chart to avoid 1m bull trap. In this example, if you use 5m chart, you can totally avoid this failed trade.
If you enter the trade, you will see the intraday low is stop loss hunted. You can also see the 1st bullish breakaway candle is super weak. There are a lot of candles below the breakaway candle low, so it is very possible to fail.
In the next chart, you can see the failed traded get stop loss hunted. However you can enter another trade with huge profit to win back the loss from the 1st trade if you follow the rule.
Summary
This indicator offers 3 main advantages:
1. Prevents wrong-direction trades.
2. Confirms trend entry after reversal signals.
3. Filters false positives using higher timeframes.
How to sharp your edge:
1. ⏳Extreme patience⏳: Do not guess the bottom during a downtrend before a confirmed bullish breakaway candle. If you get caught, have the courage to cut loss. This is literally the most important usage of this indicator. Again, this is the most important rule of this indicator and actually the hardest rule to follow.
2. 🛎Better Entry🛎: After a confirmed bullish breakaway, you will always have a good opportunity to enter the trade using established trading technique. Your edge will come from the position size, draw down, stop loss placement, risk/reward ratio.
3. ✂Cut loss fast✂: If you enter a trade according to the rule, but you are still not making profit for a period of time, and the price is below the low of the breakaway candle. It is very likely you may hit stop loss soon (intraday session low). It won't be a bad idea to cut loss before stop loss hit.
4. 🔂Reentry with confidence after stop loss🔂: a stop loss will not invalidate the indicator. If you see a second chance to reenter, you should still follow the trade guide and rule.
5. 🕔Time frame matter🕔: try 1m, 3m, 5m, 10m, 15m time frame. Over time, you should know what time frame work best for you and the market. Higher time frame will reduce the noise of false positive trade, but it comes with a higher stop loss placement and less max profit, however it may come with a lower draw down. Time frame will matter depending on the range of the session. If the session range is small (<0.5%), lower time frame is good. If session range is big (>1%), 5m time frame is better. Remember to wait for candle to close, if you use higher time frame.
Last Mention:
The indicator is only used for bullish side trading.

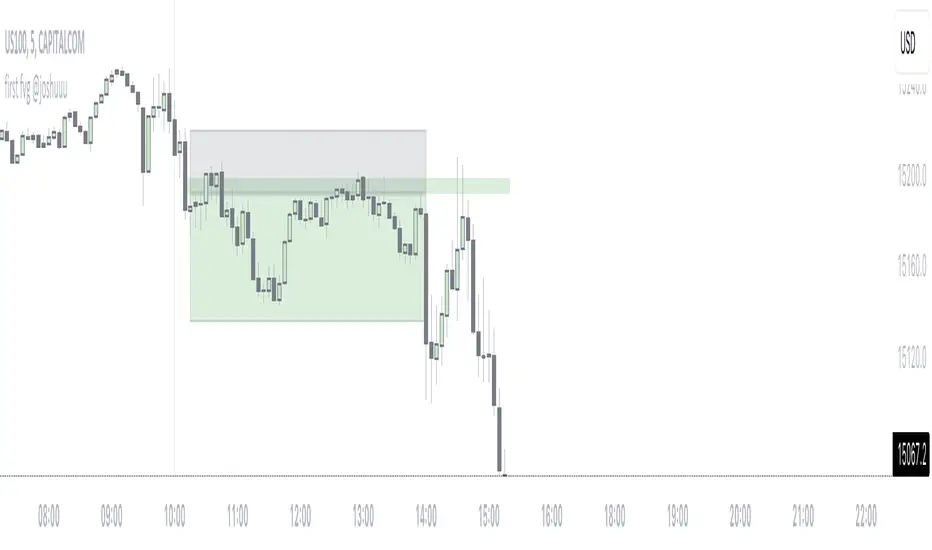
first fvg @joshuuuThis indicator was created to display and alert the user for the first Fair Value Gap (FVG) of up to three trading sessions.
Bullish FVG occurs when the high of the first candle is lower than the low of the third candle, resulting in a price gap between them.
Conversely, a Bearish FVG takes place when the low of the first candle is higher than the high of the third candle, leading to a gap between these prices.
ICT emphasizes on three crucial timeframes: 3-4 am NY, 10-11 am NY, and 2-3 pm NY, collectively referred to as the 'silver bullet' times. The very first FVG formed during these periods can significantly impact the remainder of that trading session.
Building upon these concepts, CasperSMC developed a strategy involving buying/selling the very first FVG and placing a stop order just above/below the candle responsible for creating the FVG.
The strategy aims for a consistent 2-to-1 Reward-to-Risk ratio (2RR).
This indicator serves to support the strategy by not only displaying those fvgs but also sending alerts, reducing the need for constant screen monitoring.
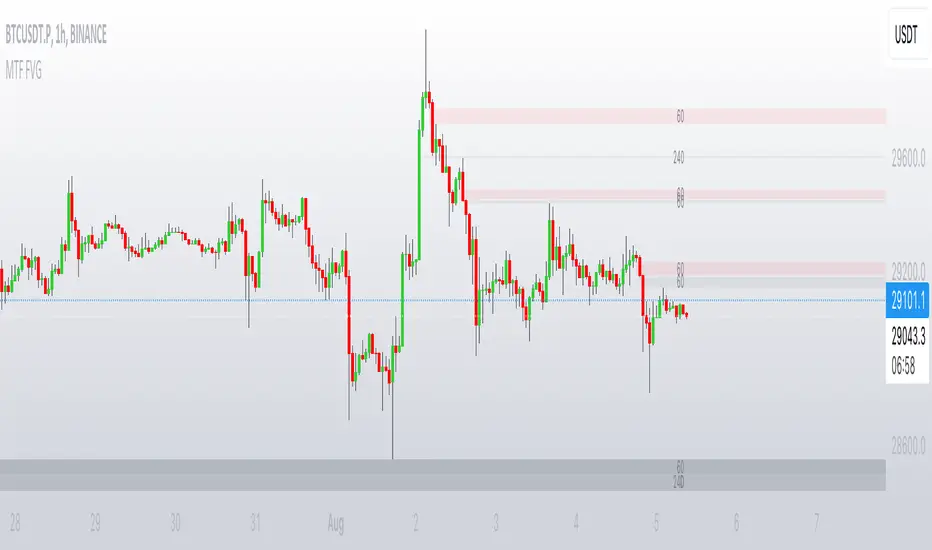
MTF FVGThis script finds Imbalance (Fair Value Gap (FVG)) on multi timeframes.
If needed all TF can be used at once: 1, 3, 5, 15, 30, 45, 60, 120, 180, 240, D, W.
It finds FVG on any desired TF that is greater or equal than TF on the chart.
FVG stands for fair value gap, which is a three-candle structure that indicates an imbalance or inefficiency in the market. An imbalance means that the buying and selling is not equal, and there is a gap between the fair value and the market value of an asset. A bullish FVG shows that the market value is lower than the fair value, and a bearish FVG shows the opposite.
FVG takes place in a series of 3 candles when the middle candle gaps up or down. This signals strong buying or selling pressure in the direction of the gap. When a gap occurs the wicks of the candles do not overlap each other.
[PlayBit] FVG/EMAThis Indicator was made for the PlayBit Community by @FFriZz
This indicator includes 2 of the most used indicators within the community
1. FVG indicator -- Very minimalistic version seems to be the most used
2. EMA indicator -- Indicator made by using two 200 EMAs one tracking highs and one tracking closes -- to form a 200 EMA Channel
-- The EMA Can be used as a single one on the current chart or there are 5 other options that will allow you to track up to 5 timeframes
higher or lower
----- Options ------
-- FVGs --
1. Ability to keep FVGs on chart when Filled/Mitigated or have them Deleted
2. Setting to Change the border of the FVG when it has been tested
3. Can have the FVGs resize to the untapped area
4. Setting to adjust the number of FVGs that are displayed on Chart at a time
-- EMA --
1. Up to 5 Different timeframes
2. Color Switch if close is above or below EMAs
3. Color Settings
Shout out to the PlayBit Community
for being a great community for Trading and in general!
If anyone finds any bugs Please let me know on here or on PlayBit
or if I removed something in this version you would like to see put back..
Hope you enjoy!
@FFriZz | @FrizLabz
FVG pointsFVGs ( fair value gaps) are imbalances that indicate displacement and are useful for reversal strategies that require displacement after a liquidity sweep
This indicator shows the size of the gap in points/dollars which can help determine momentum and strength in reversals, as does a failure or inversion (iFVG) of these gap if they fail to act as support or resistance to price. As stops are often placed on the other side of a fair value gap from entry, the indicator helps give traders an idea of stop loss size for calculating position size.
Fvg gaps below a certain points size can be considered to be weaker, larger gaps show stronger momentum. The indicator allows a minimum point size to be set so that FVGs below this minimum value will be shown without a points value.
Points value is also shown for inverted FVGs (iFVGs) by a change in colour and length of box.
By default, multiple gaps are combined together and the point value of the gap is shown, this can be toggled off in the settings to show the values of the individual gaps.
Settings:
Lookback - how many candles to look for FVGs and iFVGs
Change length of the FVG box
Change settings to decide the minimum size of gap to label
colours of boxes and labels
Option to show individual gaps or combined gaps

ZynIQ FVG Master Pro v2 - (Pro Pack)Overview
ZynIQ FVG Master v2 (Pro) identifies fair value gaps and highlights key imbalance zones within price action. It includes detection for standard and extended FVGs, optional mitigation logic and context filters to help traders understand where inefficiencies may be filled.
Key Features
• Detection of regular and extended FVGs
• Optional mitigation and fill markers
• Configurable minimum gap size and sensitivity
• Direction-aware colour coding
• Optional smart filtering to reduce low-quality gaps
• Clean visuals designed for intraday and swing analysis
• Can be used alongside structure and liquidity tools for confluence
Use Cases
• Identifying imbalance zones likely to be revisited
• Spotting high-probability mitigation areas
• Combining FVGs with BOS/CHOCH or liquidity sweeps
• Mapping context for continuation and reversal setups
Notes
This tool provides FVG and imbalance context. It is not a standalone trading system. Use with your preferred confirmation and risk management.

ICT Fair Value Gap (FVG) Detector │ Auto-Mitigated │ 2025Accurate ICT / Smart Money Concepts Fair Value Gap (FVG) detector
Features:
• Detects both Bullish (-FVG) and Bearish (+FVG) using strict 3-candle rule
• Boxes automatically extend right until price mitigates them
• Boxes auto-delete when price closes inside the gap (true mitigation)
• No repainting – 100% reliable
• Clean, lightweight, and works on all markets & timeframes
• Fully customizable colors and transparency
How to use:
– Bullish FVG (green) = potential support / buy zone in uptrend
– Bearish FVG (red) = potential resistance / sell zone in downtrend
Exactly matches The Inner Circle Trader (ICT) methodology used by thousands of SMC traders in 2024–2025.
Enjoy and trade safe!

NativeLenSA CISD w/1st 5m FVG5m CISD + FVG Indicator which works best on 5m TimeFrame, with the concept of 5m Liquidity sweeps of the previous highs/lows and the next candle closing below/above the opening price of candle that swept the highs/lows.
A line marking +CISD or -CISD will show as soon as the CISD is created, and a first 5m Fair Value Gap will also be displayed. This is advantageous for an extra confluence and re-entry.
The indicator also provides the trader with:
i. The flexibility of allowing to only show Bearish, Bullish or both Bearish and Bullish CISD + FVG,
ii. Showing only London Session, New York Session, or both London and New York Sessions' CISD & FVG,
iii. Option of hiding/showing 5m CISD+FVG on time frames greater than 5m,
iv. Adjustable:
(a) Look back bars (max=300),
(b) CISD line length,
(c) FVG line length,
v. Customizable Bearish and Bullish CISD line colors.
I hope you find value in this indicator, and convenient for time when trading, no CISD markups needed

London ORB + Session High/Low + FVGLondon ORB + Session High/Low + FVG
📘 Script Description: London ORB + Session High/Low + Fair Value Gap
This script is designed to assist intraday traders during the London session open by combining:
🕒 1. Opening Range Breakout (ORB)
Captures the high and low of the first 15-minute candle after the London open (08:00–08:15 GMT).
Draws lines and labels for the ORB High and Low levels.
Detects breakouts above or below the ORB and plots a triangle signal at the breakout bar.
🌐 2. Asian & US Session Levels
Automatically marks the highs and lows of the Asian (00:00–06:00 GMT) and US (13:30–20:00 GMT) sessions.
Useful for identifying prior session liquidity zones, key support/resistance levels, and potential reaction areas.
📉 3. Fair Value Gaps (FVG)
Highlights imbalances in price action between non-overlapping candles (also known as FVGs or inefficiencies).
Draws a shaded box between candles where gaps exist:
Green for bullish FVGs
Red for bearish FVGs
🔔 4. Alert Support
Optional alerts are built in for:
Long breakout (price breaks above ORB)
Short breakout (price breaks below ORB)
🎯 Use Case
Perfect for:
Day traders looking to capitalize on early volatility at the London open
Traders using liquidity-based strategies, retests, or gap-fills
Visualizing and aligning with prior session highs/lows for structure and context

skX FVG Enhanced Indicator [1m,5m] skX FVG Indicator
Fair Value Gaps (FVGs) are particularly effective for scalping altcoins due to their tendency to fill price inefficiencies. These gaps occur during strong momentum moves where price leaves an 'empty' zone that often acts as a magnet for price to return to. In the volatile alt market, these gaps frequently present high-probability scalping opportunities.
Why FVGs Work in Alts:
• Quick price movements create more gaps
• Higher volatility increases gap frequency
• Institutional algorithms tend to fill these inefficiencies
• Works especially well in lower timeframes (1-5m)
Key Features:
✓ Automatic FVG detection with size filtering
✓ Smart timeframe adaptation (1m, 5m, Custom settings)
✓ Trend detection using 8/21/55 EMA system
✓ Dynamic TP/SL levels based on ATR
✓ Risk:Reward ratio automation
✓ Visual signals that stick to price levels
✓ Clear information display panel
✓ Built-in alerts system
How to Use:
1. Select your preferred timeframe (1m or 5m recommended)
2. Watch for triangle signals (▲ bullish, ▼ bearish)
3. Confirm with trend direction (shown in panel)
4. Use provided TP/SL levels for trade management
5. Set alerts for new FVG formations
Settings Explained:
• Auto Mode: Adjusts gap size to timeframe
• Custom Gap Size: Manual gap size control
• ATR Period: Volatility measurement window
• ATR Multiplier: Stop loss distance
• Risk:Reward: Take profit ratio
Best Practices:
• Use in conjunction with support/resistance
• Trade in direction of main trend
• Monitor higher timeframe structure
• Start with recommended settings
• Backtest before live trading
Note: This indicator works best in volatile market conditions and should be used as part of a complete trading strategy.
Good luck trading!
-skX

Simple FVGSimple FVG - Fair Value Gap Indicator
Overview:
The "Simple FVG" script is designed for use with TradingView to identify and visually display Fair Value Gaps (FVG) on a trading chart. This indicator highlights both bullish and bearish imbalances based on specific candlestick patterns, helping traders to quickly identify potential trading opportunities.
Key Features:
Bullish and Bearish Imbalances:
Bullish Imbalances: This script identifies bullish imbalances where the price exhibits a gap upward. The conditions for detecting a bullish imbalance are:
The high of the second candle is greater than the high of the first candle.
The low of the third candle is greater than the high of the first candle.
Bearish Imbalances: This script identifies bearish imbalances where the price exhibits a gap downward. The conditions for detecting a bearish imbalance are:
The low of the second candle is less than the low of the first candle.
The high of the third candle is less than the low of the first candle.
Customizable Display:
Bullish Blocks: Users can toggle the display of bullish imbalance blocks with customizable colors and border settings.
Bearish Blocks: Users can toggle the display of bearish imbalance blocks with customizable colors and border settings.
Color and Border Settings: Adjust the color, border color, and border width of the blocks for both bullish and bearish imbalances according to user preferences.
Visual Representation:
Drawing Blocks: The script draws filled boxes on the chart to represent identified imbalances. These blocks span from the start of the first candlestick to the end of the third candlestick, providing a clear visual indicator of the price gap.
How It Works:
Identification Logic:
The script analyzes three consecutive candles to determine if an imbalance exists.
It compares the highs and lows of these candles to establish bullish or bearish conditions.
Drawing Mechanism:
Once an imbalance condition is met, the script calculates the top and bottom levels of the imbalance block based on the high of the first candle and the low of the third candle for bullish imbalances, and vice versa for bearish imbalances.
It then draws these blocks on the chart using the specified colors and border settings.
Usage Instructions:
Add the Indicator:
Apply the "Simple FVG" indicator to your TradingView chart.
Customize Settings:
Use the input options to enable or disable the display of bullish and bearish blocks.
Adjust the colors and border settings for the imbalance blocks as needed.
Interpret Imbalances:
Look for the drawn blocks to identify potential areas where price imbalances have occurred.
Use this information to inform your trading decisions.
Originality and Value:
The "Simple FVG" script offers a unique approach to visualizing Fair Value Gaps by focusing on specific candlestick patterns. It provides traders with a tool to easily identify and analyze price imbalances, enhancing chart analysis and trading strategy development.
Chart Information:
Ensure to show the complete symbol, timeframe, and script name information on your chart for clarity and reference.
For further details and usage guidelines, refer to the TradingView House Rules.
Note: This script adheres to TradingView's guidelines for originality and usefulness, offering a practical tool for traders seeking to enhance their chart analysis.
This description adheres to TradingView's requirements by providing a detailed explanation of the script's functionality, how it works, and how users can benefit from it.
ICT Asian & London Range + First Presented FVGIndicator: ICT Sessions + First Presented FVG
What it does: This tool automates the markup of key ICT (Inner Circle Trader) timeframes and entry signals. It allows you to trade on higher timeframes (like the 5m or 15m) while the script automatically "looks inside" the 1-minute chart to find specific setups for you.
Key Features:
Session Ranges (Asian & London)
Automatically highlights the Asian Session (8 PM - Midnight NY) and London Open (2 AM - 5 AM NY).
Draws a shaded box for the session's High and Low.
New: Extends the High and Low lines to 4:00 PM NY (end of the trading day) so you can use them as liquidity targets.
The "First Presented" FVG (Sniper Logic)
It detects the very first Fair Value Gap (FVG) that forms on the 1-minute chart immediately after a session starts.
It draws this 1-minute gap on your current chart, regardless of what timeframe you are viewing.
The FVG box automatically extends to the end of the trading day (4 PM NY), showing you where price might return to "mitigate" or react later in the day.

Basic FVG (Zuki)This indicator identifies and displays Fair Value Gaps (FVGs) to highlight market imbalances.
FEATURES:
- Detects classic bullish and bearish FVGs.
- Option to automatically delete FVGs once filled by a wick.
- Customize FVG colors and box length.
- Use Lookback Period and Max FVG settings to keep the chart clean.
Simple

Automatic Closest FVG with BPRFair Value Gaps are a hugely popular concept and because of that there are numerous indicators available. This one however, was designed to automate the process of actually using them in trading.
Designed with lower time frame entries in mind (though will work on HTF just as well), this indicator automatically draws the closest, non-mitigated FVG, to the current price, cutting out the work of looking for what FVG is relevant.
The indicator also has an option to show when the current nearest pair of FVGs form a BPR or 'balanced price range'.
There are various option for what counts as mitigation, including no mitigation at all, and when mitigated an FVG is no longer considered for proximity searching.

[FrizLabz]MTF FVGMulti-TimeFrame FVGs
FVG = Fair Value Gap
an FVG indicates an impulsive move which leaves unfilled orders in the imbalance to which usually we observe price return to and fill the unfilled orders
also an indication of BIG Money entering the market
To be used with your Top-Down analysis with Smart Money Strategies
6 Options for TFs
Best to Check Multipule TFs since some of the FVGs will be mitigated around Creation because the indicator uses the high and low of current chart
Let me know if you find any bugs Please and Thank you
FVG TrackerFVG Tracker indicator automatically detects and displays Fair Value Gaps (FVGs) on the chart and tracks which ones remain untapped by price.
Overview
A fair value gap occurs when price moves sharply, leaving an imbalance between buyers and sellers.
This script identifies those imbalances and keeps only the (untouched) ones visible, removing gaps once price trades back into them.
It also provides optional visualization tools such as boxes, horizontal rays, and a customizable symbol marker.
Features
Detects both bullish and bearish FVGs
Automatically removes FVGs once they are filled or tapped
Adjustable colors, transparency, and border styling
Optional horizontal rays and custom symbol ($) markers
Independent control over visibility and styling for bullish and bearish gaps
Purpose
This indicator is designed purely as a visual reference to study market structure and price imbalances.
It does not produce trading signals and should be used alongside other forms of technical analysis for context and confirmation.

Basic FVG Indicator by nacho-fx mod by evseevd2803Basic FVG Indicator by nacho-fx ( www.tradingview.com )
-Extends unfilled FVG boxes.
-Stops extending filled FVG boxes instead of removing them.

ICT Fair Value Gap (FVG) DetectorFair Value Gap (FVG) Indicator
Purpose: Highlights price gaps between three consecutive candles, which signal areas of imbalance that may later act as support or resistance.
How It Works: The script looks for a gap between the high of two bars ago and the low of the current bar (bullish FVG) or the low of two bars ago and the high of the current bar (bearish FVG).
Visuals: These gaps are marked as transparent boxes on the chart, extended to the right until they are "filled" or mitigated by price returning into the gap.
Customization: You can adjust which gaps show, their colors, thresholds, and other display options.

Imbalance(FVG) DetectorImbalance (FVG) Detector
Overview
The Imbalance (FVG) Detector is a technical analysis tool designed to highlight price inefficiencies by identifying Fair Value Gaps (FVGs). These gaps occur when rapid price movement leaves an area with little to no traded volume, which may later act as a zone of interest. The indicator automatically detects and marks these imbalances on the chart, allowing users to observe historical price behavior more effectively.
Key Features
- Automatic Imbalance Detection: Identifies bullish and bearish imbalances based on a structured three-bar price action model.
- Customizable Sensitivity: Users can adjust the minimum imbalance percentage threshold to tailor detection settings to different assets and market conditions.
- Real-time Visualization: Marked imbalances are displayed as colored boxes directly on the chart.
- Dynamic Box Updates: Imbalance zones extend forward in time until price interacts with them.
- Alert System: Users can set alerts for when new imbalances appear or when price tests an existing imbalance.
How It Works
The indicator identifies market imbalances using a three-bar price structure:
- Bullish Imbalance: Occurs when the high of three bars ago is lower than the low of the previous bar, forming a price gap.
- Bearish Imbalance: Occurs when the low of three bars ago is higher than the high of the previous bar, creating a downward gap.
When an imbalance is detected:
- Green Boxes indicate bullish imbalances.
- Red Boxes indicate bearish imbalances.
- Once price interacts with an imbalance, the box fades to gray, marking it as tested.
! Designed for Crypto Markets
This indicator is particularly useful in crypto markets, where frequent volatility can create price inefficiencies. It provides a structured way to visualize gaps in price movement, helping users analyze historical liquidity areas.
Customization Options
- Min Imbalance Percentage Size: Adjusts the sensitivity of the imbalance detection.
- Alerts: Users can enable alerts to stay notified of new or tested imbalances.
Important Notes
- This indicator is a technical analysis tool and does not provide trading signals or financial advice.
- It does not predict future price movement but highlights historical price inefficiencies.
- Always use this tool alongside other market analysis methods and risk management strategies.

STIC bullish and bearish hunter with FVGSmart Trading and Investment Companion (STIC) is a sophisticated tool designed to identify and visualize inducement, market structure, market trends, track liquidity, and project and forecast price action for all applicable assets. it has been tested to work on all timeframes and has been traded on stock, forex, and crypto assets.
This script is an upgraded version of previous STIC indicator, which you can use in addition to it or separately as you deem fit
Traders/ investor that are familiar with market structure, inducement, candlestick psychology, trend-following indicatorsand Fair Value Gap FVG will find it easy to adopt this trading and investment companion. As stated below, this is how it works.
Features and how to use
1st of all, after adding the indicator to yoursuperchart, you want to endusre to set your to so as to enable you see the text labeling clearly. to do that, after adding the indicator to your chart, right click it on the list, you will se the Visual order option.
Special Extreme Alert!
By analyzing the trends and dimensions, we are able to predict market extremes conditions, especially in pump and dump scenarios. (the bullish or bearish P/D extreme alerts).
Market flip arrow
The arrows trigger to indicate when the market flips to bullish (green) or bearish (red) conditions. note that this arrow is just a market flip confirmation and it it triggered by market trends, it does not come one time and sometimes later after market trigger conditions had been met.
circled in white.
Buy or sell potential {The tiny yelow(sell) and blue(buy) triangle}
By analyzing market extreme conditions, market sentiment, and liquidity, the buy/sell potential alert trigger is able to determine the state of the market, This can and should be used in combination with the market flip line (MFL) [the yellow line from , market flip trigger (MFT) (purple line), and market support/resistance line (MSR)(blue line) .
Market flip Line (Blue line) (MFL): the MFL is useful to also understand the market phase; a candle close above the MFL is bullish, while a candle close Below, the MFL is bearish. You are, however, expected to experience market retests and rejections coupled with support and resistance to follow through with the predicted direction. Patience is a valuable virtue in trading.
Extended sell or buy hunt (Red and Green Triangle)
this is real-time triangles indicator just like every other indicator on theis chart that indicates the market direction labeled with buy and sell. Note that the market-extended extreme can occur multiple times in the same direction. Hence, we'll advise having multiple trade entries.
The flip support line
Market Flip Trigger Line (MFTL) (Magenta): When the market crosses and closes below or above the Market Flip Trigger Line, you should wait for a confirmation. a confirmation is usually a retest or rejection of the line. A candle close and reject indicates the market as flip direction and it is going for a correction or major reversal. it is applicable on all timeframe.
As mentioned earlier, if you understand market structure and sentiment, using the uFVG, iFVG, upLQTY, downLQTY and BOS will be easy. however, this is how it works, you may need tohave and expanded readbout market structure for additional knowledge.
upLQTY (Bullish liquidity inducement)
The indicator appear at the close and confirmation on the 3rd candle and it is extended to only appear on 200 bars applicable on all timeframes.
This is a bullish sentiment and liquidty inducement order block that occurs, leading to the break of trend structure and change of character. Meaning the market sentiment as change which is backed up by liquidity in that region, which mostly gets filled, especially on lower timeframes before the price action continues. If price revese breaks and hold above this region, it invalidates the order block. This will always appear when there is a confirmed change of character CHoCH to the bullish side.
downLQTY (Bearish liquidity inducement) The indicator appear at the close and confirmation on the 3rd candle and it is extended to only appear on 200 bars applicable on all timeframes. It is and inverse of the upLQTY.
like order block, these are supply and demand zones that has the potential to change the direction of a trade. This is a bearish order block that occurs, leading to the break of structure and change of character. Meaning there is bearish liquidity yet to be accounted for in the region, which mostly gets filled, especially on lower timeframes before the price action continues. If broken, it invalidates the order block. This will always appear when there is a confirmed change of character from CHoCH to the bearish side.
Fair Value Gap
From general knowledge, FVG also know as Fair value gaps are inbalnace created by a 3 candlestick pattern where the top of the bottom candles doesn't cross the bottom of the top candle. like order block, these are supply and demand zones that has the potential to change the direction of a trade. This mostly indicate the presense of big plays in the market. for STIC indicator, FVG are labeled as listed below;
UFVG, also FVGup, {Colour green box} = bullish imbalance fair value gap
IFVG, aka FVGdown, {Red box} = bearish imbalance fair value gap
OIFVG, {Yellow box, no label} = other imbalances fair value gab
You should not that FG has upper, lower and middle band, any of the this area can be induced and filled by price.
Alert Conditions!
Buy alert conditions
- Any bullish buy alert
- Bullish hunt
- Re-entry Buy
- Sharp Market Sell rejection
- Buy potential
- upLQTY
Long position Exit conditions
- ExtremeB
- Profit
- Sell hunt
The Entry, exit and trail profit alert trigger should be used as position exit conditions either for a Long (Buy) or Short (Sell) situation and should be set as OPB (Once Per Bar). Using it as entry for exit or vice versa as shown not to be very profitable. hence the need to combine with other order entry alerts like the Any bullish or Bearish alerts
Sell alert conditions ( NOTE: All Sell alert are not yet included in this current version as this is targeted towards bullrun.)
- Sell potential
- Sell triangle (Sell hunt)
- downLQTY
and any trail profit alert, this alert put into consideration all the conditions required to trail profit.
Risk management advice
Patience and a good risk management strategy are required to be profitable trader using this tool. You need to ensure not to overleverage, and you should have multiple entries in case the buy coditions/alert shows again below the previous buy alert before a sell condition/alert occurs.
