Dynamic Gap Probability ToolDynamic Gap Probability Tool measures the percentage gap between price and a chosen moving average, then analyzes your chart history to estimate the likelihood of the next candle moving up or down. It dynamically adjusts its sample size to ensure statistical robustness while focusing on the exact deviation level.
Originality and Value:
• Combines gap-based analysis with dynamic sample aggregation to balance precision and reliability.
• Automatically extends the sample when exact matches are scarce, avoiding misleading signals on rare extreme moves.
• Provides real “next-candle” probabilities based on historical occurrences rather than fixed thresholds or untested heuristics.
• Adds value by giving traders an evidence-based edge: you see how similar past deviations actually played out.
How It Works:
1. Calculate gap = (close – moving average) / moving average * 100.
2. Round the absolute gap to nearest percent (X%).
3. Count historical bars where gap ≥ X% above or ≤ –X% below.
4. If exact X% count is below the minimum occurrences threshold, include gaps at X+1%, X+2%, etc., until threshold is reached.
5. Compute “next-candle” green vs. red probabilities from the aggregated sample.
6. Display current gap, sample size, green probability, and red probability in a table.
Inputs:
• Moving Average Type (SMA, EMA, WMA, VWMA, HMA, SMMA, TMA)
• Moving Average Period (default 200)
• Minimum Occurrences Threshold (default 50)
• Table position and styling options
Examples:
• If price is 3% above the 200-period SMA and 120 occurrences ≥3% are found, with 84 green next candles (70%) and 36 red (30%), the script displays “3% | 120 | 70% green | 30% red.”
• If price is 8% below the SMA but only 20 exact matches exist, the script will include 9% and 10% gaps until it reaches 50 samples, then calculate probabilities from that broader set.
Why It’s Useful:
• Mean-reversion traders see green-probability signals at extreme overbought or oversold levels.
• Trend-followers identify continuation likelihood when red probability is high.
• Risk managers gauge reliability by inspecting sample size before acting on any signal.
Limitations:
• Historical probabilities do not guarantee future performance.
• Results depend on timeframe and symbol, backtest with your data before trading.
• Use realistic slippage and commission when overlaying on strategy scripts.
חפש סקריפטים עבור "gaps"

Timeframe Resistance Evaluation And Detection - CoffeeKillerTREAD - Timeframe Resistance Evaluation And Detection Guide
🔔 Important Technical Limitation 🔔
**This indicator does NOT fetch true higher timeframe data.** Instead, it simulates higher timeframe levels by aggregating data from your current chart timeframe. This means:
- Results will vary depending on what chart timeframe you're viewing
- Levels may not match actual higher timeframe candle highs/lows
- You might miss important wicks or gaps that occurred between chart timeframe bars
- **Always verify levels against actual higher timeframe charts before trading**
Welcome traders! This guide will walk you through the TREAD (Timeframe Resistance Evaluation And Detection) indicator, a multi-timeframe analysis tool developed by CoffeeKiller that identifies support and resistance confluence across different time periods.(I am 50+ year old trader and always thought I was bad a teaching and explaining so you get a AI guide. I personally use this on the 5 minute chart with the default settings, but to each there own and if you can improve the trend detection methods please DM me. I would like to see the code. Thanks)
Core Components
1. Dual Timeframe Level Tracking
- Short Timeframe Levels: Tracks opening price extremes within shorter periods
- Long Timeframe Levels: Tracks actual high/low extremes within longer periods
- Dynamic Reset Mechanism: Levels reset at the start of each new timeframe period
- Momentum Detection: Identifies when levels change mid-period, indicating active price movement
2. Visual Zone System
- High Zones: Areas between long timeframe highs and short timeframe highs
- Low Zones: Areas between long timeframe lows and short timeframe lows
- Fill Coloring: Dynamic colors based on whether levels are static or actively changing
- Momentum Highlighting: Special colors when levels break during active periods
3. Customizable Display Options
- Multiple Plot Styles: Line, circles, or cross markers
- Flexible Timeframe Selection: Wide range of short and long timeframe combinations
- Color Customization: Separate colors for each level type and momentum state
- Toggle Controls: Show/hide different elements based on trading preference
Main Features
Timeframe Settings
- Short Timeframe Options: 15m, 30m, 1h, 2h, 4h
- Long Timeframe Options: 1h, 2h, 4h, 8h, 12h, 1D, 1W
- Recommended Combinations:
- Scalping: 15m/1h or 30m/2h
- Day Trading: 30m/4h or 1h/4h
- Swing Trading: 4h/1D or 1D/1W
Display Configuration
- Level Visibility: Toggle short/long timeframe levels independently
- Fill Zone Control: Enable/disable colored zones between levels
- Momentum Fills: Special highlighting for actively changing levels
- Line Customization: Width, style, and color options for all elements
Color System
- Short TF High: Default red for resistance levels
- Short TF Low: Default green for support levels
- Long TF High: Transparent red for broader resistance context
- Long TF Low: Transparent green for broader support context
- Momentum Colors: Brighter colors when levels are actively changing
Technical Implementation Details
How Level Tracking Works
The indicator uses a custom tracking function that:
1. Detects Timeframe Periods: Uses `time()` function to identify when new periods begin
2. Tracks Extremes: Monitors highest/lowest values within each period
3. Resets on New Periods: Clears tracking when timeframe periods change
4. Updates Mid-Period: Continues tracking if new extremes are reached
The Timeframe Limitation Explained
`pinescript
// What the indicator does:
short_tf_start = ta.change(time(short_timeframe)) != 0 // Detects 30m period start
= track_highest(open, short_tf_start) // BUT uses chart TF opens!
// What true multi-timeframe would be:
// short_tf_high = request.security(syminfo.tickerid, short_timeframe, high)
`
This means:
- On a 5m chart with 30m/4h settings: Tracks 5m bar opens during 30m and 4h windows
- On a 1m chart with same settings: Tracks 1m bar opens during 30m and 4h windows
- Results will be different between chart timeframes
- May miss important price action that occurred between your chart's bars
Visual Elements
1. Level Lines
- Short TF High: Upper resistance line from shorter timeframe analysis
- Short TF Low: Lower support line from shorter timeframe analysis
- Long TF High: Broader resistance context from longer timeframe
- Long TF Low: Broader support context from longer timeframe
2. Zone Fills
- High Zone: Area between long TF high and short TF high (potential resistance cluster)
- Low Zone: Area between long TF low and short TF low (potential support cluster)
- Regular Fill: Standard transparency when levels are static
- Momentum Fill: Enhanced visibility when levels are actively changing
3. Dynamic Coloring
- Static Periods: Normal colors when levels haven't changed recently
- Active Periods: Momentum colors when levels are being tested/broken
- Confluence Zones: Different intensities based on timeframe alignment
Trading Applications
1. Support/Resistance Trading
- Entry Points: Trade bounces from zone boundaries
- Confluence Areas: Focus on areas where short and long TF levels cluster
- Zone Breaks: Enter on confirmed breaks through entire zones
- Multiple Timeframe Confirmation: Stronger signals when both timeframes align
2. Range Trading
- Zone Boundaries: Use fill zones as range extremes
- Mean Reversion: Trade back toward opposite zone when price reaches extremes
- Breakout Preparation: Watch for momentum color changes indicating potential breakouts
- Risk Management: Place stops outside the opposite zone
3. Trend Following
- Direction Bias: Trade in direction of zone breaks
- Pullback Entries: Enter on pullbacks to broken zones (now support/resistance)
- Momentum Confirmation: Use momentum coloring to confirm trend strength
- Multiple Timeframe Alignment: Strongest trends when both timeframes agree
4. Scalping Applications
- Quick Bounces: Trade rapid moves between zone boundaries
- Momentum Signals: Enter when momentum colors appear
- Short-Term Targets: Use opposite zone as profit target
- Tight Stops: Place stops just outside current zone
Optimization Guide
1. Timeframe Selection
For Different Trading Styles:
- Scalping: 15m/1h - Quick levels, frequent updates
- Day Trading: 30m/4h - Balanced view, good for intraday moves
- Swing Trading: 4h/1D - Longer-term perspective, fewer false signals
- Position Trading: 1D/1W - Major structural levels
2. Chart Timeframe Considerations
**Important**: Your chart timeframe affects results
- Lower Chart TF: More granular level tracking, but may be noisy
- Higher Chart TF: Smoother levels, but may miss important price action
- Recommended: Use chart timeframe 2-4x smaller than short indicator timeframe
3. Display Settings
- Busy Charts: Disable fills, show only key levels
- Clean Analysis: Enable all fills and momentum coloring
- Multi-Monitor Setup: Use different color schemes for easy identification
- Mobile Trading: Increase line width for visibility
Best Practices
1. Level Verification
- Always Cross-Check: Verify levels against actual higher timeframe charts
- Multiple Timeframes: Check 2-3 different chart timeframes for consistency
- Price Action Confirmation: Wait for candlestick confirmation at levels
- Volume Analysis: Combine with volume for stronger confirmation
2. Risk Management
- Stop Placement: Use zones rather than exact prices for stops
- Position Sizing: Reduce size when zones are narrow (higher risk)
- Multiple Targets: Scale out at different zone boundaries
- False Break Protection: Allow for minor zone penetrations
3. Signal Quality Assessment
- Momentum Colors: Higher probability when momentum coloring appears
- Zone Width: Wider zones often provide stronger support/resistance
- Historical Testing: Backtest on your preferred timeframe combinations
- Market Conditions: Adjust sensitivity based on volatility
Advanced Features
1. Momentum Detection System
The indicator tracks when levels change mid-period:
`pinescript
short_high_changed = short_high != short_high and not short_tf_start
`
This identifies:
- Active level testing
- Potential breakout situations
- Increased market volatility
- Trend acceleration points
2. Dynamic Color System
Complex conditional logic determines fill colors:
- Static Zones: Regular transparency for stable levels
- Active Zones: Enhanced colors for changing levels
- Mixed States: Different combinations based on user preferences
- Custom Overrides: User can prioritize certain color schemes
3. Zone Interaction Analysis
- Convergence: When short and long TF levels approach each other
- Divergence: When timeframes show conflicting levels
- Alignment: When both timeframes agree on direction
- Transition: When one timeframe changes while other remains static
Common Issues and Solutions
1. Inconsistent Levels
Problem: Levels look different on various chart timeframes
Solution: Always verify against actual higher timeframe charts
2. Missing Price Action
Problem: Important wicks or gaps not reflected in levels
Solution: Use chart timeframe closer to indicator's short timeframe setting
3. Too Many Signals
Problem: Excessive level changes and momentum alerts
Solution: Increase timeframe settings or reduce chart timeframe granularity
4. Lagging Signals
Problem: Levels seem to update too slowly
Solution: Decrease chart timeframe or use more sensitive timeframe combinations
Recommended Setups
Conservative Approach
- Timeframes: 4h/1D
- Chart: 1h
- Display: Show fills only, no momentum coloring
- Use: Swing trading, position management
Aggressive Approach
- Timeframes: 15m/1h
- Chart: 5m
- Display: All features enabled, momentum highlighting
- Use: Scalping, quick reversal trades
Balanced Approach
- Timeframes: 30m/4h
- Chart: 15m
- Display: Selective fills, momentum on key levels
- Use: Day trading, multi-session analysis
Final Notes
**Remember**: This indicator provides a synthetic view of multi-timeframe levels, not true higher timeframe data. While useful for identifying potential confluence areas, always verify important levels by checking actual higher timeframe charts.
**Best Results When**:
- Combined with actual multi-timeframe analysis
- Used for confluence confirmation rather than primary signals
- Applied with proper risk management
- Verified against price action and volume
**DISCLAIMER**: This indicator and its signals are intended solely for educational and informational purposes. The timeframe limitation means results may not reflect true higher timeframe levels. Always conduct your own analysis and verify levels independently before making trading decisions. Trading involves significant risk of loss.

Path of Least ResistancePath of Least Resistance (PLR)
Concept Overview
The Path of Least Resistance indicator identifies key zones on your chart that act like "muddy" or "sticky" areas where price tends to get bogged down, creating choppy and unpredictable price action. Between these zones lie the "empty spaces" - clear paths where price can move freely with momentum and direction.
The Analogy: Muddy Fields vs Open Roads
Think of your chart like a landscape:
🟫 ZONES (Muddy/Sticky Areas)
Fair Value Gaps (FVGs) from higher timeframes
Pivot wick zones from higher timeframe pivots
Areas where price gets "stuck" and churns
Like walking through thick mud - slow, choppy, unpredictable movement
Price action becomes erratic and difficult to trade
🟢 EMPTY SPACES (Open Roads)
The clear areas between zones
Where price can move freely with momentum
Like driving on an open highway - smooth, directional movement
The "Path of Least Resistance" for price movement
Trading Philosophy
AVOID Trading Within Zones:
Price action is typically choppy and unpredictable
Higher probability of false signals and whipsaws
Like trying to drive through mud - you'll get stuck
TRADE Through the Empty Spaces:
Look for moves that travel between zones
Price tends to move with momentum and direction
Higher probability setups with cleaner price action
Like taking the highway instead of back roads
Zone Types Detected
Fair Value Gaps (FVGs)
Imbalances from higher timeframe candles
Areas where price "owes" a return visit
Often act as magnets, creating choppy price action
Pivot Wick Zones
Upper and lower wicks from higher timeframe pivots
Rejection areas where price previously struggled
Often create resistance/support that leads to choppy movement
Color Coding System
The zones dynamically change color based on current price position:
🔴 RED ZONES : Price is below the zone (bearish context)
🟢 GREEN ZONES : Price is above the zone (bullish context)
🔘 GRAY ZONES : Price is within the zone (neutral/choppy area)
The "Mum Trades" Strategy
The best trades - what we call "Mum trades" (trades so obvious even your mum could spot them) - happen in the empty spaces between zones:
✅ High Probability Characteristics:
Clear directional movement between zones
Less noise and false signals
Higher momentum and follow-through
Cleaner technical patterns
❌ Avoid These Areas:
Trading within the muddy zones
Expecting clean moves through sticky areas
Fighting against the natural flow of price
Key Features
Auto Timeframe Detection : Automatically selects appropriate higher timeframe
Dynamic Zone Management : Overlapping zones are automatically cleaned up
Real-time Alerts : Get notified when price enters/exits zones
Visual Clarity : Clean zone display with extending boundaries
How to Use
Identify the Zones : Let the indicator mark the muddy areas
Find the Paths : Look for clear spaces between zones
Plan Your Trades : Target moves that travel through empty space
Avoid the Mud : Stay away from trading within the zones
Follow the Flow : Trade with the path of least resistance
Remember
Price, like water, always seeks the path of least resistance. By identifying where that path is clear (empty spaces) versus where it's obstructed (zones), you can align your trading with the natural flow of the market rather than fighting against it.
The goal is simple: Trade the highways, avoid the mud.

Weekend Background Highlighter (UTC+12)## Weekend Background Highlighter (UTC+12)
### Description
This indicator automatically highlights weekend periods on your TradingView charts specifically for the UTC+12 timezone (New Zealand Standard Time). Perfect for traders who need to visualize market closures and weekend gaps in the New Zealand/Pacific time zone, regardless of their exchange's native timezone or chart settings.
### Key Features
- **Fixed UTC+12 Timezone**: Hardcoded to always show weekends according to UTC+12, independent of exchange or chart timezone settings
- **Customizable Appearance**: Adjust background color and opacity to match your chart theme
- **Optional Weekend Labels**: Mark the beginning of each weekend period with customizable labels
- **Debug Mode**: View real-time timezone calculations to verify correct weekend detection
- **Lightweight**: Minimal performance impact with efficient calculations
### Use Cases
- **Forex Traders**: Identify weekend gaps and Monday openings in NZD pairs
- **Cryptocurrency Traders**: Visualize weekend trading patterns in the Pacific timezone
- **Multi-Market Traders**: Maintain consistent weekend awareness across different exchanges
- **Risk Management**: Clearly see when markets are closed for position management
### Settings
- **Weekend Background Color**: Choose any color for the weekend highlight
- **Opacity**: Control transparency (0-100%) to maintain chart visibility
- **Show Weekend Labels**: Toggle labels marking weekend start
- **Debug Info**: Display timezone calculations for verification
### How It Works
The indicator calculates the current UTC time and adds 12 hours to determine the UTC+12 time. It then checks if the resulting day falls on Saturday or Sunday, highlighting these periods on your chart. This ensures weekends are always displayed according to New Zealand time, regardless of your broker's timezone or your local settings.
### Notes
- Weekends begin at 00:00 Saturday UTC+12 (12:00 Friday UTC)
- Weekends end at 00:00 Monday UTC+12 (12:00 Sunday UTC)
- Works on all timeframes and markets
- Compatible with Pine Script v6
### Tags
weekend, background, timezone, UTC+12, New Zealand, highlight, trading sessions, forex, crypto, time zones, market hours, pacific time
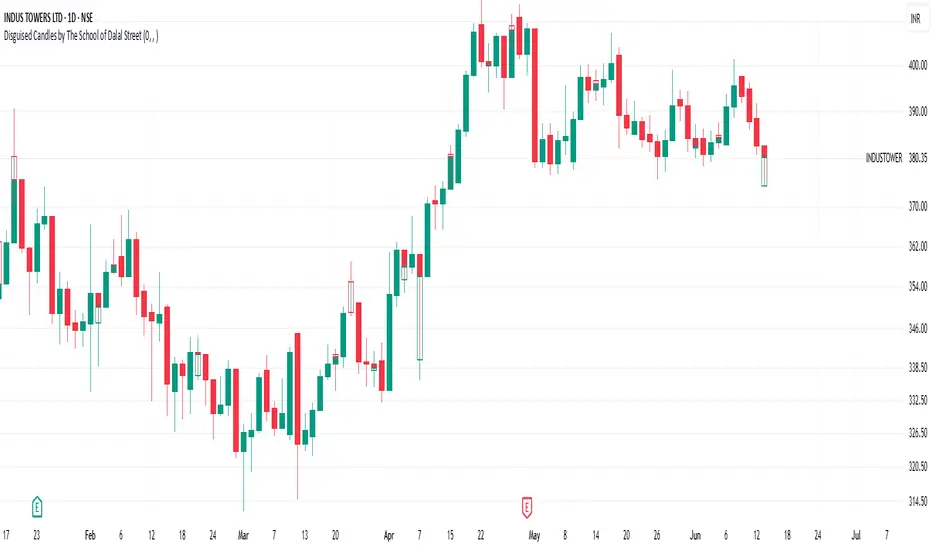
Disguised Candles by The School of Dalal StreetDisguised Candles corrects one of the subtle visual distortions present in normal candlestick charts — the mismatch between the close of one candle and the open of the next.
On many instruments (especially at day/session breaks), the next candle’s open often jumps due to price gaps or data feed behavior. This can make reading the flow of price action harder than necessary.
Disguised Candles fixes this by plotting synthetic candles where the open of each candle is forced to match the close of the previous one — creating a visually continuous flow of price.
Real candles are made fully transparent, so only the "corrected" candles are visible.
This allows traders to:
Visualize price flow as a smooth path
Better spot true directional shifts and trends
Avoid distractions caused by technical gaps that are not meaningful to their strategy
🚀 Pure visual clarity. No noise from false opens.
How it works:
The open of each synthetic candle = close of previous real candle
High, Low, Close remain unchanged
Colors are based on Close vs Corrected Open
Real chart candles are hidden under a transparent overlay
Use this as a clean canvas for trend analysis or as a foundation for building new visual systems.
FVG (Nephew sam remake)Hello i am making my own FVG script inspired by Nephew Sam as his fvg code is not open source. My goal is to replicate his Script and then add in alerts and more functions. Thus, i spent few days trying to code. There is bugs such as lower time frame not showing higher time frame FVG.
This script automatically detects and visualizes Fair Value Gaps (FVGs) — imbalances between demand and supply — across multiple timeframes (15-minute, 1-hour, and 4-hour).
15m chart shows:
15m FVGs (green/red boxes)
1H FVGs (lime/maroon)
4H FVGs (faded green/red with borders) (Bugged For now i only see 1H appearing)
1H chart shows:
1H FVGs
4H FVGs
4H chart shows:
4H FVGs only
There is the function to auto close FVG when a future candle fully disrespected it.
You're welcome to:
🔧 Customize the appearance: adjust box colors, transparency, border style
🧪 Add alerts: e.g., when price enters or fills a gap
📅 Expand to Daily/Weekly: just copy the logic and plug in "D" or "W" as new layers
📈 Build confluence logic: combine this with order blocks, liquidity zones, or ICT concepts
🧠 Experiment with entry signals: e.g., candle confirmation on return to FVG
🚀 Improve performance: if you find a lighter way to track gaps, feel free to optimize!

FVG Candle HighlighterThis indicator highlights only the true Fair Value Gap (FVG) creator candle — the middle candle in a 3-bar FVG formation — with zero clutter.
🔹 Bullish FVG: Candle is colored if price gaps above the high two bars back
🔹 Bearish FVG: Candle is colored if price gaps below the low two bars back
✨ No boxes. No zones. Just pure, visual price-action accuracy.
🔧 Powered by Pine Script v6
🧠 Based on institutional-style FVG logic
🎯 Ideal for Smart Money / ICT / Order Block strategies

UT Bot + Cooldown + Visual FVGSynopsis – UT Bot + Cooldown + Visual FVG
This TradingView script combines:
✅ UT Bot Reversal Signals
Based on ATR and volatility logic
BUY when trend flips from bearish to bullish
SELL when trend flips from bullish to bearish
✅ Cooldown Filter
Limits signals to 1 per X bars (default 30)
Prevents overtrading during choppy price action
✅ Optional FVG Markers (Fair Value Gaps)
Visually shows bullish or bearish imbalances (3-bar gaps)
Does not affect signal generation — only for confluence
🔍 Ideal for traders who want clean, time-filtered signals with visual price-action context. Suitable for futures, crypto, or forex on intraday charts.

Balanced Price Range | Flux Charts💎 GENERAL OVERVIEW
Introducing our new Balanced Price Range (BPR) indicator! A Balanced Price Range is a trading concept used by price action traders. It is detected by finding overlapping area between two contrary Fair Value Gaps (FVGs). These areas can be used as entry points during market pullbacks. For more information about the process, please check the "HOW DOES IT WORK ?" section.
Balanced Price Range Features :
Balanced Price Range Detection : Identifies areas where bullish and bearish FVGs overlap, suggesting a zone of price equilibrium.
Customizable FVG & BPR Detection : You can fine-tune FVG detection and sensitivity for BPR detection to your liking.
Retest Labels : Bullish & Bearish retest labels will be rendered for BPRs.
Alerts : You can set alerts for Bullish & Bearish BPR detection and their retests.
🚩 UNIQUENESS
This indicator doesn't just detect standard FVGs but specifically looks for areas where bullish and bearish IFVGs (Invalidated Fair Value Gaps) overlap, defining a Balanced Price Range. It also actively manages and updates identified BPR zones, removing them when they are invalidated or remain untouched for a specified period. It highlights and alerts users to retests of established BPR zones, signaling potential trading opportunities. Users can tailor the appearance of the BPR zones and retest markers, as well as configure specific alerts for new BPR formations and retests.
📌 HOW DOES IT WORK ?
A Fair Value Gap generally occur when there is an imbalance in the market. They can be detected by specific formations within the chart. The indicator first detects bullish & bearish FVG zones according to their formations on chart. Then, they are dynamically tracked and flagged as invalidated if the price crosses them, turning them into IFVGs. When a FVG & IFVG of the same type overlaps, the indicator combines them into a single BPR of corresponding type. The detected BPR is updated as new data comes in, and renders retests labels as they occur. A bullish BPR can be used to find long trade entry opportunities, while a bearish BPR can be used to find short trade entry opportunities. Retests can also indicate potential movements in the corresponding direction of the BPR. Users can set-up alerts for BPR detection & BPR retests and will get notified as they occur.
⚙️ SETTINGS
Show Historic Zones: If enabled, invalidated or expired BPR zones will remain visible on the chart.
Balanced Price Range:
FVG Detection Method: Determines the criteria for the bar types forming the initial FVG.
Same: All three bars forming the FVG must be of the same type (all bullish or all bearish).
Mixed: The bar types must vary (a mix of bullish and bearish bars).
All: Bar types can vary or be the same.
FVG Invalidation Method: Determines which part of the candle (wick or close) invalidates the initial FVG.
BPR Invalidation Method: Determines which part of the candle (wick or close) invalidates the Balanced Price Range.
Sensitivity: Adjusts the sensitivity of FVG detection. Higher values may identify fewer, larger BPRs, while lower values may detect more, smaller BPRs.
Labels: Toggles the display of text labels on the identified zones.
Retests: Enables or disables the detection and visualization of BPR retests.

ICT iFVG Detector and Alert [by ote618]Description
This script detects ICT - fair value gaps (FVG) formed by price gaps between Candle 1 and Candle 3, then monitors the next 5 candles for an inverse fair value gap (iFVG).
What It Detects
Bullish FVG: When Candle 1 high is below Candle 3 low (BISI)
Bearish FVG: When Candle 1 low is above Candle 3 high (SIBI)
Once an FVG is detected, the script checks the next 5 candles:
A Bullish FVG becomes a Bearish IFVG if price closes below Candle 1 high
A Bearish FVG becomes a Bullish IFVG if price closes above Candle 1 low
Only the first bar that validates the FVG triggers the transition to an IFVG.
Visual Output
A shaded rectangle is plotted to mark the original FVG zone (from Candle 1 to Candle 3)
Color-coded:
Red for Bearish IFVG (validated Bullish IG)
Green for Bullish IFVG (validated Bearish IG)
The rectangle extends from Candle 1 to the validating bar
Alerts
You can receive alerts when an FVG becomes an IFVG:
Configurable to fire only on selected timeframes (1m, 5m, 15m, 60m)
Alerts include the direction and the chart timeframe
Settings
Enable Alerts For Timeframe: Choose which timeframe(s) trigger alerts
This tool helps traders identify inverse FVGs (iFVG), a useful ICT concept.

London ORB + Session High/Low + FVGLondon ORB + Session High/Low + FVG
📘 Script Description: London ORB + Session High/Low + Fair Value Gap
This script is designed to assist intraday traders during the London session open by combining:
🕒 1. Opening Range Breakout (ORB)
Captures the high and low of the first 15-minute candle after the London open (08:00–08:15 GMT).
Draws lines and labels for the ORB High and Low levels.
Detects breakouts above or below the ORB and plots a triangle signal at the breakout bar.
🌐 2. Asian & US Session Levels
Automatically marks the highs and lows of the Asian (00:00–06:00 GMT) and US (13:30–20:00 GMT) sessions.
Useful for identifying prior session liquidity zones, key support/resistance levels, and potential reaction areas.
📉 3. Fair Value Gaps (FVG)
Highlights imbalances in price action between non-overlapping candles (also known as FVGs or inefficiencies).
Draws a shaded box between candles where gaps exist:
Green for bullish FVGs
Red for bearish FVGs
🔔 4. Alert Support
Optional alerts are built in for:
Long breakout (price breaks above ORB)
Short breakout (price breaks below ORB)
🎯 Use Case
Perfect for:
Day traders looking to capitalize on early volatility at the London open
Traders using liquidity-based strategies, retests, or gap-fills
Visualizing and aligning with prior session highs/lows for structure and context

cd_full_poi_CxOverview
This indicator tracks the price in 16 different time frames (optional) in order to answer the question of where the current price has reacted or will react.
It appears on the chart and in the report table when the price approaches or touches the fvg or mitigations (order block / supply-demand), the rules of which will be explained below.
In summary, it follows the fvg and mitigations in the higher timeframe than the lower timeframe.
Many traders see fvg or mitigates as an point of interest and see the high, low swept in those zones as a trading opportunity. Key levels, Session high/lows and Equal high and lows also point of interest.
If we summarise the description of the point of interest ;
1- Fair value gaps (FVG) (16 time frames)
2- Mitigation zones (16 time frames)
3- Previous week, day, H4, H1 high and low levels
4- Sessions zones (Asia, London and New York)
5- Equal high and low levels are in indicator display.
Details:
1- Fair Value Gaps : It is simply described as a price gap and consists of a series of 3 candles. The reaction of the price to the gap between the 1st and 3rd candle wicks is observed.
The indicator offers 3 options for marking. These are :
1-1- ‘Colours are unimportant’: candle colours are not considered for marking. Fvg formation is sufficient.(Classical)
1-2- ‘First candle opposite colour’ : when a price gap occurs, the first candle of a series of 3 candles must be opposite.
For bullish fvg : bearish - bullish - free
For Bearish fvg : bullish - bearish - free
1-3- ‘All same colour’ : all candles in a series of 3 candles must be the same direction.
For bullish fvg: bullish - bullish - bullish
For bearish fvg : bearish - bearish – bearish
Examples:
2- Mitigation zones: Opposite candles with a fvg in front of them or candles higher/lower than the previous and next candle and with the same colour as the fvg series are marked.
Examples :
3- Previous week, day, H4, H1 high and low levels
4- Sessions regions (Asia, London and New York)
5- Equal high and low levels:
Annotation: Many traders want to see a liquidity grab on the poi, then try to enter the trade with the appropriate method.
Among the indicators, there is also the indication of grabs/swepts that occur at swing points. It is also indicated when the area previously marked as equal high/low is violated (grab).
At the end, sample setups will be shown to give an idea about the use of the indicator.
Settings:
- The options to be displayed from the menu are selected by ticking.
- 1m, 2m, 3m, 5m, 5m, 10m, 15m, 30m, h1, h4, h4, h6, h8, h12, daily, weekly, monthly and quarterly, 16 time zones in total can be displayed.
- The ‘Collapse when the price touches mitigate’ tab controls whether to collapse the box as the price moves into the inner region of the mitigate. If not selected, the size of the mitigate does not change.
- ‘Approach limit =(ATR / n)’ tab controls how close the price is to the fvg or mitigate. Instant ATR(10) value is calculated by dividing by the entered ‘n’ value.
- All boxes and lines are automatically removed from the screen when the beyond is closed.
- Colour selections, table, text features are controlled from the menu.
- Sessions hours are set as standard hours, the user can select special time zones. Timezone is set to GMT-4.
- On the candle when the price touches fvg or mitigate, the timeframe information of the POI is shown in the report table together with the graphical representation.
The benefits and differences :
1- We can evaluate the factors we use for setup together.
2- We are aware of what awaits us in the high time frame in the following candles.
3- It offers the user the opportunity to be selective with different candle selection options in fvg selection.
4- Mitige areas are actually unmitige areas because they have a price gap in front of them. The market likes to retest these areas.
5- Equal high/low zones are the levels that the price creates to accumulate liquidity or fails to go beyond (especially during high volume hours). Failure or crossing of the level may give a reversal or continuation prediction.
Sample setup 1:
Sample setup 2:
Sample setup 3:
Cheerful trades…
Enjoy…

FVG, Swing, Target, D/W/M High Low Detector Basic by Trader Riaz"FVG, Swing, Target, D/W/M High Low Detector Basic by Trader Riaz " is a powerful TradingView indicator designed to enhance your trading strategy by identifying key market structures and levels. This all-in-one tool detects Fair Value Gaps (FVGs), Swing Highs/Lows, and previous Day, Previous Week, and Previous Month Highs/Lows, helping traders make informed decisions with ease.
Key Features:
Bullish & Bearish FVG Detection: Highlights Fair Value Gaps with customizable colors, labels, and extension options.
Swing Highs & Lows: Automatically detects and marks Swing Highs and Lows with adjustable display settings and extensions.
Next Target Levels: Identifies potential price targets based on market direction (rising or falling).
Daily, Weekly, and Monthly High/Low Levels: Displays previous day, week, and month highs/lows with customizable colors.
Customizable Settings: Fully adjustable inputs for colors, number of levels to display, and extension periods.
Clean Visuals: Intuitive and non-intrusive design with dashed lines, labels, and tooltips for better chart readability.
This indicator is ideal for traders looking to identify key price levels, improve market structure analysis, and enhance their trading strategies.
Happy Trading,
Trader Riaz

Pipsttocra Technical Patterns: EV HV FVG & OBPipstocrat Technical Patterns , identifies and visualizes key technical analysis patterns and structures on a TradingView chart. Here's a simple breakdown of what it does:
Fair Value Gaps (FVG):
Detects and highlights bullish and bearish Fair Value Gaps as colored boxes.
Adds centerline markers to indicate potential price levels.
Order Blocks (OB):
Identifies bullish and bearish order blocks (areas of significant buying or selling).
Displays them as colored rectangles extending to the right of the chart.
Candlestick Patterns:
Detects Engulfing Patterns (bullish and bearish) with volume confirmation.
Highlights Hammer and Inverted Hammer patterns with customizable shapes and colors.
Customization Options:
Allows users to adjust colors, sizes, and styles for all patterns and structures.
Provides options to show/hide specific patterns like FVGs, engulfing candles, hammers, etc.
Alerts:
Generates alerts for detected patterns, such as FVGs, order blocks, engulfing candles, and confluence zones (combination of FVGs and order blocks).
Management Features:
Automatically removes older or "filled" patterns (optional).
Tracks and updates patterns dynamically as new bars form.
Purpose:
This tool helps traders spot high-probability trading opportunities by identifying key market structures (like FVGs and order blocks) and candlestick patterns. It combines multiple technical analysis concepts into one comprehensive indicator for better decision-making.

BBr1 Candle Range Volitility Gap IndicatorModified Candle Range Volatility Gap Indicator
1. Useful to analyze bars body and wicks and volatility of security.
2. Added a Percentage Option - easier to analyze across different securities.
2. Added a Standard Deviation ("1 std dev= 68.2%, 2 std dev=95.4%, 3 std dev=99.7%, etc") based upon user defined lookback period.
3. Added the ability to include Gaps in Analysis. (Gaps are when the prior closing cost does not equal opening price)
4. Possible Uses setting up stop losses, trailing entries/exits (inside range or outside range).
5. Use it with other indicators in determining if to make an entry or close entry.
Reposted Original Description by © ka66 Kamal Advani
Visually shows the Body Range (open to close) and Candle Range (high to low).
Semi-transparent overlapping area is the full Candle Range, and fully-opaque smaller area is the Body Range. For aesthetics and visual consistency, Candle Range follows the direction of the Body Range, even though technically it's always positive (high - low).
The different plots for each range type also means the UI will allow deselecting one or the other as needed. For example, some strategies may care only about the Body Range, rather than the entire Candle Range, so the latter can be hidden to reduce noise.
Threshold horizontal lines are plotted, so the trader can modify these high and low levels as needed through the user interface. These need to be configured to match the instrument's price range levels for the timeframe. The defaults are pretty arbitrary for +/- 0.0080 (80 pips in a 4-decimal place forex pair). Where a range reaches or exceeds a threshold, it's visually marked as well with a shape at the Body or Candle peak, to assist with quicker visual potential setup scanning, for example, to anticipate a following reversal or continuation.

Panic Drop Stock Market Bull/Bear Market Panic Drop Bull/Bear
What It Does:
This indicator identifies bull and bear markets for the S&P 500 (or any stock/index) using the 50-period and 150-period Simple Moving Averages (SMAs). A green background signals a confirmed bull market when the 50 SMA is above the 150 SMA and the 150 SMA slope is flat or upward. A red background signals a confirmed bear market when the 50 SMA is below the 150 SMA and the 150 SMA slope is downward. The background color persists until a new confirmed state is detected, ensuring no gaps—perfect for spotting long-term market trends whether you’re a beginner, trend trader, or long-term investor.
Key Features:
Plots 50 SMA (default: blue line) and 150 SMA (default: orange line).
Background highlights: green for bull markets, red for bear markets.
Persistent background color—no gaps during unconfirmed periods.
Alerts for confirmed bull and bear market transitions.
Fully adjustable: MA periods, slope lookback, and more.
How to Use It:
Add to your S&P 500 chart (e.g., SPX or SPY) on a daily or weekly timeframe (daily default recommended for long-term trends).
Watch for background color changes:
Green background: Confirmed bull market—consider long positions or holding.
Red background: Confirmed bear market—consider shorting or exiting longs.
Customize via settings:
Adjust MA periods (default: 50 and 150).
Set slope lookback (default: 5 bars) to control slope sensitivity.
Change MA colors if desired.
Set alerts: Right-click on the chart > "Add Alert" > Select "Bull Market Confirmed" or "Bear Market Confirmed."
Trade smart: Use the background to confirm market regimes—e.g., go long during green (bull) phases above key support levels, or protect capital during red (bear) phases.
Why It’s Great:
Beginners: Simple background colors make market trends easy to spot.
Trend Traders: 50/150 SMA crossover with slope confirmation catches major market shifts.
Long-Term Investors: Persistent background ensures you stay in the trend without noise.
Created by Timothy Assi (Panic Drop), eToro’s elite investor. Test it, tweak it, and trade with confidence!

FVG LevelsFVG Levels Indicator Description
The FVG Levels indicator dynamically identifies and displays key price zones that may represent fair value gaps and order block areas, helping traders to visually pinpoint potential support and resistance levels directly on the chart.
Key Features
Order Block Identification:
The indicator detects bullish and bearish order blocks by analyzing specific candle patterns. For bullish zones, it checks if a candle two bars ago was bullish (close greater than open) coupled with a subsequent gap condition. Similarly, bearish zones are identified when bearish candle conditions are met with an appropriate gap.
Dynamic Zone Calculation:
It computes critical levels such as the highest highs, lowest lows, highest lows, and lowest highs over a series of recent bars. These levels define the boundaries of potential buy and sell zones and adjust dynamically as new price data comes in.
Visual Representation:
Buy zones are plotted in lime and sell zones in yellow, with the indicator filling the areas between the high and low lines to create clear, shaded bands. This visual aid helps in quickly recognizing zones of potential price reaction.
Chart Overlay:
Designed to work as an overlay, the indicator integrates directly onto your price chart, allowing for seamless correlation between price action and identified zones.
How It Works
Bullish Zones:
When a bullish candle (with the candle's close above its open) is detected along with a significant gap, the indicator marks the upper and lower boundaries of the bullish order block. It further refines these levels by tracking the lowest low and highest high over recent bars to enhance the zone's definition.
Bearish Zones:
In a similar manner, the indicator calculates bearish order blocks by confirming bearish candle conditions and corresponding gap criteria. It then updates the bearish zone levels and computes the highest high and lowest low to establish clear sell zone boundaries.
Usage
Traders can use the FVG Levels indicator to:
Identify potential entry and exit points by observing where price may reverse or consolidate.
Recognize fair value gaps or imbalances that often act as magnet points for price action.
Enhance risk management by using the dynamically calculated zones to set stop-losses or take-profits.

Gap Detector RSTThis script detects and visualizes price gaps in the market using customizable settings. It identifies bullish and bearish gaps over a specified lookback period and marks them with clearly defined boxes. Users can adjust the minimum gap percentage threshold and customize colors for better visibility.

SMC Liquidity & Order Blocks🔹 1. Moving Averages for Trend Confirmation
Uses Exponential Moving Averages (EMA) to determine trend direction.
9-period EMA (blue) and 15-period EMA (red) are plotted.
🔹 2. Liquidity Zones (Swing Highs & Lows)
Identifies liquidity zones where price is likely to react.
Buy-Side Liquidity: Highest high over 20 periods (Green line).
Sell-Side Liquidity: Lowest low over 20 periods (Red line).
🔹 3. Order Block Detection
Detects bullish and bearish order blocks (key price zones of institutional activity).
Bullish Order Block (OB): Formed when the highest close over 5 bars exceeds the highest high.
Bearish Order Block (OB): Formed when the lowest close over 5 bars is lower than the lowest low.
Plotted using green (up-triangle) for bullish OB and red (down-triangle) for bearish OB.
🔹 4. Fair Value Gaps (FVG)
Detects price inefficiencies (gaps between candles).
FVG Up: When a candle's high is lower than a candle two bars ahead.
FVG Down: When a candle's low is higher than a candle two bars ahead.
Plotted using blue circles (FVG Up) and orange circles (FVG Down).

2:30 [LuciTech]this is a technical analysis tool designed to highlight key price levels and patterns during a specific trading window, based on UK time (Europe/London). It overlays visual elements on the chart, including a 12 PM reference line, Buy Side Liquidity (BSL) and Sell Side Liquidity (SSL) levels, a highlighted 2:30 PM candle, and Engulfing Fair Value Gaps (FVGs). This indicator is intended for traders who focus on intraday price action and liquidity zones.
Features
The 12 PM Line displays a vertical line at 12:00 PM (UK time) to mark the start of the session. It’s customizable, allowing you to enable or disable it and adjust its color.
BSL/SSL Lines track the highest high (BSL) and lowest low (SSL) from 12:00 PM to 2:00 PM (UK time). These lines extend horizontally until 3:30 PM, after which they remain static at their last recorded levels. You can customize them by enabling or disabling visibility, adjusting colors, choosing a line style (solid, dashed, or dotted), and setting the width.
The 2:30 PM Candle highlights the candle at 2:30 PM (UK time) with a distinct color. It’s customizable, with options to enable or disable it and change its color.
Engulfing FVG (Fair Value Gap) identifies bullish and bearish engulfing patterns with a gap from the prior candle’s range. It draws a shaded box over the FVG area, and you can customize it by enabling or disabling it and adjusting the box color.
How It Works
The indicator operates within a session starting at 12:00 PM (UK time). BSL/SSL levels update between 12:00 PM and 2:00 PM, with lines extending until 3:30 PM. After 3:30 PM, these lines freeze.
BSL/SSL lines show the highest price (BSL) and lowest price (SSL) reached during the 12:00 PM to 2:00 PM window. After 3:30 PM, they remain static, marking the final range boundaries.
The 2:30 PM candle emphasizes a key timestamp, often of interest to intraday traders.
Engulfing FVGs detect significant price gaps created by engulfing candles, which may indicate potential reversal or continuation zones.
Settings
12 PM Line Settings let you toggle visibility and set the line color.
BSL/SSL Line Settings allow you to toggle visibility, set BSL and SSL colors, choose a line style (Solid, Dashed, Dotted), and adjust width (1-4).
2:30 Candle Settings let you toggle visibility and set the candle color.
Engulfing FVG Settings allow you to toggle visibility and set the box color.
Interpretation
The 12 PM Line serves as a reference for the session start.
BSL/SSL Lines may act as potential support or resistance zones or highlight liquidity areas. After 3:30 PM, they remain static, showing the session’s final range.
The 2:30 PM Candle can be monitored for price action signals, such as reversals or breakouts.
Engulfing FVGs shaded areas may indicate imbalances in supply and demand, useful for identifying trade opportunities or stop-loss placement.
Notes
The timezone is set to Europe/London (UK time). Ensure your chart’s timezone aligns for accurate results.
This indicator is best used on intraday timeframes, such as 1-minute or 5-minute charts.
It provides visual aids for analysis and does not generate buy or sell signals on its own.

Price Gap IndicatorJump Candle Indicator (Price Gap Only)
📌 Version: Pine Script v6
📌 Purpose: Detects significant price gaps between consecutive candles to identify potential trading opportunities.
📖 Overview
The Jump Candle Indicator highlights moments when the market experiences a sudden price jump, either up or down, due to overnight moves, news releases, or increased volatility.
It works by detecting candles where the opening price differs significantly from the previous closing price by a set threshold.
Unlike traditional momentum indicators, this script focuses purely on price gaps, making it ideal for traders who want to identify potential breakout zones or market inefficiencies.
⚙️ How It Works
User-Defined Threshold – Set a minimum price gap (default: $0.50).
Gap Up Condition – A candle is considered bullish if:
The current open is higher than the previous close by the defined threshold.
The candle closes higher than it opens (bullish candle).
Gap Down Condition – A candle is considered bearish if:
The current open is lower than the previous close by the defined threshold.
The candle closes lower than it opens (bearish candle).
Large Arrow Alerts –
Green Upward Triangle (📈) appears below bullish jump candles.
Red Downward Triangle (📉) appears above bearish jump candles.
🛠️ Customization
Price Gap Threshold ($): Adjust the gap size to detect smaller or larger jumps.
Visual Signals: Large green and red triangles for clear trade signals.
🎯 How to Use
✅ Breakout Traders – Spot potential trend continuations after a gap.
✅ Mean Reversion Traders – Identify overextended price movements that may revert.
✅ News/Event Traders – Track market reactions after earnings, reports, or major news.
🚨 Note: This indicator is best used with additional confirmation signals (volume, support/resistance levels, or trend analysis).

Gap Detection Indicator V.1This indicator is designed to detect gaps between candles on the chart. It detects all gaps that are higher than the specified percentage setting, draws a line passing through only the starting and ending points of the last gap, and paints between these lines.
If any candle closes above the gap starting level, the lines between the lines are colored green; If any candle closes below the gap starting level, the lines between the lines are colored red.
UPDATE1:
In addition, two more gap levels were added. A date range was added to enable control within the specified date range.

Reversal rehersal v1This indicator was designed to identify potential market reversal zones using a combination of RSI thresholds (shooting range/falling range), candlestick patterns, and Fair Value Gaps (FVGs). By combining all these elements into one indicator, it allow for outputting high probability buy/sell signals for use by scalpers on low timeframes like 1-15 mins, for quick but small profits.
Note: that this has been mainly tested on DE40 index on the 1 min timeframe, and need to be adjusted to whichever timeframe and symbol you intend to use. Refer to the backtester feature for checking if this indicator may work for you.
The indicator use RSI ranges from two timeframes to highlight where momentum is building up. During these areas, it will look for certain candlestick patterns (Sweeps as the primary one) and check for existance of fair value gaps to further enhance the hitrate of the signal.
The logic for FVG detection was based on ©pmk07's work with MTF FVG tiny indicator. Several major changes was implemented though and incorporated into this indicator. Among these are:
Automatically adjustments of FVG boxes when mitigated partially and options to extend/cull boxes for performance and clarity.
Backtesting Table (Experimental):
This indicator also features an optional simplified table to review historical theoretical performance of signals, including win rate, profit/loss, and trade statistics. This does not take commision or slippage into consideration.
Usage Notes:
Setup:
1. Add the indicator to your chart.
2. Decide if you want to use Long or Short (or both).
3. If you're scalping on ie. 1 min time frame, make sure to set FVG's to higher timeframes (ie. 5, 15, 60).
4. Enable the 'Show backtest results' and adjust the 'Signals' og 'Take profit' and 'Stop loss' values until you are satisfied with the results.
Use:
1. Setup an alert based on either of the 'BullishShooting range' or 'BearishFalling range' alerts. This will draw your attention to watch for the possible setups.
2. Verify if there's a significant imbalance prior to the signal before taking the trade. Otherwise this may invalidate the setup.
3. Once a signal is shown on the graph (either Green arrow up for buys/Red arrow down for sells) - you should enter a trade with the given 'Take profit' and 'Stop loss' values.
4. (optional) Setup an alert for either the Strong/Weak signals. Which corresponds to when one of the arrows are printed.
Important: This is the way I use it myself, but use at own risk and remember to combine with other indicators for further confluence. Remember this is no crystal ball and I do not guarantee profitable results. The indicator merely show signals with high probability setups for scalping.
