Order + Breaker Blocks MTF - Vees Hidden LiquidityThis indicator is a Hidden Liquidity Script, being a much more refined and precise version of "Order Blocks" also known as "Supply and Demand" zones.
This script is more refined and precise as this script is the only script that displays the exact body part of blocks on multiple timeframes, showing potentially powerful price reversal zones for taking a long or short.
This is a PRICE ACTION indicator, demonstrating price action that can result in potential good support/resistance levels for taking a long or short trade.
This indicator only displays the body part of order blocks, instead of including wicks that all other indicators do. That makes this script a much more refined version of all other scripts out there.
Not only that, this script can collate multiple timeframes into one indicator, again something other scripts cannot do.
This script is also unique compared to other Hidden Liquidity style scripts in that you have full control over each Order Block so you can see each individual block on a chart, whilst other charts combine them into a zone instead. This refined version gives you precise potential entries and much further refinement as well as more thorough backtesting capabilities.
This script also can highlight order blocks that pass THROUGH a Fair Value Gap. These are known as 'Breaker Blocks'. These powerful blocks can be places of interest as support or resistance for a long or short trade. Note: This script shows the body part of a block only and not the wick.
Breaker Blocks, where significant displacement has occurred in price past a block can be more powerful. This script does not highlight Fair Value Gaps themselves, only order blocks (supply and demand) and breaker blocks through displacement in price (through an FVG). FVGs on their own can be weaker without order blocks behind them hence they are not highlighted.
The BODY of the order block, and the 0.5 of the order block are key regions for considering a trade, treating that level as either resistance or support.
Important: PLEASE NOTE: This indicator will only show timeframes that are higher than or the same as the current chart timeframe.
For Example, only blocks 3 Days or higher will show on a 3D chart. It will not show 12h blocks on a 3D chart. You would need to go to a 12 hour chart with the 12h blocks showing to see all Blocks that are 12h or higher drawn.
SETTINGS:
There is options to change the colours of the boxes and to differentiate between Order Blocks and stronger Breaker Blocks if desired.
If this is NOT desired, make all color options the same color,.
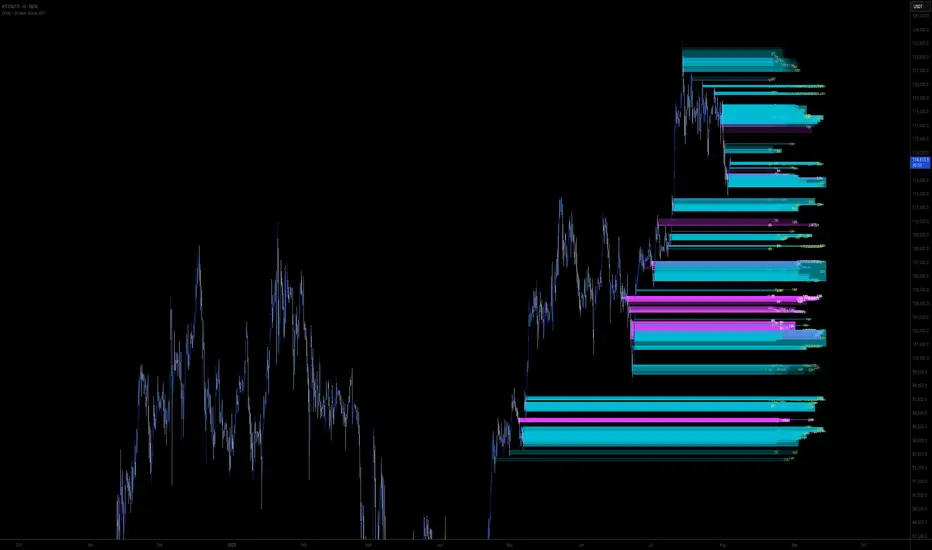
Shown below is blue Order Blocks (Supply and Demand
Shown below there is Pink Breaker Blocks.
There is options to weaken the colour of blocks that have been tapped by a wick and thus partially used up, also called partially "mitigated".These blocks can be considered weaker support/resistance.
Once a block has had a wick or body close over it entirely, the block can be considered fully "mitigated" and will disappear from the indicator once that candle has closed. This block level can now be considered too weak. You can also choose to not show these partially mitigated blocks at all.
The charts above shows pale Violet blocks as partially mitigated or "tapped" blocks.
The blocks in HOT BRIGHT Violet are untapped and potentially stronger levels for a Long or Short trade. See below the 7h.
Additional SETTINGS:
Further options include, if selected: Counting the number of fair value gaps an order block may pass through. More FVGs an order block (now a breaker block) passes through can strengthen the support of that block level, making a reversal more likely.
There is an option of showing old mitigated order blocks and changing the color of these on the chart. This can aid in backtesting of levels.
Further Settings include:
- an option to remove very thin blocks that may not be strong points.
- an option to denote with a character such as a * blocks that have their EQ 0.5 region wicked - these can be considered weaker.
- an option to denote with an additional * or another character blocks that are barely tapped by a small percent so you know they are still considered quite strong.
- an option to show how many candles form the order block.
Additional Options include:
- an option to show blocks only within a specific price range or percent range of the current price.
- an option to only look X number of bars back.
There is Options regarding labelling, and Border widths on boxes.
It is ESSENTIAL to do your own research and backtesting!
It is recommended to combine these levels with other concepts for added confluence.
Other indicators are NOT included in this script. This is purely a refined order block script for the BODY of a block only.
You can combine Order Blocks and stronger versions known as Breaker Blocks in this script with other indicators or concepts to form a Full Trading Strategy.
Other potential concepts to combine, not shown in this script can include Smart Money Concepts, Market Structure, Fibonnaccis, SMAs, EMAs or any other concept to give added confluence to the support / resistance levels identified in this script that may indicate that the level is stronger.
This indicator is not a trading strategy on its own. It is best used in combination with other concepts to improve the success.
Backtesting this indicator is highly recommended and incorporated into a full trading system of your own design. This only identifies possible key regions based on Price Action Strategies.
This indicator simply makes the identification of these hot levels easier and simpler to find, especially across multiple timeframes.
A strong bright zone on the indicator can be a stronger level than a weak partial block that is in light colours.
Again -Please do your own research and backtesting.
These indicators make finding these levels much much simpler and easier when combined with a full trading strategy.
Any feedback is welcome.
חפש סקריפטים עבור "gaps"
Order + Breaker Blocks HTFThis indicator is a Hidden Liquidity Script, being a much more refined and precise version of "Order Blocks" also known as "Supply and Demand" zones.
This script is more refined and precise as this script is the only script that displays the exact body part of blocks on multiple timeframes, showing potentially powerful price reversal zones for taking a long or short.
This is a PRICE ACTION indicator, demonstrating price action that can result in potential good support/resistance levels for taking a long or short trade.
This indicator only displays the body part of order blocks, instead of including wicks that all other indicators do. That makes this script a much more refined version of all other scripts out there.
Not only that, this script can collate multiple timeframes into one indicator, again something other scripts cannot do.
This script is also unique compared to other Hidden Liquidity style scripts in that you have full control over each Order Block so you can see each individual block on a chart, whilst other charts combine them into a zone instead. This refined version gives you precise potential entries and much further refinement as well as more thorough backtesting capabilities.
This script also can highlight order blocks that pass THROUGH a Fair Value Gap. These are known as 'Breaker Blocks'. These powerful blocks can be places of interest as support or resistance for a long or short trade. Note: This script shows the body part of a block only and not the wick.
Breaker Blocks, where significant displacement has occurred in price past a block can be more powerful. This script does not highlight Fair Value Gaps themselves, only order blocks (supply and demand) and breaker blocks through displacement in price (through an FVG). FVGs on their own can be weaker without order blocks behind them hence they are not highlighted.
The BODY of the order block, and the 0.5 of the order block are key regions for considering a trade, treating that level as either resistance or support.
Important: PLEASE NOTE: This indicator will only show timeframes that are higher than or the same as the current chart timeframe.
For Example, only blocks 3 Days or higher will show on a 3D chart. It will not show 12h blocks on a 3D chart. You would need to go to a 12 hour chart with the 12h blocks showing to see all Blocks that are 12h or higher drawn.
SETTINGS:
There is options to change the colours of the boxes and to differentiate between Order Blocks and stronger Breaker Blocks if desired.
If this is NOT desired, make all color options the same color,.
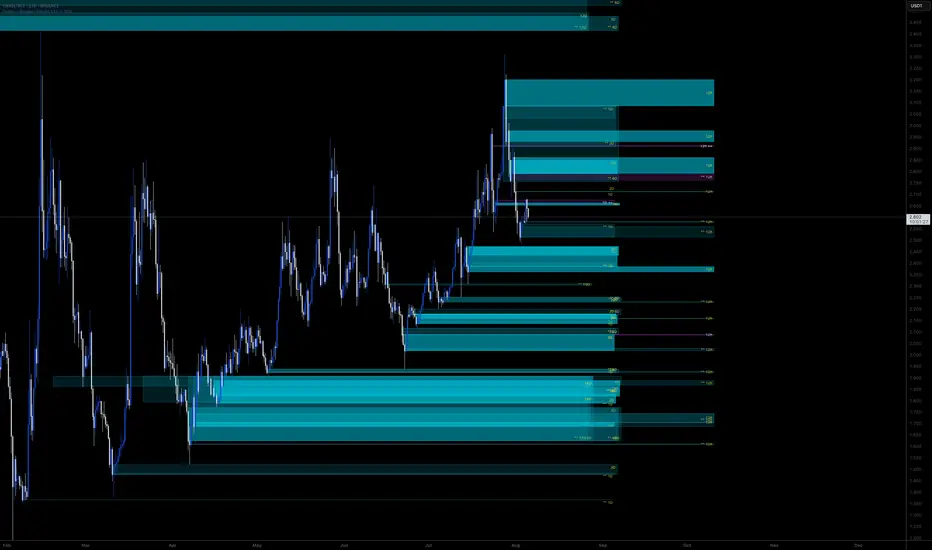
Shown below is blue Order Blocks (Supply and Demand)
Shown below there is Pink Breaker Blocks.
There is options to weaken the colour of blocks that have been tapped by a wick and thus partially used up, also called partially "mitigated".These blocks can be considered weaker support/resistance.
Once a block has had a wick or body close over it entirely, the block can be considered fully "mitigated" and will disappear from the indicator once that candle has closed. This block level can now be considered too weak. You can also choose to not show these partially mitigated blocks at all.
The chart above shows pale Violet blocks as partially mitigated or "tapped" blocks.
The blocks in HOT BRIGHT Violet are untapped and potentially stronger levels for a Long or Short trade.
See below and example of a HOT PINK stronger level with a 1,2,3,4,5 Days of blocks in the one area.
See below an example of a weaker pink level. Still valid, but potentially riskier. There is a weaker 5D Block in pale pink and no other days in that same zone.
Additional SETTINGS:
Further options include, if selected: Counting the number of fair value gaps an order block may pass through. More FVGs an order block (now a breaker block) passes through can strengthen the support of that block level, making a reversal more likely.
There is an option of showing old mitigated order blocks and changing the color of these on the chart. This can aid in backtesting of levels.
Further Settings include:
- an option to remove very thin blocks that may not be strong points.
- an option to denote with a character such as a * blocks that have their EQ 0.5 region wicked - these can be considered weaker.
- an option to denote with an additional * or another character blocks that are barely tapped by a small percent so you know they are still considered quite strong.
- an option to show how many candles form the order block.
Additional Options include:
- an option to show blocks only within a specific price range or percent range of the current price.
- an option to only look X number of bars back.
There is Options regarding labelling, and Border widths on boxes.
It is ESSENTIAL to do your own research and backtesting!
It is recommended to combine these levels with other concepts for added confluence.
Other indicators are NOT included in this script. This is purely a refined order block script for the BODY of a block only.
You can combine Order Blocks and stronger versions known as Breaker Blocks in this script with other indicators or concepts to form a Full Trading Strategy.
Other potential concepts to combine, not shown in this script can include Smart Money Concepts, Market Structure, Fibonnaccis, SMAs, EMAs or any other concept to give added confluence to the support / resistance levels identified in this script that may indicate that the level is stronger.
This indicator is not a trading strategy on its own. It is best used in combination with other concepts to improve the success.
Backtesting this indicator is highly recommended and incorporated into a full trading system of your own design. This only identifies possible key regions based on Price Action Strategies.
This indicator simply makes the identification of these hot levels easier and simpler to find, especially across multiple timeframes.
A strong bright zone on the indicator can be a stronger level than a weak partial block that is in light colours.
Again -Please do your own research and backtesting.
These indicators make finding these levels much much simpler and easier when combined with a full trading strategy.
Any feedback is welcome.
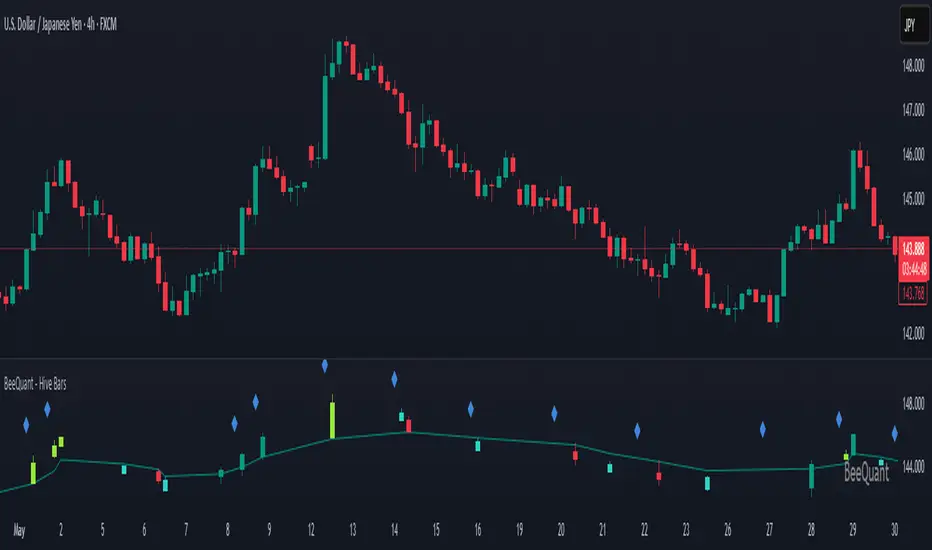
BeeQuant - Hive Bars🔶 OVERVIEW
The "Hive Bars" indicator is a truly revolutionary analytical instrument, meticulously engineered to transcend the limitations of conventional price charting and unveil the profound, underlying essence of market dynamics. Imagine possessing a sophisticated visual engine that intelligently reconstructs raw price data into unique, dynamically consolidated "Hive Bars." These specialized constructs intuitively reveal the dominant market momentum and highlight high-conviction signals often obscured by the ubiquitous noise of traditional candlesticks. This indicator acts as a precision filter, illuminating exactly when pivotal shifts are occurring by coloring these reconstructed units with an adaptive, unparalleled accuracy. It is expertly crafted for the discerning trader seeking an undeniable analytical advantage, offering a fresh, meticulously refined perspective that enables the discernment of concealed patterns, fostering more decisive and confident trading actions. Crucially, "Hive Bars" now feature proactive, real-time alert capabilities, ensuring no critical market inflection point ever goes unnoticed.
__________________________________________________________________________
🧠 CONCEPTS
At its intellectual core, the "Hive Bars" indicator operates upon an advanced, proprietary framework that fundamentally reinterprets market data. It presents this refined information through its unique "Hive Bars"—specialized visual constructs that dynamically encapsulate the consolidated spirit and true directional bias of price action, delivering unparalleled clarity.
⬜ Smart Bar Reconstruction: Hive Bars don’t follow time, they follow the market. They are derived through a sophisticated, multi-faceted internal process that precisely captures the dominant price influence and momentum over variable periods. This structure adapts dynamically to changing conditions, letting you see the real pressure behind price moves with consistency that time-based candles can’t match. This proprietary reconstruction creates a new, inherently consistent, and highly focused visual narrative of underlying market flow, effectively stripping away extraneous "noise" and revealing the market's authentic directional intent.
⬜ Multi-Layered Internal Analysis: A dynamic and live, adaptive line powers the core of Hive Bars. It recalibrates constantly, tracking market structure in real time. Every bar is formed in relation to this internal baseline, giving immediate context to price behavior. You choose the data that drives this line—open, close, high, low, or custom blends—to match your style.
⬜ Intelligent Bar Formation Sequences: Bars are created when the market speaks, not when the clock ticks. A built-in pattern engine reads the flow and waits for real structure to form. This allows the indicator to autonomously consolidate price action, presenting a cleaner, more coherent visualization of trend development as it truly unfolds, rather than fragmented snapshots based on time.
⬜ Visual Signal Precision: "Hive Bars" spring to life with an intuitively powerful coloring system. While primary colors (Green for upward bias, Red for downward bias) denote the prevailing market direction, the "Hive Bars" indicator introduces distinctively colored "Signal Hive Bars". These specialized bars emerge when the market price exhibits a particularly robust, high-conviction interaction with the adaptive internal baseline, standing out instantly and often mark key turning points or breakouts you want to act on.
⬜ Daily Reset Option: For intraday traders, there’s a reset feature that clears the internal build-up at the start of each new trading day. This ensures fresh, unbiased perspectives that are meticulously tailored to the distinct market dynamics and cyclic rhythms of the current trading day.
⬜ Adjustable Sensitivity: With Hive Smoothing, you’re in full control. This setting lets you fine-tune how sensitive the bars are to price movement. Want tighter, faster signals? Dial it down. Prefer broader, more filtered setups? Turn it up. You decide when a new Hive Bar forms—and when a Signal Bar confirms. It’s all based on how you trade and how your asset moves. No guesswork, no one-size-fits-all defaults. Hive Bars adapts to your strategy and trading style, not the other way around.
__________________________________________________________________________
✨ FEATURES
The "Hive Bars" indicator is equipped with a comprehensive suite of cutting-edge features, designed for unparalleled clarity, adaptive responsiveness, augmented analytical depth, seamless interoperability with your broader analytical toolkit, and proactive real-time notifications:
🔹Proprietary Hive Bar Reconstruction
Experience a uniquely advanced visual representation of price action that dynamically consolidates market data, leading to enhanced trend and momentum clarity that goes beyond standard charting and candlestick data.
🔹Customizable Internal Analysis Line
Gain precise control over the underlying adaptive baseline's calculation by selecting various internal price source options, ensuring its alignment with your specific analytical focus.
🔹 Smart Alerts for Key Events 🔔
Get notified in real time when:
◦ A new Hive Bar completes – signaling a fresh structural range reset
◦ A new Signal Hive Bar closes – identifying a potential overbought or oversold condition
Built-in alert conditions make it easy to stay ahead of shifts without watching every candle manually.
🔹Intelligent Bar Formation Sequencing
Diamond-shaped markers clearly indicate the start of the indicator's internal combination logic for enhanced visual understanding.
🔹High-Conviction "Signal Hive Bars" (Distinct Colors)
Receive specialized, uniquely colored visual alerts when Hive Bars exhibit strong, decisive movements relative to the adaptive baseline, indicating moments of heightened market conviction and potential opportunity.
🔹Session-Based Reconstruction
Opt for the "Daily New Start" to intelligently reset the indicator's perspective with each new trading day, providing fresh, session-aligned insights tailored for intraday precision.
🔹Unrivaled External Indicator Collaboration
A truly unique and powerful advantage of "Hive Bars" is its capability to seamlessly integrate and profoundly enhance the performance of other external indicators. By outputting clean, smoothed price data, it lets you feed a higher-quality source into tools like RSI, MACD, moving averages etc. Use close for indicators like RSI, and close for moving averages. The result is better clarity, fewer false signals, and a stronger edge across your setup. Hive Bars isn’t just an indicator, it’s an upgrade for everything you use.
🔹Non-Repainting Historical Integrity
Hive Bars never repaints. Each bar is locked in only after all internal conditions are fully met. This means you can trust every historical signal—it won’t shift or vanish after the fact. What you see in hindsight is exactly what was shown in real time.
🔹Universal Timeframe Compatibility
Whether you're scalping on the 1-minute chart or analyzing multi-month trends, Hive Bars delivers consistent, clean insights. Its architecture adapts to any timeframe without losing fidelity, making it a reliable tool for any strategy or style.
🔹Cross-Market Versatility
Hive Bars is engineered to perform with precision across all major markets—whether you're trading forex, commodities, stocks, or indices. Its adaptive logic automatically aligns with the unique volatility and structure of each asset class, delivering consistently reliable insights no matter where you trade.
__________________________________________________________________________
⚙️ USAGE
Integrating the "Hive Bars" indicator into your daily analytical regimen is an intuitive process that will profoundly enhance your ability to discern crucial market dynamics and spot high-conviction opportunities with unprecedented clarity:
💁 Effortless Application
Simply add the "Hive Bars" indicator to any chart within your TradingView platform. Note that it plots on a separate panel below your main price chart to provide its unique visual output without obscuring the primary price action.
📊 Strategic Calibration
Access the indicator's comprehensive settings panel to meticulously calibrate its powerful engines and unlock its full potential:
⚙ "Internal EMA Config"
Configure the internal adaptive baseline by choosing its source (e.g., CLOSE, HL/2) and its specific EMA length. This shapes the core reference point for the dynamic formation of the "Hive Bars."
🤖 "CONFIG Group"
Here, you decide if you want "Daily New Start" for session-based analytical resets (particularly beneficial for intraday strategies). The "Hive Smoothing" input allows you to control a further layer of consolidation for the "Hive Bars."
🟩🟥 "Color": Customize the appearance of both standard "Hive Bars" and "Signal Hive Bars" to suit your visual preferences, enhancing their immediate interpretability.
🧭 Empirical Exploration
Experimentation with these parameters is paramount. Dedicate time to exploring different combinations across various assets and timeframes to discover the optimal configuration that resonates with your unique trading methodology and the inherent volatility of the market being analyzed.
👀 Interpreting the Unveiled Market Reality: Once calibrated, the "Hive Bars" will present a strikingly clear and actionable picture of market dynamics:
+ Green/Red Hive Bars: These visually denote the consolidated directional bias of the market over the reconstructed period. A sustained sequence of Green "Hive Bars" suggests pervasive bullish pressure and an upward path of least resistance, while a series of Red "Hive Bars" indicates dominant bearish control and a clear downward momentum.
+ "Signal Hive Bars" (Distinct Colors): Pay close attention to these specially colored "Hive Bars." They signify critical moments where the reconstructed price action exhibits a particularly strong, high-conviction interaction with its adaptive internal baseline. These often precede or confirm significant market movements and serve as your clearest, most reliable visual triggers for potential shifts in market control.
⛓️ Intermittent Appearance: Observe that "Hive Bars" do not necessarily appear for every single native time unit of your chart. They are intelligently reconstructed and consolidated representations of price action, appearing only when specific internal conditions are met to present a coherent, high-impact view of distinct market phases.
🔗 Harnessing Advanced External Synergy: To unlock a new dimension of analytical power, profoundly enhance your existing indicator suite by integrating the output of "Hive Bars" as the data source for other external indicators. When adding or configuring indicators such as RSI, Stochastic Oscillators, various Moving Averages (EMA, SMA), or any other indicator that prompts for a 'source' input, you can now select the purified output of the "Hive Bars" as your desired data stream.
For oscillators (e.g., RSI, MACD), select the close or a similar relevant output from "Hive Bars" as your source. This allows the oscillator to react to the purified, consolidated momentum of the "Hive Bars" rather than the potentially noisy raw price data, leading to smoother and more meaningful oscillator signals.
For moving averages (e.g., EMA, SMA), utilize the close or other pertinent "Hive Bar" output as your source. This provides an exceptionally smooth, highly responsive, and less choppy average that precisely tracks the true underlying trend as identified by "Hive Bars." This unique capability allows for the construction of powerfully layered and synergistic trading strategies.
📢 Setting Up Proactive Alerts for Critical Events: Leverage the newly incorporated alert capabilities to maintain real-time awareness of pivotal market developments, even when not actively monitoring your charts.
You can now choose to be alerted specifically when a "New Hive Bar Closed" (signifying the definitive completion of a major market phase as identified by the indicator) or when a "New Signal Hive Bar Closed" (highlighting a high-conviction market event that warrants immediate attention due to its pronounced significance).
__________________________________________________________________________
⚠️ LIMITATIONS
While the "Hive Bars" indicator is an incredibly powerful and advanced tool for dissecting market dynamics, it is vital to understand its inherent design parameters and the prevailing platform-specific constraints for optimal and informed utilization:
👉 Visual Gaps in Plotting: Due to current platform limitations pertaining to custom candle plotting functionality, you may occasionally observe visual gaps or intermittent non-contiguous plotting between "Hive Bars" on the chart. They’re not missing data, but a result of strict plotting rules. A bar is only drawn when all internal conditions are met. This ensures accuracy, even if the chart shows some spacing.
👉 Complementary Tool: This indicator excels at providing high-conviction directional insights and identifying significant market phases. However, it is fundamentally designed as a sophisticated complementary tool to a broader trading strategy, not as a standalone, all-encompassing system. Its true power is unlocked when integrated with other analytical methods.
👉 Input Calibration Essential: The efficacy and depth of insights derived from the "Hive Bars" are highly dependent on the careful and thoughtful calibration of its input parameters, including the "Internal EMA Config," "Hive Smoothing" setting. Optimal results necessitate empirical user experimentation and fine-tuning to discover the configurations best suited for specific assets, analytical objectives, and market conditions.
👉 Exclusion of Auxiliary Data: The "Hive Bars" indicator's primary focus is exclusively on transforming and presenting price data. It does not natively incorporate other vital market information such as fundamental economic data, or news events. Integrating these additional analytical layers remains an essential aspect of constructing a truly comprehensive and robust trading strategy.
█ ▒▒▒▒▒▒▒▒▒▒▒▒▒▒▒▒▒▒▒▒▒▒▒ 『•••• ✎ ••••』 ▒▒▒▒▒▒▒▒▒▒▒▒▒▒▒▒▒▒▒▒▒▒▒▒ █
🎯 CONCLUSION
The "Hive Bars" indicator offers an unparalleled, intuitively accessible, and highly adaptable framework for instantly grasping true price momentum and direction through its intelligent, non-repainting reconstruction of market data. By transforming chaotic raw data into strikingly clear, high-conviction "Hive Bars" and dynamic signals, and now with proactive alerts to highlight critical moments, it empowers you to cut through distractions and identify market currents with unprecedented ease. Think of it as a custom lens for the market. It filters out the clutter and shows you the real structure—bars formed not by time, but by intent. It's about seeing the unseen, with enhanced clarity and a deeper understanding of market forces, now with the power to supercharge all your other tools and keep you informed. No fluff. No hype. Just an edge you can actually see—and use.
▣▣▣▣▣▣▣▣▣▣▣▣▣▣▣▣▣▣▣▣▣▣▣▣▣▣▣▣▣▣▣▣▣▣▣▣▣▣▣▣▣▣▣▣▣▣▣▣▣▣▣
🚨 RISK DISCLAIMER
Engagement in financial market speculation inherently carries a substantial degree of inherent risk, and the potential for capital diminution, potentially exceeding initial deposits, is a pervasive and non-trivial consideration. All content, algorithmic tools, scripts, articles, and educational materials disseminated by "Hive Bars" are exclusively purposed for informational and pedagogical objectives, strictly for reference. Historical performance data, whether explicitly demonstrated or implicitly suggested, offers no infallible assurance or guarantee of future outcomes. Users bear sole and ultimate accountability for their individual trading decisions and are emphatically urged to meticulously assess their financial disposition, risk tolerance parameters, and conduct independent due diligence prior to engaging in any speculative activity.
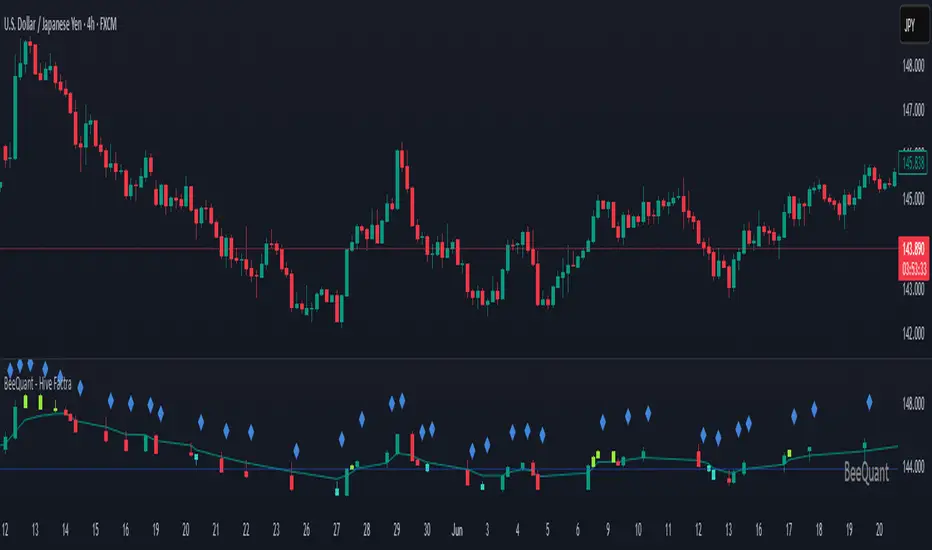
BeeQuant - Hive Factra🔶 OVERVIEW
The "Hive Factra" is a groundbreaking analytical instrument designed to unveil the true essence of market movement, transforming complex price action into powerfully consolidated insights. Imagine having a specialized lens that intelligently reconstructs market periods into unique "Hive Factra Bars," revealing underlying momentum and high-conviction signals often obscured in traditional charts. This indicator cuts through the noise, showing you precisely when significant shifts are occurring by coloring these reconstructed bars with an adaptive precision. It's built for traders who seek unfiltered perspective that helps see hidden patterns and make more decisive moves.
__________________________________________________________________________
🧠 CONCEPTS
Markets move in impulses and compressions. Most trend indicators rely on single-frame slope logic, which often flips during minor pullbacks. Hive Factra takes a different route. At its core, the "Hive Factra" operates on a sophisticated framework that reinterprets market data, presenting it through its proprietary "Hive Factra Bars", unique visualizations that capture the consolidated spirit of price action.
⬜ The "Hive Factra" Reconstruction: Unlike standard candles, "Hive Factra Bars" are intelligently re-engineered representations of market activity. They are derived through a proprietary process that captures the dominant price influence over specific periods, presenting a clearer, more focused view of underlying momentum. These unique bars visually consolidate information, making the core directional bias immediately apparent.
⬜ The Adaptive Baseline: An internal, dynamic analysis line constantly adjusts to market flow, serving as a crucial reference point for the "Hive Factra Bars." This adaptive baseline provides real-time context, helping the indicator precisely determine the significance of each reconstructed bar's movement.
⬜ High-Conviction Coloring & Signal Bars: The "Factra Bars" come to life with a discerning coloring system. While they reflect the primary market direction (Green for upward bias, Red for downward bias), the "Hive Factra" introduces specialized "Signal Hive Bars" with distinct colors. These unique bars appear when the consolidated price action exhibits a particularly strong, high-conviction interaction with the adaptive baseline, acting as powerful visual alerts for moments of heightened significance.
⬜ Session-Aligned Insights: For intraday traders, the "Daily New Start" option provides a unique advantage. When enabled, the indicator can reset its internal reconstruction process with each new trading session, offering fresh, unbiased perspectives tailored to the day's distinct market dynamics.
⬜ Dynamic Sensitivity: A configurable "Offset" allows you to fine-tune the indicator's responsiveness and the thresholds for initiating these "Hive Factra Bars" and "Signal Hive Bars." This ensures the indicator aligns perfectly with your individual trading style and the volatility of the asset you're analyzing.
__________________________________________________________________________
✨ FEATURES
The "Hive Factra" is equipped with a suite of cutting-edge features, all meticulously designed for unparalleled clarity, adaptive responsiveness, and augmented analytical depth:
🔹 Proprietary Hive Factra Bars
Experience a unique visual representation of price action that consolidates market data for enhanced trend and momentum clarity.
🔹 Customizable Internal Analysis Line
Control the underlying adaptive baseline's calculation for precise alignment with market flow, utilizing various price source options.
🔹 High-Conviction "Signal Hive Bars" (Distinct Colors)
Receive specialized visual alerts when Factra Bars exhibit strong, decisive movements relative to the adaptive baseline, indicating moments of heightened market conviction.
🔹 Overbought/Oversold Visuals
Signal Hive Bars highlight areas of potential exhaustion, providing intuitive insight into stretched conditions
🔹 Session-Based Reconstruction
Opt for the "Daily New Start" to reset the indicator's perspective with each new trading day, providing fresh, session-aligned insights.
🔹 Dynamic Offset Control
Adjust the "Offset" parameter to fine-tune the sensitivity of the Factra Bar reconstruction and signal generation thresholds, tailoring the indicator to specific market conditions.
🔹 Non-Repainting Logic for Historical Reliability
Each "Hive Factra Bar" is plotted only when its internal reconstruction conditions are fully met and confirmed. This ensures that the historical display of Factra Bars does not repaint, providing a high degree of reliability and trust in past signals and visualizations.
🔹 Cross-Market Versatility
This indicator is engineered to perform with precision across all major markets—whether you're trading forex, commodities, stocks, or indices. Its adaptive logic automatically aligns with the unique volatility and structure of each asset class, delivering consistently reliable insights no matter where you trade.
🔹 Custom Range Start Marker
A subtle diamond-shaped symbol is plotted to indicate the start of the Hive Factra logic cycle. This marks the bar from which the internal price range begins accumulating until a new Hive Factra Bar is confirmed and displayed. Helps visualize the dynamic evaluation period used in Factra’s structural detection.
🔹 Smart Alerts for Key Events
Get notified in real time when:
◦ A new Hive Factra Bar completes – signaling a fresh structural range reset
◦ A new Signal Hive Bar closes – identifying a potential overbought or oversold condition
Built-in alert conditions make it easy to stay ahead of shifts without watching every candle manually.
🔹 Universal Timeframe Compatibility: The "Hive Factra" is meticulously engineered to perform flawlessly across all timeframes, from rapid intraday charts to long-term weekly and monthly views. This universal compatibility ensures you receive consistent, high-quality insights regardless of your analytical horizon.
🔹 Unrivaled External Indicator Collaboration: A truly unique advantage of the "Hive Factra" is its capability to seamlessly integrate and enhance the performance of other external indicators. Its meticulously processed output, can serve as a highly purified and consolidated 'source' for indicators that accept such inputs (e.g., RSI, StochRSI, moving averages), which allows for more insightful data stream into your favorite indicators, potentially unlocking new levels of responsiveness and signal accuracy for your entire analytical setup.
__________________________________________________________________________
⚙️ USAGE
Integrating the "Hive Factra" into your daily analytical regimen is intuitive and will profoundly enhance your ability to discern crucial market dynamics and spot high-conviction opportunities:
💁 Effortless Application
Simply add the "Hive Factra" indicator to any chart within your TradingView platform. Note that it plots on a separate panel below your main price chart to provide its unique visual output without obscuring price.
📊 Tailored Calibration: Access the indicator's settings to unlock its full potential:
⚙ "Internal EMA Config"
Configure the internal adaptive baseline by choosing its source (e.g., Close, HL/2) and length. This shapes the core reference point for the Factra Bars.
⚙ "Hive Factra"
Decide if you want "Daily New Start" for session-based analysis and choose the "Source" type for how the Factra Bars are built.
🤖 "Offset"
Experiment with the "Offset" percentage to adjust the sensitivity of the Factra Bar's reconstruction. A smaller offset will make the Factra Bars appear more frequently, while a larger one will highlight only more significant movements.
🟩🟥 Green/Red Hive Factra Bars
These indicate the consolidated directional bias of the market over the reconstructed period. A sequence of Green bars suggests sustained bullish pressure, while Red bars point to dominant bearish control.
🚀 "Signal Hive Bars" (Unique Colors)
Pay close attention to these specially colored Hive Factra Bars. They signify moments where the reconstructed price action exhibits a high-conviction interaction with its adaptive baseline, often preceding or confirming significant market moves. These are your clearest signals for potential shifts.
✨ Appearance of Hive Factra Bars
Notice that these Bars do not necessarily appear for every single time unit. They intelligently reconstruct and consolidate price action, appearing only when conditions align to present a coherent, high-impact view of market phases.
🪢 Harnessing External Synergy
To unlock a new dimension of analysis, consider integrating "Hive Factra" as the data source for other indicators:
1. When adding indicators like RSI, StochRSI, or others that prompt for a 'source' input, you can select the "Hive Factra" as the input.
2. For oscillators (e.g., RSI, Stochastic), choose the close or similar output from "Hive Factra" as your source. This allows the oscillator to react to the purified, consolidated momentum of the Factra Bars rather than raw price.
For moving averages (e.g., EMA, SMA), use the close or other relevant Factra Bar output as your source. This provides an exceptionally smooth and responsive average that tracks the true underlying trend.
__________________________________________________________________________
⚠️ LIMITATIONS
While the "Hive Factra" is an incredibly powerful tool for dissecting market dynamics, it's vital to understand its design parameters for optimal use. It does not attempt to front-run reversals or predict market turns. Instead, it focuses on framing price behavior so traders can react with context.
👉 Visual Gaps in Plotting: Due to Tradingview platform limitations with custom candle plotting functionality, you may observe visual gaps between "Hive Factra Bars" on the chart. This occurs because the indicator only plots a Hive Factra Bar when its internal conditions for reconstruction are fully met, and there isn't an 'offset' parameter for custom candles to bridge these visual discontinuities. Importantly, this behavior ensures that each plotted Factra Bar is confirmed and does not repaint, providing reliable historical analysis.
👉 Reconstructed Data, Not Raw Price: It's crucial to remember that "Hive Factra Bars" are not traditional candles. They are a derived visualization that intelligently consolidates price data.
👉 Complementary Tool: This indicator excels at providing high-conviction directional insights and identifying significant market phases. However, it is designed as a sophisticated complement to a broader trading strategy, not a standalone system.
👉 Input Calibration Essential: The effectiveness of the "Hive Factra" is highly dependent on careful calibration of its input parameters, especially the "Offset" and internal EMA settings. Optimal results require user experimentation to find settings best suited for specific assets and timeframes.
👉 Exclusion of Auxiliary Data: The "Hive Factra" focuses solely on transforming price data. It does not incorporate other vital market information such as trading volume, market breadth, or fundamental news. Integrating these additional analytical layers remains essential for a comprehensive trading strategy.
█ ▒▒▒▒▒▒▒▒▒▒▒▒▒▒▒▒▒▒▒▒▒▒▒ 『•••• ✎ ••••』 ▒▒▒▒▒▒▒▒▒▒▒▒▒▒▒▒▒▒▒▒▒▒▒▒ █
🎯 CONCLUSION
The "Hive Factra" offers an unparalleled, intuitive, and highly adaptable framework for instantly grasping true price momentum and direction through its intelligent reconstruction of market data. By transforming chaotic raw data into strikingly clear, high-conviction "Factra Bars" and dynamic signals, it empowers you to cut through distractions and identify critical market currents with ease. Its revolutionary capability for seamless collaboration with external indicators (like RSI, EMA, etc., by using its purified output as their source) means you can elevate the performance of your entire analytical suite to new levels of precision and clarity. Seamlessly integrate this advanced visual tool within your analytical framework to gain a sharper, more confident perspective, and elevate your strategic decision-making in the markets. It's about seeing the unseen, with enhanced clarity and a deeper understanding of market forces, now with the power to supercharge all your other tools.
▣▣▣▣▣▣▣▣▣▣▣▣▣▣▣▣▣▣▣▣▣▣▣▣▣▣▣▣▣▣▣▣▣▣▣▣▣▣▣▣▣▣▣▣▣▣▣▣▣▣▣
🚨 RISK DISCLAIMER
Engagement in financial market speculation inherently carries a substantial degree of inherent risk, and the potential for capital diminution, potentially exceeding initial deposits, is a pervasive and non-trivial consideration. All content, algorithmic tools, scripts, articles, and educational materials disseminated by "Hive Factra" are exclusively purposed for informational and pedagogical objectives, strictly for reference. Historical performance data, whether explicitly demonstrated or implicitly suggested, offers no infallible assurance or guarantee of future outcomes. Users bear sole and ultimate accountability for their individual trading decisions and are emphatically urged to meticulously assess their financial disposition, risk tolerance parameters, and conduct independent due diligence prior to engaging in any speculative market activity.
HyperFlowIntroduction
HyperFlow is a premium market structure and liquidity rotation model built around the principles of internal inefficiencies, tested imbalances, and delivery shifts. Drawing inspiration from ICT concepts, it provides a high-level framework for identifying smart money footprints and timing entries with precision.
Rather than forecasting direction, HyperFlow focuses on recognizing repeatable delivery behaviors — helping traders visually track liquidity shifts from internal ranges to external objectives with consistency.
Core Philosophy
Markets are governed by the logic of liquidity engineering — the search and destruction of internal inefficiencies (Fair Value Gaps), followed by continuations toward external liquidity.
Timeframes to use:
HTF -> LTF
5m -> 15s
15m -> 1m
1h -> 5m
4h -> 15m
Daily -> 1h
Weekly -> 4h
Monthly -> 1D
HyperFlow identifies these transitions by:
Detecting High Timeframe Fair Value Gaps (HTF FVGs) — structural imbalances created by displacement
Tracking Valid Tests of those FVGs — signaling willingness to respect internal structure
Filtering for Delivery Confirmations — only acting when price delivers with intent through reclaimed imbalances
Mapping Risk and Objective Zones — using recent swing structures to define stop and target logic rooted in market logic
All components are reactive, visual, and non-repainting — designed to highlight structure after it forms, not anticipate it prematurely.
Key Features
Internal Range Liquidity Zones: Cleanly marked HTF imbalances show where price may seek efficiency
Tested FVG Filtering: Signals only form on valid rebalances — we wait for proof, not potential
Shift in Delivery Conditions: Price must show intent to reclaim imbalance before any rotation is considered
Automatic Objective Mapping: Recent structural highs/lows are used to project stop and target zones automatically
Session Filters + Time Alignment: Restrict signals to high-probability hours or defined killzones
Minimal, High-Impact Visuals: Tested/untested FVGs are differentiated by transparency and tone, keeping your chart clean and focused
HyperFlow is built for:
Traders who understand price delivery theory
Analysts studying displacement → reversion → continuation
Those seeking higher timeframe bias alignment through tested structure
Users of ICT-based concepts who want a visual, rules-based companion
This is not a beginner's tool. It’s for those seeking repeatable execution through structure and refinement, not guesswork.
Terms and Conditions
Our charting tools are products provided for informational and educational purposes only and do not constitute financial, investment, or trading advice. Our charting tools are not designed to predict market movements or provide specific recommendations. Users should be aware that past performance is not indicative of future results and should not be relied upon for making financial decisions. By using our charting tools, the purchaser agrees that the seller and the creator are not responsible for any decisions made based on the information provided by these charting tools. The purchaser assumes full responsibility and liability for any actions taken and the consequences thereof, including any loss of money or investments that may occur as a result of using these products. Hence, by purchasing these charting tools, the customer accepts and acknowledges that the seller and the creator are not liable nor responsible for any unwanted outcome that arises from the development, the sale, or the use of these products. Finally, the purchaser indemnifies the seller from any and all liability. If the purchaser was invited through the Friends and Family Program, they acknowledge that the provided discount code only applies to the first initial purchase of any SMCapital product. The purchaser is therefore responsible for cancelling – or requesting to cancel – their subscription in the event that they do not wish to continue using the product at full retail price. If the purchaser no longer wishes to use the products, they must unsubscribe from the membership service, if applicable. We hold no reimbursement, refund, or chargeback policy. Once these Terms and Conditions are accepted by the Customer, before purchase, no reimbursements, refunds or chargebacks will be provided under any circumstances.
By continuing to use these charting tools, the user acknowledges and agrees to the Terms and Conditions outlined in this legal disclaimer.

Timeframe Resistance Evaluation And Detection - CoffeeKillerTREAD - Timeframe Resistance Evaluation And Detection Guide
🔔 Important Technical Limitation 🔔
**This indicator does NOT fetch true higher timeframe data.** Instead, it simulates higher timeframe levels by aggregating data from your current chart timeframe. This means:
- Results will vary depending on what chart timeframe you're viewing
- Levels may not match actual higher timeframe candle highs/lows
- You might miss important wicks or gaps that occurred between chart timeframe bars
- **Always verify levels against actual higher timeframe charts before trading**
Welcome traders! This guide will walk you through the TREAD (Timeframe Resistance Evaluation And Detection) indicator, a multi-timeframe analysis tool developed by CoffeeKiller that identifies support and resistance confluence across different time periods.(I am 50+ year old trader and always thought I was bad a teaching and explaining so you get a AI guide. I personally use this on the 5 minute chart with the default settings, but to each there own and if you can improve the trend detection methods please DM me. I would like to see the code. Thanks)
Core Components
1. Dual Timeframe Level Tracking
- Short Timeframe Levels: Tracks opening price extremes within shorter periods
- Long Timeframe Levels: Tracks actual high/low extremes within longer periods
- Dynamic Reset Mechanism: Levels reset at the start of each new timeframe period
- Momentum Detection: Identifies when levels change mid-period, indicating active price movement
2. Visual Zone System
- High Zones: Areas between long timeframe highs and short timeframe highs
- Low Zones: Areas between long timeframe lows and short timeframe lows
- Fill Coloring: Dynamic colors based on whether levels are static or actively changing
- Momentum Highlighting: Special colors when levels break during active periods
3. Customizable Display Options
- Multiple Plot Styles: Line, circles, or cross markers
- Flexible Timeframe Selection: Wide range of short and long timeframe combinations
- Color Customization: Separate colors for each level type and momentum state
- Toggle Controls: Show/hide different elements based on trading preference
Main Features
Timeframe Settings
- Short Timeframe Options: 15m, 30m, 1h, 2h, 4h
- Long Timeframe Options: 1h, 2h, 4h, 8h, 12h, 1D, 1W
- Recommended Combinations:
- Scalping: 15m/1h or 30m/2h
- Day Trading: 30m/4h or 1h/4h
- Swing Trading: 4h/1D or 1D/1W
Display Configuration
- Level Visibility: Toggle short/long timeframe levels independently
- Fill Zone Control: Enable/disable colored zones between levels
- Momentum Fills: Special highlighting for actively changing levels
- Line Customization: Width, style, and color options for all elements
Color System
- Short TF High: Default red for resistance levels
- Short TF Low: Default green for support levels
- Long TF High: Transparent red for broader resistance context
- Long TF Low: Transparent green for broader support context
- Momentum Colors: Brighter colors when levels are actively changing
Technical Implementation Details
How Level Tracking Works
The indicator uses a custom tracking function that:
1. Detects Timeframe Periods: Uses `time()` function to identify when new periods begin
2. Tracks Extremes: Monitors highest/lowest values within each period
3. Resets on New Periods: Clears tracking when timeframe periods change
4. Updates Mid-Period: Continues tracking if new extremes are reached
The Timeframe Limitation Explained
`pinescript
// What the indicator does:
short_tf_start = ta.change(time(short_timeframe)) != 0 // Detects 30m period start
= track_highest(open, short_tf_start) // BUT uses chart TF opens!
// What true multi-timeframe would be:
// short_tf_high = request.security(syminfo.tickerid, short_timeframe, high)
`
This means:
- On a 5m chart with 30m/4h settings: Tracks 5m bar opens during 30m and 4h windows
- On a 1m chart with same settings: Tracks 1m bar opens during 30m and 4h windows
- Results will be different between chart timeframes
- May miss important price action that occurred between your chart's bars
Visual Elements
1. Level Lines
- Short TF High: Upper resistance line from shorter timeframe analysis
- Short TF Low: Lower support line from shorter timeframe analysis
- Long TF High: Broader resistance context from longer timeframe
- Long TF Low: Broader support context from longer timeframe
2. Zone Fills
- High Zone: Area between long TF high and short TF high (potential resistance cluster)
- Low Zone: Area between long TF low and short TF low (potential support cluster)
- Regular Fill: Standard transparency when levels are static
- Momentum Fill: Enhanced visibility when levels are actively changing
3. Dynamic Coloring
- Static Periods: Normal colors when levels haven't changed recently
- Active Periods: Momentum colors when levels are being tested/broken
- Confluence Zones: Different intensities based on timeframe alignment
Trading Applications
1. Support/Resistance Trading
- Entry Points: Trade bounces from zone boundaries
- Confluence Areas: Focus on areas where short and long TF levels cluster
- Zone Breaks: Enter on confirmed breaks through entire zones
- Multiple Timeframe Confirmation: Stronger signals when both timeframes align
2. Range Trading
- Zone Boundaries: Use fill zones as range extremes
- Mean Reversion: Trade back toward opposite zone when price reaches extremes
- Breakout Preparation: Watch for momentum color changes indicating potential breakouts
- Risk Management: Place stops outside the opposite zone
3. Trend Following
- Direction Bias: Trade in direction of zone breaks
- Pullback Entries: Enter on pullbacks to broken zones (now support/resistance)
- Momentum Confirmation: Use momentum coloring to confirm trend strength
- Multiple Timeframe Alignment: Strongest trends when both timeframes agree
4. Scalping Applications
- Quick Bounces: Trade rapid moves between zone boundaries
- Momentum Signals: Enter when momentum colors appear
- Short-Term Targets: Use opposite zone as profit target
- Tight Stops: Place stops just outside current zone
Optimization Guide
1. Timeframe Selection
For Different Trading Styles:
- Scalping: 15m/1h - Quick levels, frequent updates
- Day Trading: 30m/4h - Balanced view, good for intraday moves
- Swing Trading: 4h/1D - Longer-term perspective, fewer false signals
- Position Trading: 1D/1W - Major structural levels
2. Chart Timeframe Considerations
**Important**: Your chart timeframe affects results
- Lower Chart TF: More granular level tracking, but may be noisy
- Higher Chart TF: Smoother levels, but may miss important price action
- Recommended: Use chart timeframe 2-4x smaller than short indicator timeframe
3. Display Settings
- Busy Charts: Disable fills, show only key levels
- Clean Analysis: Enable all fills and momentum coloring
- Multi-Monitor Setup: Use different color schemes for easy identification
- Mobile Trading: Increase line width for visibility
Best Practices
1. Level Verification
- Always Cross-Check: Verify levels against actual higher timeframe charts
- Multiple Timeframes: Check 2-3 different chart timeframes for consistency
- Price Action Confirmation: Wait for candlestick confirmation at levels
- Volume Analysis: Combine with volume for stronger confirmation
2. Risk Management
- Stop Placement: Use zones rather than exact prices for stops
- Position Sizing: Reduce size when zones are narrow (higher risk)
- Multiple Targets: Scale out at different zone boundaries
- False Break Protection: Allow for minor zone penetrations
3. Signal Quality Assessment
- Momentum Colors: Higher probability when momentum coloring appears
- Zone Width: Wider zones often provide stronger support/resistance
- Historical Testing: Backtest on your preferred timeframe combinations
- Market Conditions: Adjust sensitivity based on volatility
Advanced Features
1. Momentum Detection System
The indicator tracks when levels change mid-period:
`pinescript
short_high_changed = short_high != short_high and not short_tf_start
`
This identifies:
- Active level testing
- Potential breakout situations
- Increased market volatility
- Trend acceleration points
2. Dynamic Color System
Complex conditional logic determines fill colors:
- Static Zones: Regular transparency for stable levels
- Active Zones: Enhanced colors for changing levels
- Mixed States: Different combinations based on user preferences
- Custom Overrides: User can prioritize certain color schemes
3. Zone Interaction Analysis
- Convergence: When short and long TF levels approach each other
- Divergence: When timeframes show conflicting levels
- Alignment: When both timeframes agree on direction
- Transition: When one timeframe changes while other remains static
Common Issues and Solutions
1. Inconsistent Levels
Problem: Levels look different on various chart timeframes
Solution: Always verify against actual higher timeframe charts
2. Missing Price Action
Problem: Important wicks or gaps not reflected in levels
Solution: Use chart timeframe closer to indicator's short timeframe setting
3. Too Many Signals
Problem: Excessive level changes and momentum alerts
Solution: Increase timeframe settings or reduce chart timeframe granularity
4. Lagging Signals
Problem: Levels seem to update too slowly
Solution: Decrease chart timeframe or use more sensitive timeframe combinations
Recommended Setups
Conservative Approach
- Timeframes: 4h/1D
- Chart: 1h
- Display: Show fills only, no momentum coloring
- Use: Swing trading, position management
Aggressive Approach
- Timeframes: 15m/1h
- Chart: 5m
- Display: All features enabled, momentum highlighting
- Use: Scalping, quick reversal trades
Balanced Approach
- Timeframes: 30m/4h
- Chart: 15m
- Display: Selective fills, momentum on key levels
- Use: Day trading, multi-session analysis
Final Notes
**Remember**: This indicator provides a synthetic view of multi-timeframe levels, not true higher timeframe data. While useful for identifying potential confluence areas, always verify important levels by checking actual higher timeframe charts.
**Best Results When**:
- Combined with actual multi-timeframe analysis
- Used for confluence confirmation rather than primary signals
- Applied with proper risk management
- Verified against price action and volume
**DISCLAIMER**: This indicator and its signals are intended solely for educational and informational purposes. The timeframe limitation means results may not reflect true higher timeframe levels. Always conduct your own analysis and verify levels independently before making trading decisions. Trading involves significant risk of loss.

Path of Least ResistancePath of Least Resistance (PLR)
Concept Overview
The Path of Least Resistance indicator identifies key zones on your chart that act like "muddy" or "sticky" areas where price tends to get bogged down, creating choppy and unpredictable price action. Between these zones lie the "empty spaces" - clear paths where price can move freely with momentum and direction.
The Analogy: Muddy Fields vs Open Roads
Think of your chart like a landscape:
🟫 ZONES (Muddy/Sticky Areas)
Fair Value Gaps (FVGs) from higher timeframes
Pivot wick zones from higher timeframe pivots
Areas where price gets "stuck" and churns
Like walking through thick mud - slow, choppy, unpredictable movement
Price action becomes erratic and difficult to trade
🟢 EMPTY SPACES (Open Roads)
The clear areas between zones
Where price can move freely with momentum
Like driving on an open highway - smooth, directional movement
The "Path of Least Resistance" for price movement
Trading Philosophy
AVOID Trading Within Zones:
Price action is typically choppy and unpredictable
Higher probability of false signals and whipsaws
Like trying to drive through mud - you'll get stuck
TRADE Through the Empty Spaces:
Look for moves that travel between zones
Price tends to move with momentum and direction
Higher probability setups with cleaner price action
Like taking the highway instead of back roads
Zone Types Detected
Fair Value Gaps (FVGs)
Imbalances from higher timeframe candles
Areas where price "owes" a return visit
Often act as magnets, creating choppy price action
Pivot Wick Zones
Upper and lower wicks from higher timeframe pivots
Rejection areas where price previously struggled
Often create resistance/support that leads to choppy movement
Color Coding System
The zones dynamically change color based on current price position:
🔴 RED ZONES : Price is below the zone (bearish context)
🟢 GREEN ZONES : Price is above the zone (bullish context)
🔘 GRAY ZONES : Price is within the zone (neutral/choppy area)
The "Mum Trades" Strategy
The best trades - what we call "Mum trades" (trades so obvious even your mum could spot them) - happen in the empty spaces between zones:
✅ High Probability Characteristics:
Clear directional movement between zones
Less noise and false signals
Higher momentum and follow-through
Cleaner technical patterns
❌ Avoid These Areas:
Trading within the muddy zones
Expecting clean moves through sticky areas
Fighting against the natural flow of price
Key Features
Auto Timeframe Detection : Automatically selects appropriate higher timeframe
Dynamic Zone Management : Overlapping zones are automatically cleaned up
Real-time Alerts : Get notified when price enters/exits zones
Visual Clarity : Clean zone display with extending boundaries
How to Use
Identify the Zones : Let the indicator mark the muddy areas
Find the Paths : Look for clear spaces between zones
Plan Your Trades : Target moves that travel through empty space
Avoid the Mud : Stay away from trading within the zones
Follow the Flow : Trade with the path of least resistance
Remember
Price, like water, always seeks the path of least resistance. By identifying where that path is clear (empty spaces) versus where it's obstructed (zones), you can align your trading with the natural flow of the market rather than fighting against it.
The goal is simple: Trade the highways, avoid the mud.

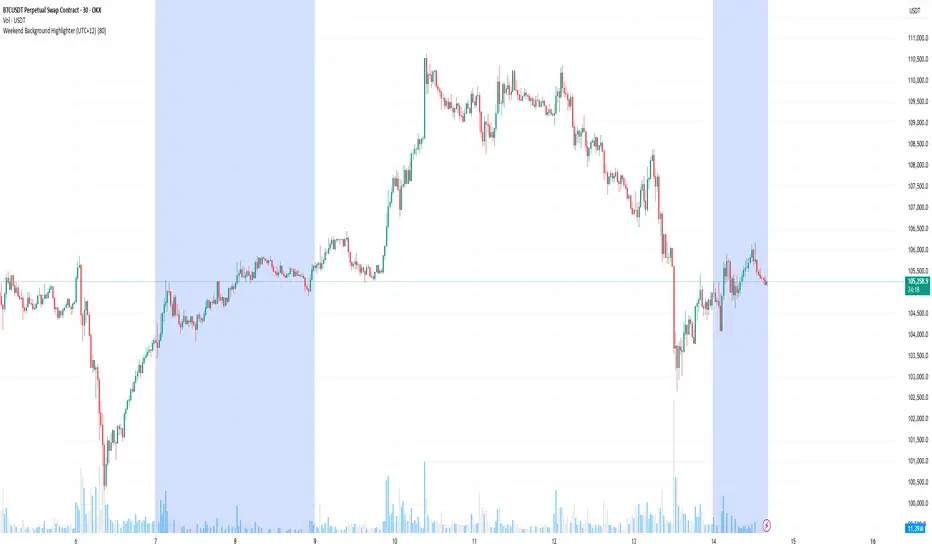
Weekend Background Highlighter (UTC+12)## Weekend Background Highlighter (UTC+12)
### Description
This indicator automatically highlights weekend periods on your TradingView charts specifically for the UTC+12 timezone (New Zealand Standard Time). Perfect for traders who need to visualize market closures and weekend gaps in the New Zealand/Pacific time zone, regardless of their exchange's native timezone or chart settings.
### Key Features
- **Fixed UTC+12 Timezone**: Hardcoded to always show weekends according to UTC+12, independent of exchange or chart timezone settings
- **Customizable Appearance**: Adjust background color and opacity to match your chart theme
- **Optional Weekend Labels**: Mark the beginning of each weekend period with customizable labels
- **Debug Mode**: View real-time timezone calculations to verify correct weekend detection
- **Lightweight**: Minimal performance impact with efficient calculations
### Use Cases
- **Forex Traders**: Identify weekend gaps and Monday openings in NZD pairs
- **Cryptocurrency Traders**: Visualize weekend trading patterns in the Pacific timezone
- **Multi-Market Traders**: Maintain consistent weekend awareness across different exchanges
- **Risk Management**: Clearly see when markets are closed for position management
### Settings
- **Weekend Background Color**: Choose any color for the weekend highlight
- **Opacity**: Control transparency (0-100%) to maintain chart visibility
- **Show Weekend Labels**: Toggle labels marking weekend start
- **Debug Info**: Display timezone calculations for verification
### How It Works
The indicator calculates the current UTC time and adds 12 hours to determine the UTC+12 time. It then checks if the resulting day falls on Saturday or Sunday, highlighting these periods on your chart. This ensures weekends are always displayed according to New Zealand time, regardless of your broker's timezone or your local settings.
### Notes
- Weekends begin at 00:00 Saturday UTC+12 (12:00 Friday UTC)
- Weekends end at 00:00 Monday UTC+12 (12:00 Sunday UTC)
- Works on all timeframes and markets
- Compatible with Pine Script v6
### Tags
weekend, background, timezone, UTC+12, New Zealand, highlight, trading sessions, forex, crypto, time zones, market hours, pacific time
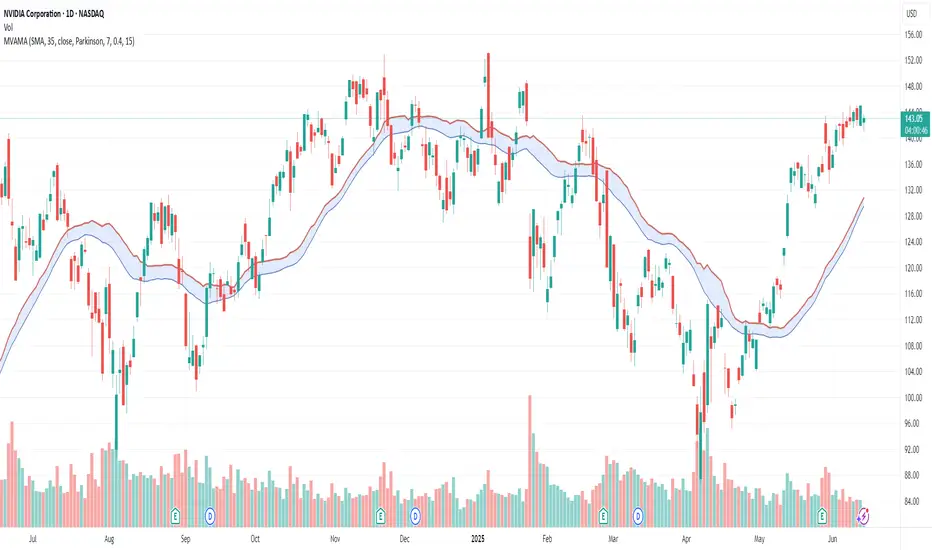
Multi-Volatility Adjusted Moving Average🎯 Core Concept
The Multi-Volatility Adjusted Moving Average (MVAMA) is an advanced technical indicator that creates an adaptive moving average with a built-in upward bias. Unlike traditional moving averages that simply follow price, this indicator adjusts upward based on market volatility, making it particularly useful for identifying dynamic resistance levels and trend strength.
🔧 How It Works
Key Principle: Upward Volatility Bias
Base Calculation: Starts with your chosen moving average (EMA, SMA, etc.)
Volatility Measurement: Calculates market volatility using one of 5 different methods
Upward Adjustment: Always adds volatility adjustment upward: Adaptive MA = Base MA + Volatility Adjustment
Dynamic Resistance: Creates a moving resistance level that adapts to market conditions
📊 5 Volatility Calculation Methods
1. Simple (High-Low Range)
Method: (High - Low) / Close × 100
Best For: Clean, straightforward volatility measurement
Use Case: General purpose, all market conditions
2. Parkinson (Range-Based Log Volatility)
Method: √(ln(High/Low)²) with safety bounds
Best For: Intraday volatility without using open/close gaps
Use Case: Choppy markets, day trading
3. ATR (Average True Range)
Method: Traditional ATR as percentage of price
Best For: Handling gaps and limit moves
Use Case: Swing trading, gap-prone markets
4. Standard Deviation (Statistical)
Method: Standard deviation of price returns
Best For: Academic/statistical approach
Use Case: Backtesting, quantitative analysis
5. Garman-Klass (OHLC Optimized)
Method: 0.5×ln(H/L)² - (2ln2-1)×ln(C/O)²
Best For: Most comprehensive volatility using all OHLC data
Use Case: Professional trading, maximum accuracy
🎛️ 12 Moving Average Types
Fast & Responsive:
HMA (Hull): Minimal lag, very responsive
DEMA/TEMA: Double/Triple exponential for speed
WMA: Weighted for recent price emphasis
Balanced:
EMA: Classic exponential (default)
ALMA: Arnaud Legoux for balanced response
LSMA: Linear regression trend following
Smooth & Stable:
SMA: Simple moving average
SMMA/RMA: Smoothed for noise reduction
TRIMA: Triangular for maximum smoothness
VWMA: Volume-weighted for market participation
💡 Practical Applications
Trading Uses:
Dynamic Resistance: Acts as adaptive resistance level
Trend Strength: Higher volatility = stronger adjustment = more significant level
Entry Timing: Price touching the adaptive MA can signal rejection points
Risk Management: Volatility bands show market uncertainty
Market Analysis:
Low Volatility: Adaptive MA stays close to base MA (consolidation)
High Volatility: Adaptive MA moves significantly above base MA (trending/breakout)
Trend Confirmation: Sustained distance between price and adaptive MA shows trend strength
⚙️ Key Features
Risk Management:
Volatility Capping: Prevents extreme adjustments (default 15% max)
Safety Bounds: All calculations protected against infinite/NaN values
Parameter Limits: Sensible ranges for all inputs
Visualization Options:
Base MA Display: Show underlying moving average
Volatility Bands: Visual representation of volatility adjustment
Custom Colors: Professional color schemes
Clean Interface: Organized input groups
Professional Features:
Multi-timeframe Support: Works on any timeframe
Alert Framework: Ready-to-enable price crossover alerts
🎯 Ideal For:
Traders Who Want:
Dynamic support/resistance levels
Volatility-aware trend analysis
Adaptive position sizing based on market conditions
Professional-grade technical analysis tools
Market Conditions:
Trending Markets: Volatility creates meaningful resistance levels
Volatile Markets: Adaptive adjustment handles changing conditions
All Timeframes: From scalping to position trading
🔍 Unique Advantages:
Always Upward Bias: Unlike oscillating indicators, always provides clear directional bias
Multi-Volatility Support: Choose the best volatility method for your market/style
Comprehensive MA Library: 12 different moving average types
Built-in Risk Management: Prevents extreme values that break other indicators
Professional Implementation: Publication-ready code with proper documentation
This script transforms traditional moving averages into intelligent, volatility-aware tools that adapt to market conditions while maintaining a consistent upward bias for clear directional guidance.
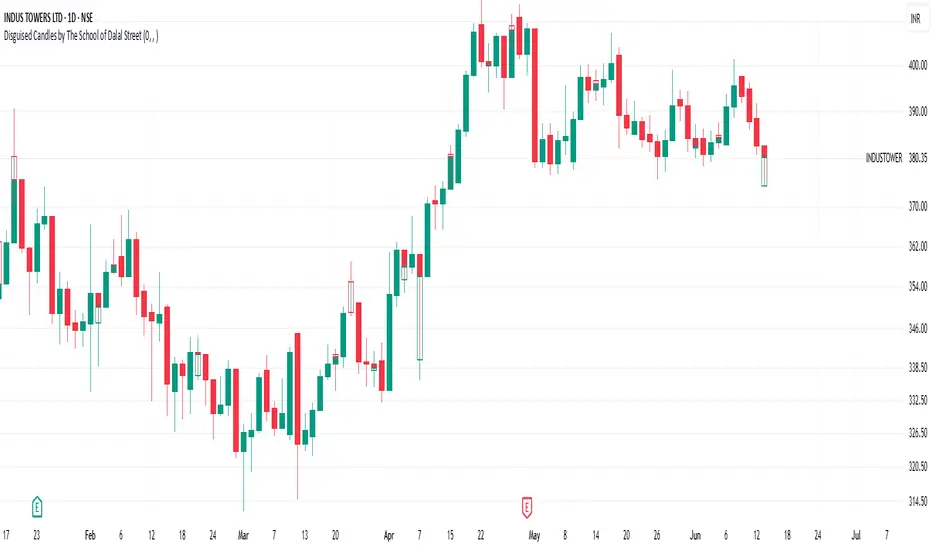
Disguised Candles by The School of Dalal StreetDisguised Candles corrects one of the subtle visual distortions present in normal candlestick charts — the mismatch between the close of one candle and the open of the next.
On many instruments (especially at day/session breaks), the next candle’s open often jumps due to price gaps or data feed behavior. This can make reading the flow of price action harder than necessary.
Disguised Candles fixes this by plotting synthetic candles where the open of each candle is forced to match the close of the previous one — creating a visually continuous flow of price.
Real candles are made fully transparent, so only the "corrected" candles are visible.
This allows traders to:
Visualize price flow as a smooth path
Better spot true directional shifts and trends
Avoid distractions caused by technical gaps that are not meaningful to their strategy
🚀 Pure visual clarity. No noise from false opens.
How it works:
The open of each synthetic candle = close of previous real candle
High, Low, Close remain unchanged
Colors are based on Close vs Corrected Open
Real chart candles are hidden under a transparent overlay
Use this as a clean canvas for trend analysis or as a foundation for building new visual systems.
Position Size Calculator ProPosition Size Calculator Pro is a professional risk management tool that helps traders calculate optimal position sizes based on their account size, risk tolerance, and trade setup. The indicator provides real-time calculations with interactive price lines and a comprehensive horizontal table display for quick decision-making.
✨ Key Features
Multiple Entry Modes: Current price, manual price, or interactive buy line
Flexible Stop Loss Options: LOD (Low of Day), manual price, percentage-based, or interactive stop line
Advanced Risk Calculations: Includes brokerage impact and adjusted risk metrics
Interactive Price Lines: Visual buy and stop loss lines with real-time updates
Horizontal Table Display: Compact 2-row table showing all critical metrics
Smart Color Coding: Visual feedback based on risk and allocation levels
Professional UI: Clean, modern interface with intuitive controls
Indian Market Ready: Optimized for Indian trading with ₹ currency display
🔧 Input Parameters
💰 Risk Management
Account Size (₹): Total trading capital (default: 10,00,000)
Risk per Trade (%): Maximum risk percentage per trade (default: 0.25%, range: 0.01-5%)
Brokerage (%): Combined buy and sell brokerage (default: 0.12%, range: 0-2%)
📊 Entry & Stop Loss
Entry Mode: Choose between Current Price, Manual Price, or Buy Line
Manual Entry Price: Custom entry price (when Manual Price selected)
Stop Loss Mode: LOD SL, Manual SL, Manual SL %, or SL Line
Manual Stop Loss: Custom stop loss price
SL Percentage (%): Percentage below entry for stop loss (default: 2%, range: 0.1-20%)
📈 Interactive Lines
Buy Line Price: Interactive buy line (click on chart to set)
Stop Loss Line: Interactive stop loss line (click on chart to set)
Show Lines: Toggle line visibility
🎨 Display Options
Show Table: Toggle calculation table visibility
Table Size: Adjustable from tiny to huge
Position: Top, middle, or bottom placement
Alignment: Left, center, or right alignment
Update Frequency: Real-time or bar close
📊 Calculation Methodology
Position Size Formula
Position Size = (Account Size × Risk %) ÷ (Adjusted Risk per Share)
Risk Calculations
Base Risk: |(Entry Price - Stop Loss)| ÷ Entry Price × 100
Adjusted Risk: Includes brokerage impact on both entry and exit
Risk Amount: Position Size × Base Risk per Share
Brokerage Impact
Entry with Brokerage: Entry Price × (1 + Brokerage% ÷ 200)
Exit with Brokerage: Stop Loss × (1 - Brokerage% ÷ 200)
🎮 How to Use
Basic Setup
Set your account size and risk percentage
Configure brokerage percentage according to your broker
Choose entry and stop loss modes
The calculator automatically updates position size
Interactive Lines Setup
⚠️ IMPORTANT: After selecting line modes, refresh the chart to ensure lines are visible
For Buy Line:
Select Entry Mode: "Buy Line"
Set "Buy Line Price" or leave 0 for current price
Refresh chart to see the green buy line
Adjust price by clicking on chart or changing input value
For Stop Loss Line:
Select Stop Loss Mode: "SL Line"
Set "Stop Loss Line" or leave 0 for current low
Refresh chart to see the red stop loss line
Adjust price by clicking on chart or changing input value
Table Information
The horizontal calculation table displays:
SL: Stop Loss price
Entry: Entry price level
Risk%: Adjusted risk percentage (with brokerage)
SL%: Base stop loss risk percentage
Cap%: Account risk percentage setting
Qty: Recommended quantity to buy
Investment: Total investment amount required
Alloc%: Portfolio allocation percentage
Risk ₹: Total risk amount in Rupees
Color Coding Guide
Green Values: Positive/profitable metrics
Red Values: Risk/loss related metrics
Orange Values: Warning levels (high risk/allocation)
Blue Headers: Table headers
Bright Green Line: Buy line with target icon
Bright Red Line: Stop loss line with shield icon
🚨 Alert Conditions
Built-in Alerts
High Allocation Warning: Triggers when position exceeds 20% of account
High Risk Warning: Triggers when stop loss risk exceeds 5%
Invalid Position: Triggers when calculation parameters are invalid
Setting Up Alerts
Click "Add Alert" on the chart
Select "Position Size Calculator Pro"
Choose desired alert condition
Configure notification settings
⚠️ Important Notes & Troubleshooting
Interactive Lines
Lines not visible? Refresh the chart after selecting line modes
Lines moving together? Each line operates independently - check you're adjusting the correct price input
Default behavior: Buy line starts at current price, Stop line starts at current low
Price = 0: Uses automatic defaults (current price/low)
Risk Disclaimers
This tool is for educational purposes only
Always verify calculations independently
Consider market conditions, gaps, and liquidity
Past performance doesn't guarantee future results
Technical Limitations
Interactive lines require chart refresh for initial visibility
Calculations update based on selected frequency
Maximum 10 lines and 10 labels on chart simultaneously
Best Practices
Always set realistic account size
Never risk more than you can afford to lose
Consider slippage and market gaps in volatile conditions
Review calculations before placing actual trades
Use appropriate position sizing for your trading strategy
Refresh chart when switching between line modes
🛠️ Technical Requirements
TradingView account (any tier)
Pine Script v6 compatibility
Modern browser for interactive features
Real-time or delayed data feed
📈 Performance Features
The script includes several optimizations:
Efficient calculation updates based on frequency setting
Smart memory management for line drawings
Conditional table updates to reduce resource usage
Optimized number formatting for better readability
🎯 Use Cases
Day Trading
Quick position sizing for intraday setups
Real-time risk assessment
Interactive line placement for entry/exit planning
Swing Trading
Portfolio allocation management
Multi-timeframe risk analysis
Position size optimization for longer holds
Investment Planning
Capital allocation for stock purchases
Risk-based position sizing
Long-term portfolio management
Disclaimer: This tool is for educational and informational purposes only. Trading involves substantial risk of loss and is not suitable for all investors. Always conduct your own research and consider seeking advice from qualified financial professionals.

FvgCalculations█ OVERVIEW
This library provides the core calculation engine for identifying Fair Value Gaps (FVGs) across different timeframes and for processing their interaction with price. It includes functions to detect FVGs on both the current chart and higher timeframes, as well as to check for their full or partial mitigation.
█ CONCEPTS
The library's primary functions revolve around the concept of Fair Value Gaps and their lifecycle.
Fair Value Gap (FVG) Identification
An FVG, or imbalance, represents a price range where buying or selling pressure was significant enough to cause a rapid price movement, leaving an "inefficiency" in the market. This library identifies FVGs based on three-bar patterns:
Bullish FVG: Forms when the low of the current bar (bar 3) is higher than the high of the bar two periods prior (bar 1). The FVG is the space between the high of bar 1 and the low of bar 3.
Bearish FVG: Forms when the high of the current bar (bar 3) is lower than the low of the bar two periods prior (bar 1). The FVG is the space between the low of bar 1 and the high of bar 3.
The library provides distinct functions for detecting FVGs on the current (Low Timeframe - LTF) and specified higher timeframes (Medium Timeframe - MTF / High Timeframe - HTF).
FVG Mitigation
Mitigation refers to price revisiting an FVG.
Full Mitigation: An FVG is considered fully mitigated when price completely closes the gap. For a bullish FVG, this occurs if the current low price moves below or touches the FVG's bottom. For a bearish FVG, it occurs if the current high price moves above or touches the FVG's top.
Partial Mitigation (Entry/Fill): An FVG is partially mitigated when price enters the FVG's range but does not fully close it. The library tracks the extent of this fill. For a bullish FVG, if the current low price enters the FVG from above, that low becomes the new effective top of the remaining FVG. For a bearish FVG, if the current high price enters the FVG from below, that high becomes the new effective bottom of the remaining FVG.
FVG Interaction
This refers to any instance where the current bar's price range (high to low) touches or crosses into the currently unfilled portion of an active (visible and not fully mitigated) FVG.
Multi-Timeframe Data Acquisition
To detect FVGs on higher timeframes, specific historical bar data (high, low, and time of bars at indices and relative to the higher timeframe's last completed bar) is required. The requestMultiTFBarData function is designed to fetch this data efficiently.
█ CALCULATIONS AND USE
The functions in this library are typically used in a sequence to manage FVGs:
1. Data Retrieval (for MTF/HTF FVGs):
Call requestMultiTFBarData() with the desired higher timeframe string (e.g., "60", "D").
This returns a tuple of htfHigh1, htfLow1, htfTime1, htfHigh3, htfLow3, htfTime3.
2. FVG Detection:
For LTF FVGs: Call detectFvg() on each confirmed bar. It uses high , low, low , and high along with barstate.isconfirmed.
For MTF/HTF FVGs: Call detectMultiTFFvg() using the data obtained from requestMultiTFBarData().
Both detection functions return an fvgObject (defined in FvgTypes) if an FVG is found, otherwise na. They also can classify FVGs as "Large Volume" (LV) if classifyLV is true and the FVG size (top - bottom) relative to the tfAtr (Average True Range of the respective timeframe) meets the lvAtrMultiplier.
3. FVG State Updates (on each new bar for existing FVGs):
First, check for overall price interaction using fvgInteractionCheck(). This function determines if the current bar's high/low has touched or entered the FVG's currentTop or currentBottom.
If interaction occurs and the FVG is not already mitigated:
Call checkMitigation() to determine if the FVG has been fully mitigated by the current bar's currentHigh and currentLow. If true, the FVG's isMitigated status is updated.
If not fully mitigated, call checkPartialMitigation() to see if the price has further entered the FVG. This function returns the newLevel to which the FVG has been filled (e.g., currentLow for a bullish FVG, currentHigh for bearish). This newLevel is then used to update the FVG's currentTop or currentBottom.
The calling script (e.g., fvgMain.c) is responsible for storing and managing the array of fvgObject instances and passing them to these update functions.
█ NOTES
Bar State for LTF Detection: The detectFvg() function relies on barstate.isconfirmed to ensure FVG detection is based on closed bars, preventing FVGs from being detected prematurely on the currently forming bar.
Higher Timeframe Data (lookahead): The requestMultiTFBarData() function uses lookahead = barmerge.lookahead_on. This means it can access historical data from the higher timeframe that corresponds to the current bar on the chart, even if the higher timeframe bar has not officially closed. This is standard for multi-timeframe analysis aiming to plot historical HTF data accurately on a lower timeframe chart.
Parameter Typing: Functions like detectMultiTFFvg and detectFvg infer the type for boolean (classifyLV) and numeric (lvAtrMultiplier) parameters passed from the main script, while explicitly typed series parameters (like htfHigh1, currentAtr) expect series data.
fvgObject Dependency: The FVG detection functions return fvgObject instances, and fvgInteractionCheck takes an fvgObject as a parameter. This UDT is defined in the FvgTypes library, making it a dependency for using FvgCalculations.
ATR for LV Classification: The tfAtr (for MTF/HTF) and currentAtr (for LTF) parameters are expected to be the Average True Range values for the respective timeframes. These are used, if classifyLV is enabled, to determine if an FVG's size qualifies it as a "Large Volume" FVG based on the lvAtrMultiplier.
MTF/HTF FVG Appearance Timing: When displaying FVGs from a higher timeframe (MTF/HTF) on a lower timeframe (LTF) chart, users might observe that the most recent MTF/HTF FVG appears one LTF bar later compared to its appearance on a native MTF/HTF chart. This is an expected behavior due to the detection mechanism in `detectMultiTFFvg`. This function uses historical bar data from the MTF/HTF (specifically, data equivalent to `HTF_bar ` and `HTF_bar `) to identify an FVG. Therefore, all three bars forming the FVG on the MTF/HTF must be fully closed and have shifted into these historical index positions relative to the `request.security` call from the LTF chart before the FVG can be detected and displayed on the LTF. This ensures that the MTF/HTF FVG is identified based on confirmed, closed bars from the higher timeframe.
█ EXPORTED FUNCTIONS
requestMultiTFBarData(timeframe)
Requests historical bar data for specific previous bars from a specified higher timeframe.
It fetches H , L , T (for the bar before last) and H , L , T (for the bar three periods prior)
from the requested timeframe.
This is typically used to identify FVG patterns on MTF/HTF.
Parameters:
timeframe (simple string) : The higher timeframe to request data from (e.g., "60" for 1-hour, "D" for Daily).
Returns: A tuple containing: .
- htfHigh1 (series float): High of the bar at index 1 (one bar before the last completed bar on timeframe).
- htfLow1 (series float): Low of the bar at index 1.
- htfTime1 (series int) : Time of the bar at index 1.
- htfHigh3 (series float): High of the bar at index 3 (three bars before the last completed bar on timeframe).
- htfLow3 (series float): Low of the bar at index 3.
- htfTime3 (series int) : Time of the bar at index 3.
detectMultiTFFvg(htfHigh1, htfLow1, htfTime1, htfHigh3, htfLow3, htfTime3, tfAtr, classifyLV, lvAtrMultiplier, tfType)
Detects a Fair Value Gap (FVG) on a higher timeframe (MTF/HTF) using pre-fetched bar data.
Parameters:
htfHigh1 (float) : High of the first relevant bar (typically high ) from the higher timeframe.
htfLow1 (float) : Low of the first relevant bar (typically low ) from the higher timeframe.
htfTime1 (int) : Time of the first relevant bar (typically time ) from the higher timeframe.
htfHigh3 (float) : High of the third relevant bar (typically high ) from the higher timeframe.
htfLow3 (float) : Low of the third relevant bar (typically low ) from the higher timeframe.
htfTime3 (int) : Time of the third relevant bar (typically time ) from the higher timeframe.
tfAtr (float) : ATR value for the higher timeframe, used for Large Volume (LV) FVG classification.
classifyLV (bool) : If true, FVGs will be assessed to see if they qualify as Large Volume.
lvAtrMultiplier (float) : The ATR multiplier used to define if an FVG is Large Volume.
tfType (series tfType enum from no1x/FvgTypes/1) : The timeframe type (e.g., types.tfType.MTF, types.tfType.HTF) of the FVG being detected.
Returns: An fvgObject instance if an FVG is detected, otherwise na.
detectFvg(classifyLV, lvAtrMultiplier, currentAtr)
Detects a Fair Value Gap (FVG) on the current (LTF - Low Timeframe) chart.
Parameters:
classifyLV (bool) : If true, FVGs will be assessed to see if they qualify as Large Volume.
lvAtrMultiplier (float) : The ATR multiplier used to define if an FVG is Large Volume.
currentAtr (float) : ATR value for the current timeframe, used for LV FVG classification.
Returns: An fvgObject instance if an FVG is detected, otherwise na.
checkMitigation(isBullish, fvgTop, fvgBottom, currentHigh, currentLow)
Checks if an FVG has been fully mitigated by the current bar's price action.
Parameters:
isBullish (bool) : True if the FVG being checked is bullish, false if bearish.
fvgTop (float) : The top price level of the FVG.
fvgBottom (float) : The bottom price level of the FVG.
currentHigh (float) : The high price of the current bar.
currentLow (float) : The low price of the current bar.
Returns: True if the FVG is considered fully mitigated, false otherwise.
checkPartialMitigation(isBullish, currentBoxTop, currentBoxBottom, currentHigh, currentLow)
Checks for partial mitigation of an FVG by the current bar's price action.
It determines if the price has entered the FVG and returns the new fill level.
Parameters:
isBullish (bool) : True if the FVG being checked is bullish, false if bearish.
currentBoxTop (float) : The current top of the FVG box (this might have been adjusted by previous partial fills).
currentBoxBottom (float) : The current bottom of the FVG box (similarly, might be adjusted).
currentHigh (float) : The high price of the current bar.
currentLow (float) : The low price of the current bar.
Returns: The new price level to which the FVG has been filled (e.g., currentLow for a bullish FVG).
Returns na if no new partial fill occurred on this bar.
fvgInteractionCheck(fvg, highVal, lowVal)
Checks if the current bar's price interacts with the given FVG.
Interaction means the price touches or crosses into the FVG's
current (possibly partially filled) range.
Parameters:
fvg (fvgObject type from no1x/FvgTypes/1) : The FVG object to check.
Its isMitigated, isVisible, isBullish, currentTop, and currentBottom fields are used.
highVal (float) : The high price of the current bar.
lowVal (float) : The low price of the current bar.
Returns: True if price interacts with the FVG, false otherwise.

FVG (Nephew sam remake)Hello i am making my own FVG script inspired by Nephew Sam as his fvg code is not open source. My goal is to replicate his Script and then add in alerts and more functions. Thus, i spent few days trying to code. There is bugs such as lower time frame not showing higher time frame FVG.
This script automatically detects and visualizes Fair Value Gaps (FVGs) — imbalances between demand and supply — across multiple timeframes (15-minute, 1-hour, and 4-hour).
15m chart shows:
15m FVGs (green/red boxes)
1H FVGs (lime/maroon)
4H FVGs (faded green/red with borders) (Bugged For now i only see 1H appearing)
1H chart shows:
1H FVGs
4H FVGs
4H chart shows:
4H FVGs only
There is the function to auto close FVG when a future candle fully disrespected it.
You're welcome to:
🔧 Customize the appearance: adjust box colors, transparency, border style
🧪 Add alerts: e.g., when price enters or fills a gap
📅 Expand to Daily/Weekly: just copy the logic and plug in "D" or "W" as new layers
📈 Build confluence logic: combine this with order blocks, liquidity zones, or ICT concepts
🧠 Experiment with entry signals: e.g., candle confirmation on return to FVG
🚀 Improve performance: if you find a lighter way to track gaps, feel free to optimize!

CandelaCharts - Turtle Soup Model📝 Overview
The ICT Turtle Soup Model indicator is a precision-engineered tool designed to identify high-probability reversal setups based on ICT’s renowned Turtle Soup strategy.
The Turtle Soup Model is a classic reversal setup that exploits false breakouts beyond previous swing highs or lows. It targets areas where retail traders are trapped into breakout trades, only for the price to reverse sharply in the opposite direction.
Price briefly breaks a previous high (for short setups) or low (for long setups), triggering stop orders and pulling in breakout traders. Once that liquidity is taken, smart money reverses price back inside the range, creating a high-probability fade setup.
📦 Features
Liquidity Levels: Projects forward-looking liquidity levels after a Turtle Soup model is formed, highlighting potential price targets. These projected zones act as magnet levels—areas where price is likely to reach based on the liquidity draw narrative. This allows traders to manage exits and partials with more precision.
Market Structure Shift (MSS): Confirms reversal strength by detecting a bullish or bearish MSS after a sweep. Acts as a secondary confirmation to filter out weak setups.
Custom TF Pairing: Choose your own combination of entry timeframe and context timeframe. For example, trade 5m setups inside a 1h HTF bias — perfect for aligning microstructure with macro intent.
HTF & LTF PD Arrays: Displays HTF PD Arrays (e.g., Fair Value Gaps, Inversion Fair Value Gaps) to serve as confluence zones.
History: Review and backtest past Turtle Soup setups directly on the chart. Toggle historical models on/off to study model behavior across different market conditions.
Killzone Filter: Limit signals to specific trading sessions or time blocks (e.g., New York AM, London, Asia, etc). Avoid signals in low-liquidity or choppy environments.
Standard Deviation: Calculates and projects four levels of standard deviation from the point of model confirmation. These zones help identify overextended moves, mean-reversion opportunities, and confluence with liquidity or PD arrays.
Dashboard: The dashboard displays the active model type, remaining time of the HTF candle, current bias, asset name, and date—providing real-time context and signal clarity at a glance.
⚙️ Settings
Core
Status: Filter models based on status
Bias: Controls what model type will be displayed, bullish or bearish
Fractal: Controls the timeframe pairing that will be used
High Probability Models: Detects and plots only the high-probability models
Sweeps
Sweep: Shows the sweep that forms a model
I-sweep: Controls the visibility of invalidated sweeps
D-purge: Plots the double purge sweeps
S-area: Highlights the sweep area
Liquidity
Liquidity: Displays the liquidity levels that belong to the model
MSS
MSS: Displays the Market Structure Shift for a model
History
History: Controls the number of past models displayed on the chart
Filters
Asia: Filter models based on Asia Killzone hours
London: Filter models based on London Killzone hours
NY AM: Filter models based on NY AM Killzone hours
NY Launch: Filter models based on NY Launch Killzone hours
NY PM: Filter models based on NY PM Killzone hours
Custom: Filter models based on user Custom hours
HTF
Candles: Controls the number of HTF candles that will be visible on the chart
Candles T: Displays the model’s third timeframe candle, which serves as a confirmation of directional bias
NY Open: Display True Day Open line
Offset: Controls the distance of HTF from the current chart
Space: Controls the space between HTF candles
Size: Controls the size of HTF candles
PD Array: Displays ICT PD Arrays
CE Line: Style the equilibrium line of PD Array
Border: Style the border of the PD Array
LTF
H/L Line: Displays on the LTF chart the High and Low of each HTF candle
O/C Line: Displays on the LTF chart the Open and Close of each HTF candle
PD Array: Displays ICT PD Arrays
CE Line: Style the equilibrium line of PD Array
Border: Style the border of the PD Array
Standard Deviation
StDev: Controls standard deviation of available levels
Labels: Controls the size of standard deviation levels
Lines: Controls the line widths and color of standard deviation levels
Dashboard
Panel: Display information about the current model
💡 Framework
The Turtle Soup Model is designed to detect and interpret false breakout patterns by analyzing key price action components, each playing a vital role in identifying liquidity traps and generating actionable reversal signals.
The model incorporates the following timeframe pairing:
15s - 5m - 15m
1m - 5m - 1H
2m - 15m - 2H
3m - 30m - 3H
5m - 60m - 4H
15m - 1H - 8H
30m - 3H - 12H
1H - 4H - 1D
4H - 1D - 1W
1D - 1W - 1M
1W - 1M - 6M
1M - 6M - 12M
Below are the key components that make up the model:
Sweep
D-purge
MSS
Liquidity
Standard Deviation
HTF & LTF PD Arrays
The Turtle Soup Model operates through a defined lifecycle that identifies its current state and determines the validity of a trade opportunity.
The model's lifecycle includes the following statuses:
Formation (grey)
Invalidation (red)
Pre-Invalidation (purple)
Success (green)
By incorporating the phases of Formation, Invalidation, and Success, traders can effectively manage risk, optimize position handling, and capitalize on the high-probability opportunities presented by the Turtle Soup Model.
⚡️ Showcase
Introducing the Turtle Soup Model — a powerful trading tool engineered to detect high-probability false breakout reversals. This indicator helps you pinpoint liquidity sweeps, confirm market structure shifts, and identify precise entry and exit points, enabling more confident, informed, and timely trading decisions.
LTF PD Array
LTF PD Arrays are essential for model formation—a valid Turtle Soup setup will only trigger if a qualifying LTF PD Array is present near the sweep zone.
HTF PD Array
HTF PD Arrays provide macro-level context and are used to validate the direction and strength of the potential reversal.
Timeframe Alignment
In the Turtle Soup trading model, timeframe alignment is an essential structural component. The model relies on multi-timeframe context to identify high-probability reversal setups based on failed breakouts.
High-Probability Model
A high-probability setup forms when key elements align: a Sweep, Market Structure Shift (MSS), LTF and HTF PD Arrays.
Killzone Filters
Filter Turtle Soup Models based on key market sessions: Asia, London, New York AM, New York Launch, and New York PM . This allows you to focus on high-liquidity periods where smart money activity is most likely to occur, improving both the quality and timing of your trade setups.
Unlock your trading edge with the Turtle Soup Model — your go-to tool for sharper insights, smarter decisions, and more confident execution in the markets.
🚨 Alerts
This script offers alert options for all model types. The alerts need to be set up manually from TradingView.
Bearish Model
A bearish model alert is triggered when a model forms, signaling a high sweep, MS,S and LTF PD Array.
Bullish Model
A bullish model alert is triggered when a model forms, signaling a low sweep, MSS and LTF PD Array.
⚠️ Disclaimer
These tools are exclusively available on the TradingView platform.
Our charting tools are intended solely for informational and educational purposes and should not be regarded as financial, investment, or trading advice. They are not designed to predict market movements or offer specific recommendations. Users should be aware that past performance is not indicative of future results and should not rely on these tools for financial decisions. By using these charting tools, the purchaser agrees that the seller and creator hold no responsibility for any decisions made based on information provided by the tools. The purchaser assumes full responsibility and liability for any actions taken and their consequences, including potential financial losses or investment outcomes that may result from the use of these products.
By purchasing, the customer acknowledges and accepts that neither the seller nor the creator is liable for any undesired outcomes stemming from the development, sale, or use of these products. Additionally, the purchaser agrees to indemnify the seller from any liability. If invited through the Friends and Family Program, the purchaser understands that any provided discount code applies only to the initial purchase of Candela's subscription. The purchaser is responsible for canceling or requesting cancellation of their subscription if they choose not to continue at the full retail price. In the event the purchaser no longer wishes to use the products, they must unsubscribe from the membership service, if applicable.
We do not offer reimbursements, refunds, or chargebacks. Once these Terms are accepted at the time of purchase, no reimbursements, refunds, or chargebacks will be issued under any circumstances.
By continuing to use these charting tools, the user confirms their understanding and acceptance of these Terms as outlined in this disclaimer.

FVG Candle HighlighterThis indicator highlights only the true Fair Value Gap (FVG) creator candle — the middle candle in a 3-bar FVG formation — with zero clutter.
🔹 Bullish FVG: Candle is colored if price gaps above the high two bars back
🔹 Bearish FVG: Candle is colored if price gaps below the low two bars back
✨ No boxes. No zones. Just pure, visual price-action accuracy.
🔧 Powered by Pine Script v6
🧠 Based on institutional-style FVG logic
🎯 Ideal for Smart Money / ICT / Order Block strategies

UT Bot + Cooldown + Visual FVGSynopsis – UT Bot + Cooldown + Visual FVG
This TradingView script combines:
✅ UT Bot Reversal Signals
Based on ATR and volatility logic
BUY when trend flips from bearish to bullish
SELL when trend flips from bullish to bearish
✅ Cooldown Filter
Limits signals to 1 per X bars (default 30)
Prevents overtrading during choppy price action
✅ Optional FVG Markers (Fair Value Gaps)
Visually shows bullish or bearish imbalances (3-bar gaps)
Does not affect signal generation — only for confluence
🔍 Ideal for traders who want clean, time-filtered signals with visual price-action context. Suitable for futures, crypto, or forex on intraday charts.

Balanced Price Range | Flux Charts💎 GENERAL OVERVIEW
Introducing our new Balanced Price Range (BPR) indicator! A Balanced Price Range is a trading concept used by price action traders. It is detected by finding overlapping area between two contrary Fair Value Gaps (FVGs). These areas can be used as entry points during market pullbacks. For more information about the process, please check the "HOW DOES IT WORK ?" section.
Balanced Price Range Features :
Balanced Price Range Detection : Identifies areas where bullish and bearish FVGs overlap, suggesting a zone of price equilibrium.
Customizable FVG & BPR Detection : You can fine-tune FVG detection and sensitivity for BPR detection to your liking.
Retest Labels : Bullish & Bearish retest labels will be rendered for BPRs.
Alerts : You can set alerts for Bullish & Bearish BPR detection and their retests.
🚩 UNIQUENESS
This indicator doesn't just detect standard FVGs but specifically looks for areas where bullish and bearish IFVGs (Invalidated Fair Value Gaps) overlap, defining a Balanced Price Range. It also actively manages and updates identified BPR zones, removing them when they are invalidated or remain untouched for a specified period. It highlights and alerts users to retests of established BPR zones, signaling potential trading opportunities. Users can tailor the appearance of the BPR zones and retest markers, as well as configure specific alerts for new BPR formations and retests.
📌 HOW DOES IT WORK ?
A Fair Value Gap generally occur when there is an imbalance in the market. They can be detected by specific formations within the chart. The indicator first detects bullish & bearish FVG zones according to their formations on chart. Then, they are dynamically tracked and flagged as invalidated if the price crosses them, turning them into IFVGs. When a FVG & IFVG of the same type overlaps, the indicator combines them into a single BPR of corresponding type. The detected BPR is updated as new data comes in, and renders retests labels as they occur. A bullish BPR can be used to find long trade entry opportunities, while a bearish BPR can be used to find short trade entry opportunities. Retests can also indicate potential movements in the corresponding direction of the BPR. Users can set-up alerts for BPR detection & BPR retests and will get notified as they occur.
⚙️ SETTINGS
Show Historic Zones: If enabled, invalidated or expired BPR zones will remain visible on the chart.
Balanced Price Range:
FVG Detection Method: Determines the criteria for the bar types forming the initial FVG.
Same: All three bars forming the FVG must be of the same type (all bullish or all bearish).
Mixed: The bar types must vary (a mix of bullish and bearish bars).
All: Bar types can vary or be the same.
FVG Invalidation Method: Determines which part of the candle (wick or close) invalidates the initial FVG.
BPR Invalidation Method: Determines which part of the candle (wick or close) invalidates the Balanced Price Range.
Sensitivity: Adjusts the sensitivity of FVG detection. Higher values may identify fewer, larger BPRs, while lower values may detect more, smaller BPRs.
Labels: Toggles the display of text labels on the identified zones.
Retests: Enables or disables the detection and visualization of BPR retests.

Higher Timeframe Candles (Dynamic Display)Key Features:
1. Higher Timeframe Candles Visualization:
Displays up to 5 candles from a user-selected higher timeframe (e.g., 15-minute, hourly).
Each candle includes:
Body (open-close range) and wicks (high-low range).
Customizable appearance settings for width, colors, and transparency.
2. Horizontal Price Levels:
Calculates and plots important levels based on the higher timeframe candles:
Max High: Highest price among the displayed candles.
Min Low: Lowest price among the displayed candles.
Midpoint: The midpoint between Max High and Min Low.
Quarter Points: 25% and 75% levels within the Max-Min range.
Each level's line appearance (color, width, style) can be customized, and price labels can be displayed.
3. Fair Value Gaps (FVG):
Detects bullish and bearish fair value gaps (FVGs) based on three consecutive candles:
Bullish FVG: Middle candle's low is higher than the previous candle's high.
Bearish FVG: Middle candle's high is lower than the previous candle's low.
Highlights FVGs with colored boxes and optional labels showing gap height.
4. Inside/Outside Bar Detection:
Identifies inside bars (current candle is entirely within the previous candle) and outside bars (current candle exceeds the previous candle's range).
Labels these patterns above the candles for easy identification.
5. Alerts for Key Levels:
Alerts are triggered when the current price crosses:
Max High
Min Low
Midpoint
Alerts help traders act without monitoring the chart constantly.
6. Customization Options:
Fully customizable input options for candles, levels, FVGs, and labels:
Appearance settings: Colors, widths, styles, transparency.
Toggle visibility for specific features (e.g., FVGs, labels, quarter points).
Label precision and positioning.

ICT iFVG Detector and Alert [by ote618]Description
This script detects ICT - fair value gaps (FVG) formed by price gaps between Candle 1 and Candle 3, then monitors the next 5 candles for an inverse fair value gap (iFVG).
What It Detects
Bullish FVG: When Candle 1 high is below Candle 3 low (BISI)
Bearish FVG: When Candle 1 low is above Candle 3 high (SIBI)
Once an FVG is detected, the script checks the next 5 candles:
A Bullish FVG becomes a Bearish IFVG if price closes below Candle 1 high
A Bearish FVG becomes a Bullish IFVG if price closes above Candle 1 low
Only the first bar that validates the FVG triggers the transition to an IFVG.
Visual Output
A shaded rectangle is plotted to mark the original FVG zone (from Candle 1 to Candle 3)
Color-coded:
Red for Bearish IFVG (validated Bullish IG)
Green for Bullish IFVG (validated Bearish IG)
The rectangle extends from Candle 1 to the validating bar
Alerts
You can receive alerts when an FVG becomes an IFVG:
Configurable to fire only on selected timeframes (1m, 5m, 15m, 60m)
Alerts include the direction and the chart timeframe
Settings
Enable Alerts For Timeframe: Choose which timeframe(s) trigger alerts
This tool helps traders identify inverse FVGs (iFVG), a useful ICT concept.

AllCandlestickPatternsLibraryAll Candlestick Patterns Library
The Candlestick Patterns Library is a Pine Script (version 6) library extracted from the All Candlestick Patterns indicator. It provides a comprehensive set of functions to calculate candlestick properties, detect market trends, and identify various candlestick patterns (bullish, bearish, and neutral). The library is designed for reusability, enabling TradingView users to incorporate pattern detection into their own scripts, such as indicators or strategies.
The library is organized into three main sections:
Trend Detection: Functions to determine market trends (uptrend or downtrend) based on user-defined rules.
Candlestick Property Calculations: A function to compute core properties of a candlestick, such as body size, shadow lengths, and doji characteristics.
Candlestick Pattern Detection: Functions to detect specific candlestick patterns, each returning a tuple with detection status, pattern name, type, and description.
Library Structure
1. Trend Detection
This section includes the detectTrend function, which identifies whether the market is in an uptrend or downtrend based on user-specified rules, such as the relationship between the closing price and Simple Moving Averages (SMAs).
Function: detectTrend
Parameters:
downTrend (bool): Initial downtrend condition.
upTrend (bool): Initial uptrend condition.
trendRule (string): The rule for trend detection ("SMA50" or "SMA50, SMA200").
p_close (float): Current closing price.
sma50 (float): Simple Moving Average over 50 periods.
sma200 (float): Simple Moving Average over 200 periods.
Returns: A tuple indicating the detected trend.
Logic:
If trendRule is "SMA50", a downtrend is detected when p_close < sma50, and an uptrend when p_close > sma50.
If trendRule is "SMA50, SMA200", a downtrend is detected when p_close < sma50 and sma50 < sma200, and an uptrend when p_close > sma50 and sma50 > sma200.
2. Candlestick Property Calculations
This section includes the calculateCandleProperties function, which computes essential properties of a candlestick based on OHLC (Open, High, Low, Close) data and configuration parameters.
Function: calculateCandleProperties
Parameters:
p_open (float): Candlestick open price.
p_close (float): Candlestick close price.
p_high (float): Candlestick high price.
p_low (float): Candlestick low price.
bodyAvg (float): Average body size (e.g., from EMA of body sizes).
shadowPercent (float): Minimum shadow size as a percentage of body size.
shadowEqualsPercent (float): Tolerance for equal shadows in doji detection.
dojiBodyPercent (float): Maximum body size as a percentage of range for doji detection.
Returns: A tuple containing 17 properties:
C_BodyHi (float): Higher of open or close price.
C_BodyLo (float): Lower of open or close price.
C_Body (float): Body size (difference between C_BodyHi and C_BodyLo).
C_SmallBody (bool): True if body size is below bodyAvg.
C_LongBody (bool): True if body size is above bodyAvg.
C_UpShadow (float): Upper shadow length (p_high - C_BodyHi).
C_DnShadow (float): Lower shadow length (C_BodyLo - p_low).
C_HasUpShadow (bool): True if upper shadow exceeds shadowPercent of body.
C_HasDnShadow (bool): True if lower shadow exceeds shadowPercent of body.
C_WhiteBody (bool): True if candle is bullish (p_open < p_close).
C_BlackBody (bool): True if candle is bearish (p_open > p_close).
C_Range (float): Candlestick range (p_high - p_low).
C_IsInsideBar (bool): True if current candle body is inside the previous candle's body.
C_BodyMiddle (float): Midpoint of the candle body.
C_ShadowEquals (bool): True if upper and lower shadows are equal within shadowEqualsPercent.
C_IsDojiBody (bool): True if body size is small relative to range (C_Body <= C_Range * dojiBodyPercent / 100).
C_Doji (bool): True if the candle is a doji (C_IsDojiBody and C_ShadowEquals).
Purpose: These properties are used by pattern detection functions to evaluate candlestick formations.
3. Candlestick Pattern Detection
This section contains functions to detect specific candlestick patterns, each returning a tuple . The patterns are categorized as bullish, bearish, or neutral, and include detailed descriptions for use in tooltips or alerts.
Supported Patterns
The library supports the following candlestick patterns, grouped by type:
Bullish Patterns:
Rising Window: A two-candle continuation pattern in an uptrend with a price gap between the first candle's high and the second candle's low.
Rising Three Methods: A five-candle continuation pattern with a long green candle, three short red candles, and another long green candle.
Tweezer Bottom: A two-candle reversal pattern in a downtrend with nearly identical lows.
Upside Tasuki Gap: A three-candle continuation pattern in an uptrend with a gap between the first two green candles and a red candle closing partially into the gap.
Doji Star (Bullish): A two-candle reversal pattern in a downtrend with a long red candle followed by a doji gapping down.
Morning Doji Star: A three-candle reversal pattern with a long red candle, a doji gapping down, and a long green candle.
Piercing: A two-candle reversal pattern in a downtrend with a red candle followed by a green candle closing above the midpoint of the first.
Hammer: A single-candle reversal pattern in a downtrend with a small body and a long lower shadow.
Inverted Hammer: A single-candle reversal pattern in a downtrend with a small body and a long upper shadow.
Morning Star: A three-candle reversal pattern with a long red candle, a short candle gapping down, and a long green candle.
Marubozu White: A single-candle pattern with a long green body and minimal shadows.
Dragonfly Doji: A single-candle reversal pattern in a downtrend with a doji where open and close are at the high.
Harami Cross (Bullish): A two-candle reversal pattern in a downtrend with a long red candle followed by a doji inside its body.
Harami (Bullish): A two-candle reversal pattern in a downtrend with a long red candle followed by a small green candle inside its body.
Long Lower Shadow: A single-candle pattern with a long lower shadow indicating buyer strength.
Three White Soldiers: A three-candle reversal pattern with three long green candles in a downtrend.
Engulfing (Bullish): A two-candle reversal pattern in a downtrend with a small red candle followed by a larger green candle engulfing it.
Abandoned Baby (Bullish): A three-candle reversal pattern with a long red candle, a doji gapping down, and a green candle gapping up.
Tri-Star (Bullish): A three-candle reversal pattern with three doji candles in a downtrend, with gaps between them.
Kicking (Bullish): A two-candle reversal pattern with a bearish marubozu followed by a bullish marubozu gapping up.
Bearish Patterns:
On Neck: A two-candle continuation pattern in a downtrend with a long red candle followed by a short green candle closing near the first candle's low.
Falling Window: A two-candle continuation pattern in a downtrend with a price gap between the first candle's low and the second candle's high.
Falling Three Methods: A five-candle continuation pattern with a long red candle, three short green candles, and another long red candle.
Tweezer Top: A two-candle reversal pattern in an uptrend with nearly identical highs.
Dark Cloud Cover: A two-candle reversal pattern in an uptrend with a green candle followed by a red candle opening above the high and closing below the midpoint.
Downside Tasuki Gap: A three-candle continuation pattern in a downtrend with a gap between the first two red candles and a green candle closing partially into the gap.
Evening Doji Star: A three-candle reversal pattern with a long green candle, a doji gapping up, and a long red candle.
Doji Star (Bearish): A two-candle reversal pattern in an uptrend with a long green candle followed by a doji gapping up.
Hanging Man: A single-candle reversal pattern in an uptrend with a small body and a long lower shadow.
Shooting Star: A single-candle reversal pattern in an uptrend with a small body and a long upper shadow.
Evening Star: A three-candle reversal pattern with a long green candle, a short candle gapping up, and a long red candle.
Marubozu Black: A single-candle pattern with a long red body and minimal shadows.
Gravestone Doji: A single-candle reversal pattern in an uptrend with a doji where open and close are at the low.
Harami Cross (Bearish): A two-candle reversal pattern in an uptrend with a long green candle followed by a doji inside its body.
Harami (Bearish): A two-candle reversal pattern in an uptrend with a long green candle followed by a small red candle inside its body.
Long Upper Shadow: A single-candle pattern with a long upper shadow indicating seller strength.
Three Black Crows: A three-candle reversal pattern with three long red candles in an uptrend.
Engulfing (Bearish): A two-candle reversal pattern in an uptrend with a small green candle followed by a larger red candle engulfing it.
Abandoned Baby (Bearish): A three-candle reversal pattern with a long green candle, a doji gapping up, and a red candle gapping down.
Tri-Star (Bearish): A three-candle reversal pattern with three doji candles in an uptrend, with gaps between them.
Kicking (Bearish): A two-candle reversal pattern with a bullish marubozu followed by a bearish marubozu gapping down.
Neutral Patterns:
Doji: A single-candle pattern with a very small body, indicating indecision.
Spinning Top White: A single-candle pattern with a small green body and long upper and lower shadows, indicating indecision.
Spinning Top Black: A single-candle pattern with a small red body and long upper and lower shadows, indicating indecision.
Pattern Detection Functions
Each pattern detection function evaluates specific conditions based on candlestick properties (from calculateCandleProperties) and trend conditions (from detectTrend). The functions return:
detected (bool): True if the pattern is detected.
name (string): The name of the pattern (e.g., "On Neck").
type (string): The pattern type ("Bullish", "Bearish", or "Neutral").
description (string): A detailed description of the pattern for use in tooltips or alerts.
For example, the detectOnNeckBearish function checks for a bearish On Neck pattern by verifying a downtrend, a long red candle followed by a short green candle, and specific price relationships.
Usage Example
To use the library in a TradingView indicator, you can import it and call its functions as shown below:
//@version=6
indicator("Candlestick Pattern Detector", overlay=true)
import CandlestickPatternsLibrary as cp
// Calculate SMA for trend detection
sma50 = ta.sma(close, 50)
sma200 = ta.sma(close, 200)
= cp.detectTrend(true, true, "SMA50", close, sma50, sma200)
// Calculate candlestick properties
bodyAvg = ta.ema(math.max(close, open) - math.min(close, open), 14)
= cp.calculateCandleProperties(open, close, high, low, bodyAvg, 5.0, 100.0, 5.0)
// Detect a pattern (e.g., On Neck Bearish)
= cp.detectOnNeckBearish(downTrend, blackBody, longBody, whiteBody, open, close, low, bodyAvg, smallBody, candleRange)
if onNeckDetected
label.new(bar_index, low, onNeckName, style=label.style_label_up, color=color.red, textcolor=color.white, tooltip=onNeckDesc)
// Detect another pattern (e.g., Piercing Bullish)
= cp.detectPiercingBullish(downTrend, blackBody, longBody, whiteBody, open, low, close, bodyMiddle)
if piercingDetected
label.new(bar_index, low, piercingName, style=label.style_label_up, color=color.blue, textcolor=color.white, tooltip=piercingDesc)
Steps in the Example
Import the Library: Use import CandlestickPatternsLibrary as cp to access the library's functions.
Calculate Trend: Use detectTrend to determine the market trend based on SMA50 or SMA50/SMA200 rules.
Calculate Candlestick Properties: Use calculateCandleProperties to compute properties like body size, shadow lengths, and doji status.
Detect Patterns: Call specific pattern detection functions (e.g., detectOnNeckBearish, detectPiercingBullish) and use the returned values to display labels or alerts.
Visualize Patterns: Use label.new to display detected patterns on the chart with their names, types, and descriptions.
Key Features
Modularity: The library is designed as a standalone module, making it easy to integrate into other Pine Script projects.
Comprehensive Pattern Coverage: Supports over 40 candlestick patterns, covering bullish, bearish, and neutral formations.
Detailed Documentation: Each function includes comments with @param and @returns annotations for clarity.
Reusability: Can be used in indicators, strategies, or alerts by importing the library and calling its functions.
Extracted from All Candlestick Patterns: The library is derived from the All Candlestick Patterns indicator, ensuring it inherits a well-tested foundation for pattern detection.
Notes for Developers
Pine Script Version: The library uses Pine Script version 6, as specified by //@version=6.
Parameter Naming: Parameters use prefixes like p_ (e.g., p_open, p_close) to avoid conflicts with built-in variables.
Error Handling: The library has been fixed to address issues like undeclared identifiers (C_SmallBody, C_Range), unused arguments (factor), and improper comment formatting.
Testing: Developers should test the library in TradingView to ensure patterns are detected correctly under various market conditions.
Customization: Users can adjust parameters like bodyAvg, shadowPercent, shadowEqualsPercent, and dojiBodyPercent in calculateCandleProperties to fine-tune pattern detection sensitivity.
Conclusion
The Candlestick Patterns Library, extracted from the All Candlestick Patterns indicator, is a powerful tool for traders and developers looking to implement candlestick pattern detection in TradingView. Its modular design, comprehensive pattern support, and detailed documentation make it an ideal choice for building custom indicators or strategies. By leveraging the library's functions, users can analyze market trends, compute candlestick properties, and detect a wide range of patterns to inform their trading decisions.

PEAD strategy█ OVERVIEW
This strategy trades the classic post-earnings announcement drift (PEAD).
It goes long only when the market gaps up after a positive EPS surprise.
█ LOGIC
1 — Earnings filter — EPS surprise > epsSprThresh %
2 — Gap filter — first regular 5-minute bar gaps ≥ gapThresh % above yesterday’s close
3 — Timing — only the first qualifying gap within one trading day of the earnings bar
4 — Momentum filter — last perfDays trading-day performance is positive
5 — Risk management
• Fixed stop-loss: stopPct % below entry
• Trailing exit: price < Daily EMA( emaLen )
█ INPUTS
• Gap up threshold (%) — 1 (gap size for entry)
• EPS surprise threshold (%) — 5 (min positive surprise)
• Past price performance — 20 (look-back bars for trend check)
• Fixed stop-loss (%) — 8 (hard stop distance)
• Daily EMA length — 30 (trailing exit length)
Note — Back-tests fill on the second 5-minute bar (Pine limitation).
Live trading: enable calc_on_every_tick=true for first-tick entries.
────────────────────────────────────────────
█ 概要(日本語)
本ストラテジーは決算後の PEAD を狙い、
EPS サプライズがプラス かつ 寄付きギャップアップ が発生した銘柄をスイングで買い持ちします。
█ ロジック
1 — 決算フィルター — EPS サプライズ > epsSprThresh %
2 — ギャップフィルター — レギュラー時間最初の 5 分足が前日終値+ gapThresh %以上
3 — タイミング — 決算当日または翌営業日の最初のギャップのみエントリー
4 — モメンタムフィルター — 過去 perfDays 営業日の騰落率がプラス
5 — リスク管理
• 固定ストップ:エントリー − stopPct %
• 利確:終値が日足 EMA( emaLen ) を下抜け
█ 入力パラメータ
• Gap up threshold (%) — 1 (ギャップ条件)
• EPS surprise threshold (%) — 5 (EPS サプライズ最小値)
• Past price performance — 20 (パフォーマンス判定日数)
• Fixed stop-loss (%) — 8 (固定ストップ幅)
• Daily EMA length — 30 (利確用 EMA 期間)
注意 — Pine の仕様上、バックテストでは寄付き 5 分足の次バーで約定します。
実運用で寄付き成行に合わせたい場合は calc_on_every_tick=true を有効にしてください。
────
ご意見や質問があればお気軽にコメントください。
Happy trading!

London ORB + Session High/Low + FVGLondon ORB + Session High/Low + FVG
📘 Script Description: London ORB + Session High/Low + Fair Value Gap
This script is designed to assist intraday traders during the London session open by combining:
🕒 1. Opening Range Breakout (ORB)
Captures the high and low of the first 15-minute candle after the London open (08:00–08:15 GMT).
Draws lines and labels for the ORB High and Low levels.
Detects breakouts above or below the ORB and plots a triangle signal at the breakout bar.
🌐 2. Asian & US Session Levels
Automatically marks the highs and lows of the Asian (00:00–06:00 GMT) and US (13:30–20:00 GMT) sessions.
Useful for identifying prior session liquidity zones, key support/resistance levels, and potential reaction areas.
📉 3. Fair Value Gaps (FVG)
Highlights imbalances in price action between non-overlapping candles (also known as FVGs or inefficiencies).
Draws a shaded box between candles where gaps exist:
Green for bullish FVGs
Red for bearish FVGs
🔔 4. Alert Support
Optional alerts are built in for:
Long breakout (price breaks above ORB)
Short breakout (price breaks below ORB)
🎯 Use Case
Perfect for:
Day traders looking to capitalize on early volatility at the London open
Traders using liquidity-based strategies, retests, or gap-fills
Visualizing and aligning with prior session highs/lows for structure and context

cd_full_poi_CxOverview
This indicator tracks the price in 16 different time frames (optional) in order to answer the question of where the current price has reacted or will react.
It appears on the chart and in the report table when the price approaches or touches the fvg or mitigations (order block / supply-demand), the rules of which will be explained below.
In summary, it follows the fvg and mitigations in the higher timeframe than the lower timeframe.
Many traders see fvg or mitigates as an point of interest and see the high, low swept in those zones as a trading opportunity. Key levels, Session high/lows and Equal high and lows also point of interest.
If we summarise the description of the point of interest ;
1- Fair value gaps (FVG) (16 time frames)
2- Mitigation zones (16 time frames)
3- Previous week, day, H4, H1 high and low levels
4- Sessions zones (Asia, London and New York)
5- Equal high and low levels are in indicator display.
Details:
1- Fair Value Gaps : It is simply described as a price gap and consists of a series of 3 candles. The reaction of the price to the gap between the 1st and 3rd candle wicks is observed.
The indicator offers 3 options for marking. These are :
1-1- ‘Colours are unimportant’: candle colours are not considered for marking. Fvg formation is sufficient.(Classical)
1-2- ‘First candle opposite colour’ : when a price gap occurs, the first candle of a series of 3 candles must be opposite.
For bullish fvg : bearish - bullish - free
For Bearish fvg : bullish - bearish - free
1-3- ‘All same colour’ : all candles in a series of 3 candles must be the same direction.
For bullish fvg: bullish - bullish - bullish
For bearish fvg : bearish - bearish – bearish
Examples:
2- Mitigation zones: Opposite candles with a fvg in front of them or candles higher/lower than the previous and next candle and with the same colour as the fvg series are marked.
Examples :
3- Previous week, day, H4, H1 high and low levels
4- Sessions regions (Asia, London and New York)
5- Equal high and low levels:
Annotation: Many traders want to see a liquidity grab on the poi, then try to enter the trade with the appropriate method.
Among the indicators, there is also the indication of grabs/swepts that occur at swing points. It is also indicated when the area previously marked as equal high/low is violated (grab).
At the end, sample setups will be shown to give an idea about the use of the indicator.
Settings:
- The options to be displayed from the menu are selected by ticking.
- 1m, 2m, 3m, 5m, 5m, 10m, 15m, 30m, h1, h4, h4, h6, h8, h12, daily, weekly, monthly and quarterly, 16 time zones in total can be displayed.
- The ‘Collapse when the price touches mitigate’ tab controls whether to collapse the box as the price moves into the inner region of the mitigate. If not selected, the size of the mitigate does not change.
- ‘Approach limit =(ATR / n)’ tab controls how close the price is to the fvg or mitigate. Instant ATR(10) value is calculated by dividing by the entered ‘n’ value.
- All boxes and lines are automatically removed from the screen when the beyond is closed.
- Colour selections, table, text features are controlled from the menu.
- Sessions hours are set as standard hours, the user can select special time zones. Timezone is set to GMT-4.
- On the candle when the price touches fvg or mitigate, the timeframe information of the POI is shown in the report table together with the graphical representation.
The benefits and differences :
1- We can evaluate the factors we use for setup together.
2- We are aware of what awaits us in the high time frame in the following candles.
3- It offers the user the opportunity to be selective with different candle selection options in fvg selection.
4- Mitige areas are actually unmitige areas because they have a price gap in front of them. The market likes to retest these areas.
5- Equal high/low zones are the levels that the price creates to accumulate liquidity or fails to go beyond (especially during high volume hours). Failure or crossing of the level may give a reversal or continuation prediction.
Sample setup 1:
Sample setup 2:
Sample setup 3:
Cheerful trades…
Enjoy…
