Educational Inidicators - Ichimoku CloudThis indicator is part of the Indicator Educational Series, intended to help newer traders understand and interact with various indicators. The goal is to allow users to gain a stronger understanding of an indicator's underlying philosophy, and visually see how changes to an indicator's parameters affects the trades suggested by that indicator.
The scripts in this series are all open source, with the code broken up into logical section and notated so beginner users can also understand some PineScript fundamentals.
Please understand that no indicator presented in and of itself constitutes a complete trading strategy. Rather, this series is to help users determine which indicators make sense to them, and which ones to combine to create their own trading strategy. All material presented is purely for educational purposes.
Presented here is the Ichimoku Cloud.
The Ichimoku Cloud was developed by Goichi Hosada, and first published in the late 1960s. It is used by traders to understand price momentum, and help forecast future price movements.
The indicator at its core can be understood from four component parts:
The Conversion Line - An average of the highest and lowest price in a given window. Typically, this is a "fast" average, and as such, this line has the lowest period
The Base Line - An average of the highest and lowest price in a given window. This is a "slower" average than the Conversion Line, and as such should have a larger period than the Conversion Line
Leading Span A - The average of the Conversion Line and the Base Line
[*}Leading Span B - An average of the highest and lowest price in a given window. This is the "slowest" average of all three, and as such should have the largest period
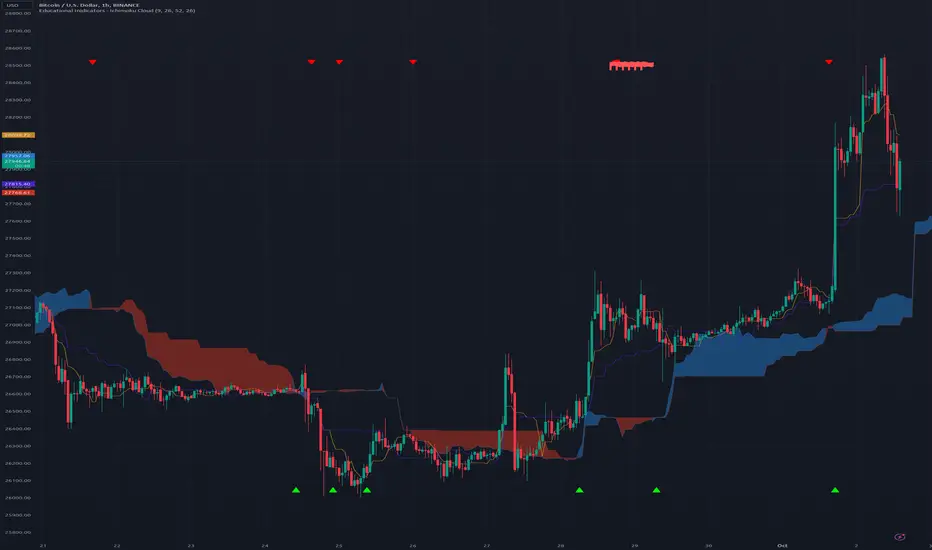
When plotted, the Conversion Line (orange by default), Base Line (purple by default), Leading Span A (blue by default), and Leading Span B (red by defaults) are all drawn on the chart along with the price candles. The area between the Leading Span A and Leading Span B lines are also shaded depending on which of the two lines is greater: whenever Leading Span A is greater the area is shaded positively (blue by default), whenever Leading Span B is greater the area is shaded negatively (red by defaults).
One interesting feature of the Ichimoku Cloud is that it drawn a certain number of candles forward. What this means is that where the cloud is drawn on the chart is reflective of prices that have occurred a number of candles in the past. This is done intentionally to help traders see how the current price is moving in relation to historical price movements on the asset.
See below for how the indicators look in their default colors on the chart
These indicators can then be used to start analyzing the price movement, and making trade decisions.
The first inference we can make is the momentum of the price. Since the lines are drawn from averages of varying speeds, the shaded area between the Leading Span lines can tell us whether the momentum is bullish (up) or bearish (down).
Whenever Leading Span A, the faster of the two lines, is above Leading Span B, that means that price is moving upward faster than it typically has, ergo we are in Bullish Momentum. On the chart, this is indicated in two ways:
The area is shaded positively (blue by default)
A green upward triangle is added to the chart to indicate where the momentum first turned Bullish
Whenever Leading Span A is below Leading Span B, that means that price is moving downward faster than it typically has, ergo we are in Bearish Momentum. On the chart, this is indicated in two ways:
The area is shaded negatively (red by default)
A red downward triangle is added to the chart to indicate where the momentum first turned Bearish
The next inference we can make is possible trading points. When we're in a period of momentum, as determined above, we know that price is going up or down, depending on the momentum we're in. We can then use the Conversion Line, Base Line, and the Price itself to confirm a good trade price.
When the asset is in Bullish Momentum, and the Conversion Line, our fastest average, is above the Base Line, our mid speed average, we know that the price is coming up quickly in the short term. When the Base Line and current Price are also above the cloud, then we have triple confirmation that price is going up, and we should enter a Long position. On the chart, this point is indicated with a green flag.
When the asset is in Bearish Momentum, and the Conversion Line is below the Base Line, we know that the price is going down quickly in the short term. When the Base Line and current Price are also below the cloud, then we have triple confirmation that price is going down, and we should enter a Short position. On the chart, this point is indicated with a red flag.
The script presented here also allows users to customize the various parameters of the Ichimoku Cloud, and visually see how analysis is affected by these changes. This is designed to allow users to modify parameters as they see fit, within certain constraints, to find the best set for them. The lines, cloud, and chart indicators will all update automatically with the users' inputs.
חפש סקריפטים עבור "ichimoku"
ULTIMATE ICHIMOKU TRADING SUITEThis is an update of "Uncle Mo's Ultimate Ichimoku V1"
Main features:
2 x Ichimoku Cloud
5 x EMA
2 x MA
1 x HullMA
Williams Fractal
Bollinger Bands - ***NEW***
ATR - ***NEW***
PSAR - ***NEW***
Candlestick Patterns - ***NEW***
Price Action Bars- ***NEW***
List of credits:
@br0qn for the Ichimoku
@RicardoSantos for the Bill Williams Fractal
@EmilianoMesa for the EMAs/MAs
@mohamed982 for the HullMA
@ymaheshreddy4u for the Bollinger Bands
@ChrisMoody for the Price Action Bars and PSAR
@HPotter for the ATR
@repo32 for the Candlestick Patterns
The script is open source and free to use. Feel free to change it around to suit your needs.
***If you copy & paste code from other traders to make your own script, please do remember to give them credit for their amazing work.***
Happy trading!

pyogi24 Intraday Ichimoku + RSIcustom script to get entry exit
its based on the ichimoku cloud indicator
and the cross over of the leading ang lagging spans to get the signals,
its under development.
i have also integrated the vwap so we know the bias of the trend.
this should work on a trending day.

[_ParkF]RSI (+ichimoku cloud)RSI
Typical RSI indicators were plotted with candles and expressed wick to resemble a candle chart,
and linear regression was added to predict changes in force intensity,
which allowed us to confirm support and resistance within linear regression .
In addition, divergence signal was marked as an additional basis for the price fluctuation point due to support and resistance .
In other words,
if the diversity signal appears together when the rsi candle is supported and resisted within linear regression ,
this is the basis for predicting that it is a point of change in the existing trend.
Finally, the period value and standard deviation of linear regression can be arbitrarily modified and used.
I hope it will help you with your trading.
--------------------------------------------------------------------------------------------------------------------------------------------------------------
(+ichimoku cloud)
Clouds made of the preceding span 1 and the preceding span 2 of the balance table can predict the trend by displaying the current price balance ahead of the future.
In addition to the role of clouds in the above-described balance sheet, this indicator also shows the cloud band support and resistance of the current RSI value.
일반적인 RSI 지표를 캔들화 하였고 꼬리까지 포함하여 캔들 차트와 유사하게 표현 하고,
캔들화한 RSI 지표에 선형회귀(채널)를 추가 하여 RSI 지표 특유의 힘의 강도의 변화를 지지와 저항으로 확인할 수 있게 해봤습니다.
또한 다이버전스 신호를 추가하여 선형회귀(채널)로 인한 지지와 저항에 따른 가격 변동의 근거로 삼을 수 있습니다.
즉, 선형회귀(채널) 안에서 RSI 캔들이 지지와 저항을 받을 때 다이버전스 신호가 함께 나타난다면 이는 기존 추세의 변화 지점임을
예측해 볼 수 있는 근거가 됩니다.
마지막으로 선형회귀(채널)의 기간값과 표준편차는 임의로 수정하여 사용할 수 있습니다.
당신의 트레이딩에 도움이 되었으면 합니다.
--------------------------------------------------------------------------------------------------------------------------------------------------------------
(+일목균형표의 구름)
일목균형표의 선행스팬1과 선행스팬2로 만들어진 구름은 현재 가격의 균형을 미래에 선행하여 표시하여 추세를 예측해볼 수 있습니다.
본 지표에서는 위에서 설명한 일목균형표의 구름의 역할과 더불어 현 RSI 값의 구름대 지지, 저항 또한 확인해볼 수 있습니다.
* I would like to express my gratitude to zdmre for revealing the linear regression source.

Kyushu Legs - Advanced Ichimoku Kinko Hyo TechniqueWhat is Kyushu Legs?
Kyushu Legs created by the open price of 9 previous weekly candle and current weekly close price.
P/s: This is the advanced Ichimoku Kinko Hyo technique by Master Goichi Hosoda
2 VWAP with selective timeframe and Display liked Ichimoku CloudSET:CKP
This is my first indicator of VWAP that I fork from the original script by public script "VWAP Periodic".
You can see that original script by type "VWAP Periodic" from "New" in "Pine Indicator".
The reason that I want to share my script is only one thing. That I need to discuss, Is this indicator can identify the trend and can use it to adapt to the "Buy-On-Dip" strategy?
Double VWAP can show you 2 lines of VWAP form different periods as my default is "Week" and "Month" timeframe.
Not at all, it fulfils with the background of the simple colour which can be defined Trend just liked "Ichimoku Cound" (Yes indeed, green is uptrend and red is downtrend).
I hope this indicator will help :)
Wishing you good health and get wealth too. :) :) :)
---------------------------------------------------------------------------------------------
สวัสดีครับมิตรสหายทุกท่าน อินดิเคเตอร์ที่ผมจะมานำเสนอมิตรสหายนี้ เป็นอินดี้ที่จะแสดงเส้น VWAP ได้ทั้งหมด 2 เส้น โดยท่านสามารถระบุ Timeframe ของ VWAP ที่ท่านต้องการได้เลยครับ
ก่อนอื่นผมของออกตัวก่อนครับ ว่าอินดิเคเตอร์นี้ผมโฟร์คมาจาก Original Public Script จากใน Pinescript แห่ง Trading View นี่ละครับ จากอินดิเคเตอร์ที่มีชื่อว่า "VWAP Periodic" ซึ่งท่านสามารถ กดดู Original Script ได้จากการกดที่
1) ไพน์อินดิเคเตอร์
2) กดเลือกคำว่า "ใหม่"
3) หาอินดิเคเตอร์ที่ชื่อว่า "VWAP Periodic"
้เท่านี้ท่านก็จะได้สคลิปต้นแบบที่ผมนำมาปรับใช้ได้ทันทีครับ
แต่กระนั้นแล้ว ผมจะเปิดโชว์สคริปของผมที่นำมาโฟร์คแล้วให้ทุกท่านได้รับชมกันด้านล่างในส่วนของโค้ดนะครับ
จุดประสงค์ของอินดิเคเตอร์นี้คือได้ฟังแนวคิดของ VWAP จากกัลยาณมิตรเทรดเดอร์ด้วยกันแล้วรู้สึกคลิ๊ก กับอินดิเคเตอร์นี้มากครับ
จะมีอะไรดีไปกว่าการได้รู้ต้นทุนราคาของแต่ละช่วงเวลา ทั้งไทม์เฟรมที่ใหญ่อย่างระดับ "เดือน (เส้นสีเขียว)" และ ระดับ "สัปดาห์ (เส้นสีแดง)" ได้พร้อมกันและดูแท่งเทียนเพื่อ "จับจังหวะซื้อ"(ในไทม์เฟรม ระดับ วัน) ที่ราคาต่ำกว่าค่า VWAP อีกเล่าอรชุน
จุดประสงค์หลักของอินดิเคเตอร์นี้ คือมีไว้เพื่อระบุเทรนด์โดยอาศัยการดูระยะห่างของเส้น VWAP ทั้ง 2 เส้นนี้ และระบุ "จุดกลับตัว" เมื่อก้อนเมฆสีเขียวและแดงเริ่มหายไป เสมือนกับอินดิเคเตอร์ "เมฆหมอกแห่งอิชิโมคุ"
นอกจากนี้เมื่อราคาหุ้นปรับตัวเป็นเทรนด์ขาขึ้นแล้ว เรายังสามารถซื้อเฉลี่ยขาขึ้น หรือใช้กลยุทธ์ Buy-on-Dip ได้อีกด้วยครับ โดยเฉลี่ยซื้อเมื่อราคาตกย่อมาอยู่ที่เส้นสีเขียว แบบนี้เป็นต้นครับ
ผมหวังว่าอินดิเคเตอร์นี้จะเป็นประโยชน์ให้แก่มิตรสหาย และกัลยาณมิตรเทรดเดอร์ทุกท่านนะครับ
ผมขออวยพรให้ทุกท่านมีความสุข ออกจากสนามแข่งหนูนี้ ได้รับอิสระภาพทางการเงิน และ "มีสุขภาพที่แข็งแรง" Work life balance ทุกท่านครับ
ขอบคุณครับ :) :) :)

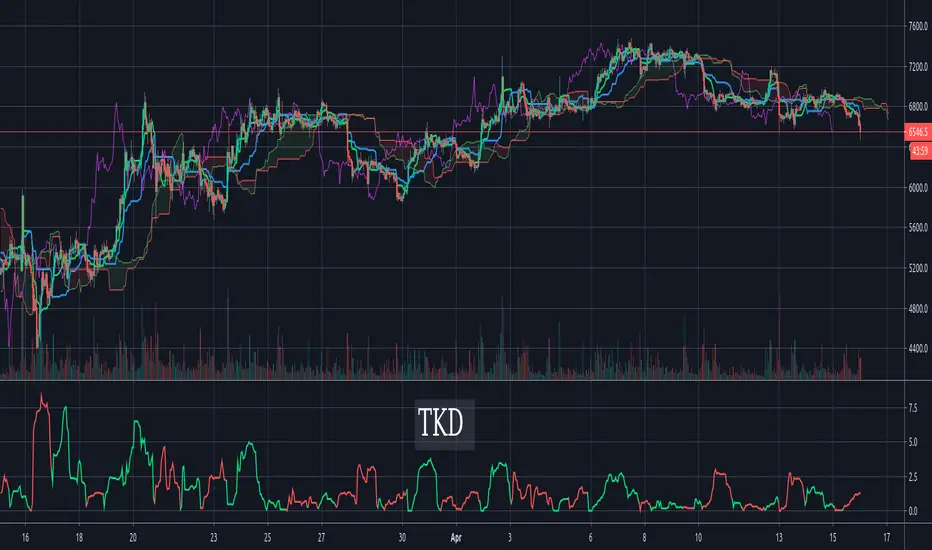
Tenkan-Sen Kijun-Sen Distance (TKD) Oscillator - IchimokuThe TKD is the distance between the Tenkan-Sen and the Kijun-Sen, expressed in percentage of current price. The further apart the tenken-sen and kijun-sen are, the more they want to snap back together. This makes for a decent oscillator. When the Tenkan-Sen is above the Kijun-Sen, the TKD is green. When it is below, the TKD is red. At the crossing points, it turns blue.
For those more familiar with Ichimoku Cloud techniques, one might also think of this indicator as a C-Clamp indicator. Bar coloring is supported and enabled by default. There's also an option to flip/invert the green/red colors in case you want to use it to judge pending cycles rather than current ones.
Pivot Boss 4 EMA + BB + Parabolic SAR + IchimokuA combination of a few of my favorite indicators.
1) Pivot Boss 4 EMA
2) Bollinger Bands
3) Parabolic SAR
4) Ichimoku Cloud
All credit to original authors.

Complete Ichimoku Trader *modified*I just found this script from @kingthies here and like it. So i just made some changes and added some little code into it.
Reduced some noise for the signals. Hope anyone can enjoy it. But keep in mind, did not test it on live trading! Had just some time and love to work in pine :)
Original
Happy Trading

Quad Moving Avarage-Ichimoku Cloud-ALMA-Bollinger BandsAll-in-One
Ingradients:
* Ichimoku Cloud,
* 2 Simple Moving Avarage (SMA),
* 2 Exponential Moving Avarage (EMA),
* 2 Arnoud Legoux Moving Avarage (ALMA),
* Bollinger Bands and
* Volume Based Colored Bars (developed by KIVANÇ fr3762).
Compiled for limitations. Thank you.

Uncle Mo's Ultimate Ichimoku V1Main features:
2 x Ichimoku Cloud
5 x EMA
2 x MA
1 x HullMA
Williams Fractals
Study is based around trader @br0qn 's Ichimoku script.
Credits also go to:
@RicardoSantos for the Bill Williams Fractals
@EmilianoMesa for the EMAs/MAs
@mohamed982 for the HullMA
The script is open source so please feel free to change it around. I'd greatly appreciate it if you could suggest ways to improve it.
Happy trading!

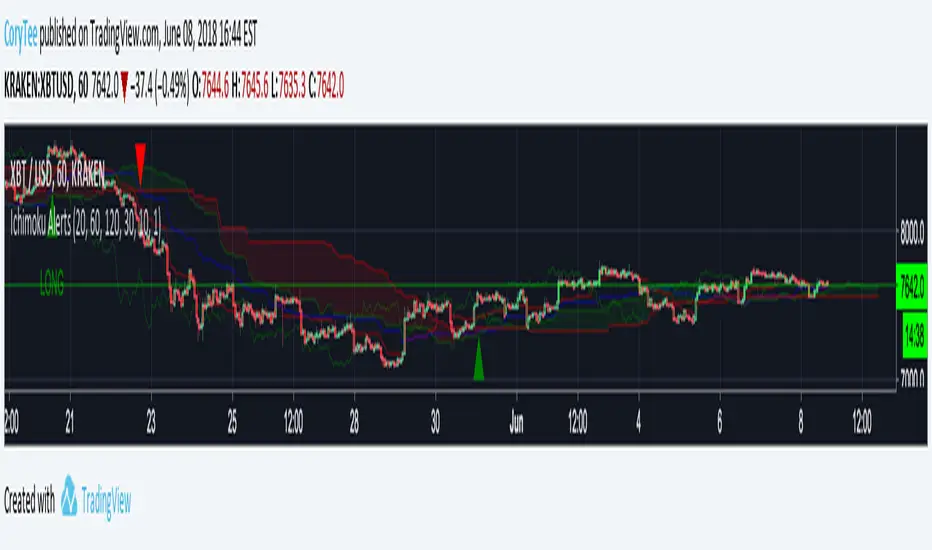
CoryT's Noro's Ichimoku AlertsA few months ago I took Noro's Ichimoku Cloud and used the AV bot template to throw stops on it. I took some code from JustUncleL
to make it not so hideous. Trailing Stops are turned off, stop losses are turned off (you really don't need them with this), and this is currently a Long/Short strategy, the Longs Only and Shorts Only options are broken right now, I'm tired and you guys can either fix it yourselves or deal with it like this for now.
Hint: If you wanna use this as a long-only strategy just have AV close your buy orders whenever a short is triggered.
TSP Ichimoku Clouds x2 MTFDouble Ichimoku
Use a Multiple of current time frame :
15m * 4 = 1h
1h*24 = 1d


Idō Heikin Ichimoku [DW]This is an experimental study inspired by Goichi Hosoda's Ichimoku Kinkō Hyō.
In this study, a McGinley Dynamic replaces the Tenkan-Sen and Kaufman's Adaptive Moving Average replaces the Kijun-Sen.
The cloud is calculated by taking the mean of the highest high and lowest low, adding a golden mean standard deviation above and below, and offsetting it over the specified period.
The lagging span is calculated by offsetting the closing price by the same amount as the cloud period.

Multiple Ichimoku CloudsFor anyone that uses the Ichimoku Cloud there is a consistent need to flip between timeframes to get information about this at all levels. However, that trouble is now over. In this script there are 4 Ichimoku Clouds that operate in 4 different time frames. To change the timeframe simply change the multiplication factor to the desired levels. How this script works is that it takes your current timeframe as an input then it applies multiplication factors to it to achieve larger timescales. In the example here we are looking at the XBTJPY pair on the 1 hour. Our first cloud is 1x scaling, meaning that it is the 1 hour cloud. The second and third are 2x and 4x respectively meaning that we are looking at the 2 hour cloud and the 4 hour cloud. Lastly the largest cloud is the 24x cloud, aka the daily cloud. Now you only really need one look at the clouds for all the essential information.
As always feel free to message me about anything regarding this script.
Be happy :)
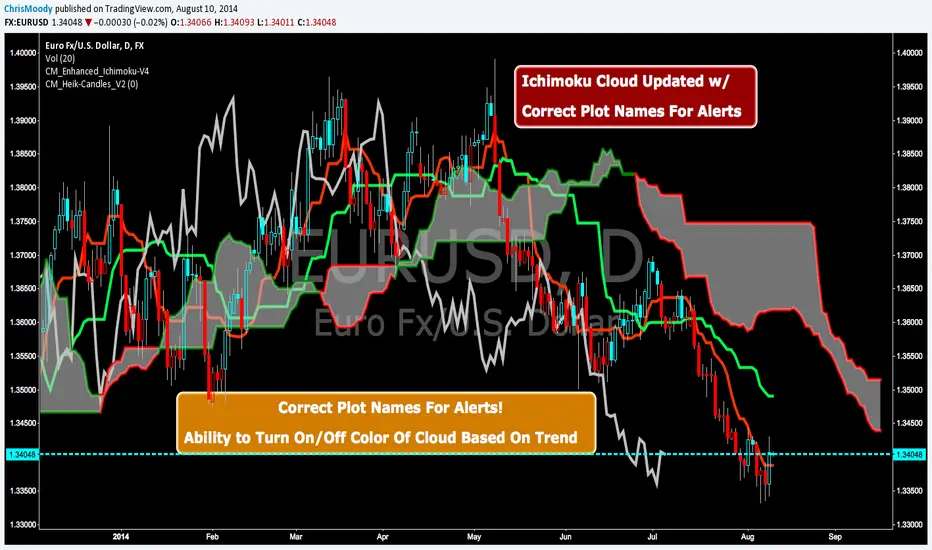
CM Enhanced Ichimoku Cloud-V4CM Enhanced Ichimoku Cloud-V4 Updated For Alerts!!!
Correct Plot Names For Alerts!
Ability to Turn On/Off Color Of Cloud Based On Trend!

Ichimoku Cloud ExIchimoko Clouds with vertical lines at the Conversion Period (default: 9), Base Period (default: 26) and Lagging Span B period (default: 52) as visual clues to the offsets.

Ichimoku Cross Indicator [Mehdihz]This script shows tenken & kijen lines position to better detection of crosses.

Ichimoku-Hausky_v2.1Made a little update to my trading system. This system is made so that you can easily follow the trend and know when to get out. You still have to know basic market structure to find a good entry.
NB!! I see that i placed the entry wrong on the example, you have too wait for the EMA to go below the MA :)
I have posted the right one at the bottom.
Take profit can be set at last low or you can use trail stop on the EMA, MA, Kijun-sen or Tenkan-sen.
Example rules:
Buy:
IF Market is in a trend or are possibly close to break out of range
THEN see if price has closed above cloud
IF price has closed above cloud
THEN see if EMA has crossed above MA
IF EMA has crossed above MA
THEN buy or wait for pullback
Sell:
IF Market is in a trend or are possibly close to break out of range
THEN see if price has closed below cloud
IF price has closed below cloud
THEN see if EMA has crossed below MA
IF EMA has crossed below MA
THEN buy or wait for pullback

Ichimoku-Hausky_v2 Trading SystemMade a new version of my trading system. I have added a cloud that is made with 45 EMA and 104 MA. Now you can choose where to set trailing stop. As shown in the example you set trailing stop under the cloud.
