PivotLibrary "Pivot"
This library helps you store and manage pivots.
bias(isHigh, isHigher, prevWasHigher)
Helper function to calculate bias.
Parameters:
isHigh (bool) : (bool) Wether the pivot is a pivot high or not.
isHigher (bool) : (bool) Wether the pivot is a higher pivot or not.
@return (bool) The bias (true = bullish, false = bearish, na = neutral).
prevWasHigher (bool)
biasToString(bias)
Parameters:
bias (bool)
biasToColor(bias, theme)
Parameters:
bias (bool)
theme (Theme)
nameString(isHigh, isHigher)
Parameters:
isHigh (bool)
isHigher (bool)
abbrString(isHigh, isHigher)
Parameters:
isHigh (bool)
isHigher (bool)
tooltipString(y, isHigh, isHigher, bias, theme)
Parameters:
y (float)
isHigh (bool)
isHigher (bool)
bias (bool)
theme (Theme)
createLabel(x, y, isHigh, isHigher, prevWasHigher, settings)
Parameters:
x (int)
y (float)
isHigh (bool)
isHigher (bool)
prevWasHigher (bool)
settings (Settings)
new(x, y, isHigh, isHigher, settings)
Parameters:
x (int)
y (float)
isHigh (bool)
isHigher (bool)
settings (Settings)
newArray(size, initialValue)
Parameters:
size (int)
initialValue (Pivot)
method getFirst(this)
Namespace types: Pivot
Parameters:
this (Pivot )
method getLast(this, isHigh)
Namespace types: Pivot
Parameters:
this (Pivot )
isHigh (bool)
method getLastHigh(this)
Namespace types: Pivot
Parameters:
this (Pivot )
method getLastLow(this)
Namespace types: Pivot
Parameters:
this (Pivot )
method getPrev(this, numBack, isHigh)
Namespace types: Pivot
Parameters:
this (Pivot )
numBack (int)
isHigh (bool)
method getPrevHigh(this, numBack)
Namespace types: Pivot
Parameters:
this (Pivot )
numBack (int)
method getPrevLow(this, numBack)
Namespace types: Pivot
Parameters:
this (Pivot )
numBack (int)
method getText(this)
Namespace types: Pivot
Parameters:
this (Pivot)
method setX(this, value)
Namespace types: Pivot
Parameters:
this (Pivot)
value (int)
method setY(this, value)
Namespace types: Pivot
Parameters:
this (Pivot)
value (float)
method setXY(this, x, y)
Namespace types: Pivot
Parameters:
this (Pivot)
x (int)
y (float)
method setBias(this, value)
Namespace types: Pivot
Parameters:
this (Pivot)
value (int)
method setColor(this, value)
Namespace types: Pivot
Parameters:
this (Pivot)
value (color)
method setText(this, value)
Namespace types: Pivot
Parameters:
this (Pivot)
value (string)
method add(this, pivot)
Namespace types: Pivot
Parameters:
this (Pivot )
pivot (Pivot)
method updateLast(this, y, settings)
Namespace types: Pivot
Parameters:
this (Pivot )
y (float)
settings (Settings)
method update(this, y, isHigh, settings)
Namespace types: Pivot
Parameters:
this (Pivot )
y (float)
isHigh (bool)
settings (Settings)
Pivot
Stores Pivot data.
Fields:
x (series int)
y (series float)
isHigh (series bool)
isHigher (series bool)
bias (series bool)
lb (series label)
Theme
Attributes for customizable look and feel.
Fields:
size (series string)
colorDefault (series color)
colorNeutral (series color)
colorBullish (series color)
colorBearish (series color)
colored (series bool)
showTooltips (series bool)
showTooltipName (series bool)
showTooltipValue (series bool)
showTooltipBias (series bool)
Settings
All settings for the pivot.
Fields:
theme (Theme)
חפש סקריפטים עבור "pivot"
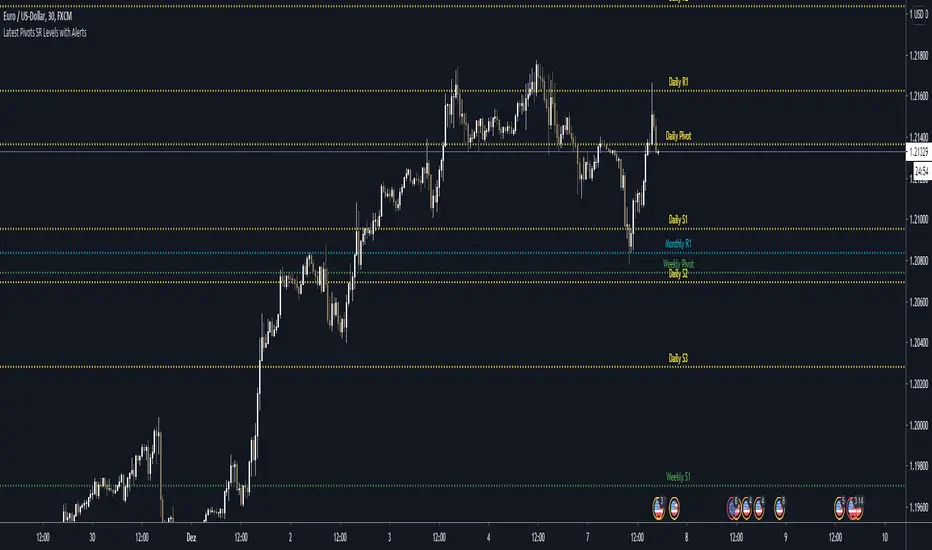
Latest Pivots SR Levels with Alerts<<< English Description >>>
Hello Traders
This script displays the classic pivot levels (also called floor pivots) as continuous lines on the chart. One special feature is that only the current pivots and SR values are displayed.
Another special feature of this script is, it allows you to set alarms on any pivot and S/R level. With the setting explained below you can configure the alarms to come before the level is reached, so you have more time to react.
The script optionally displays the following pivot points and the corresponding S1-S3 and R1-R3 levels
- Daily Pivot & S/R Levels
- Weekly Pivot & S/R Levels
- Monthly Pivot & S/R Levels
I would like to point out that this indicator alone is not sufficient as a trade decision! It should be a supporting factor to provide additional confirmation to chart analysis and/or price action and other analysis methods.
I would like to briefly explain the following settings:
- "Horizontal Offset in Candles (Label)"
Moves the labels horizontally either to the left or right, starting from the current price. This setting is useful so that the labels are not exactly at the level of the current price.
- "Vertical Offset in Candles (Label)"
Moves the labels horizontally either up or down, starting from the current price.
- "Close/Near To (in Ticks)"
Controls when the alarms are triggered. Here you can set that the alarm is already triggered when the price is for example 100 ticks away from the current price. Ticks are always the smallest possible unit and can be looked up for each symbol
Write me a private message to get access or if there are still questions about the usage!
<<< Deutsche Beschreibung >>>
Hallo Traders
Dieses Skript stellt die klassischen Pivot-Levels (auch Floor-Pivots genannt) als durchgehende Linien auf dem Chart dar. Speziell ist das nur die aktuellen Pivots und SR Werte dargestellt werden.
Eine weitere Besonderheit dieses Skripts ist, dass es Ihnen erlaubt, Alarme auf jedem Pivot- und S/R-Level einzustellen. Mit der unten erläuterten Einstellung können Sie die Alarme so konfigurieren, dass die Alarme vor Erreichen des Levels kommen, so dass Sie mehr Zeit zum Reagieren haben.
Das Skript stellt wahlweise die folgenden Pivots-Points und die dazugehörigen S1-S3 und R1-R3 Levels dar.
- Daily Pivot & S/R Levels
- Weekly Pivot & S/R Levels
- Monthly Pivot & S/R Levels
Ich möchte darauf Hinweisen das dieser Indikator alleine nicht als Trade-Entscheidung ausreicht! Er soll ein unterstützender Faktor sein, um eine zusätzliche Bestätigung zur Chart-Analyse und/oder Price-Action und anderen Analysemethoden zu bieten.
Folgende Einstellungen möchte ich kurz erläutern:
- "Horizontal Offset in Candles (Label)"
Verschiebt die Label horizontal entweder nach Links oder rechts, ausgehend vom aktuellen Preis. Diese Einstellung ist nützlich damit die Labels nicht genau auf dem Level vom aktuellen Preis sind.
- "Vertical Offset in Candles (Label)"
Verschiebt die Label horizontal entweder nach oben oder unten, ausgehend vom aktuellen Preis.
- "Close/Near To (in Ticks)"
Steuert wann die Alarme getriggert werden. Hier kann eingestellt werden das der Alarm bereits kommt wenn der Preis zum Beispiel 100 Ticks vom aktuellen Preis entfernt ist. Ticks sind immer die kleinst mögliche Einheit und könne für jedes Symbol nachgeschaut werden
Schreiben Sie mir eine Private Nachricht, um Zugang zu erhalten oder wenn noch Fragen zur Nutzung offen sind!
FatihStrategy: Universal Pivot System v3.3.1FatihStrategy: Universal Pivot System v3.3.1 is an advanced technical analysis indicator that combines multi-timeframe pivot averages with EMA trend filters in a single visual system.
🔹 How It Works
Depending on the selected pivot mode, the indicator calculates and visualizes:
Daily & 3-Day Average Pivots
Weekly & 3-Week Average Pivots
Monthly & 3-Month Average Pivots
Yearly & 3-Year Average Pivots
The difference between pivot levels is displayed as colored boxes:
Red Box → Lower timeframe pivot zone
Yellow Box → Higher timeframe pivot zone
These zones help identify potential support, resistance, and consolidation areas.
🔹 EMA Trend Support
Optional exponential moving averages:
20 EMA
50 EMA
200 EMA
can be enabled to assist with trend direction and trade filtering.
🔹 Suitable For
Day traders and swing traders
Pivot-based strategies
Traders looking for clear visual support/resistance zones
Crypto, forex, and stock market analysis
⚠️ Disclaimer
This indicator is not financial advice.
Always use proper risk management and confirm signals with your own trading strategy.

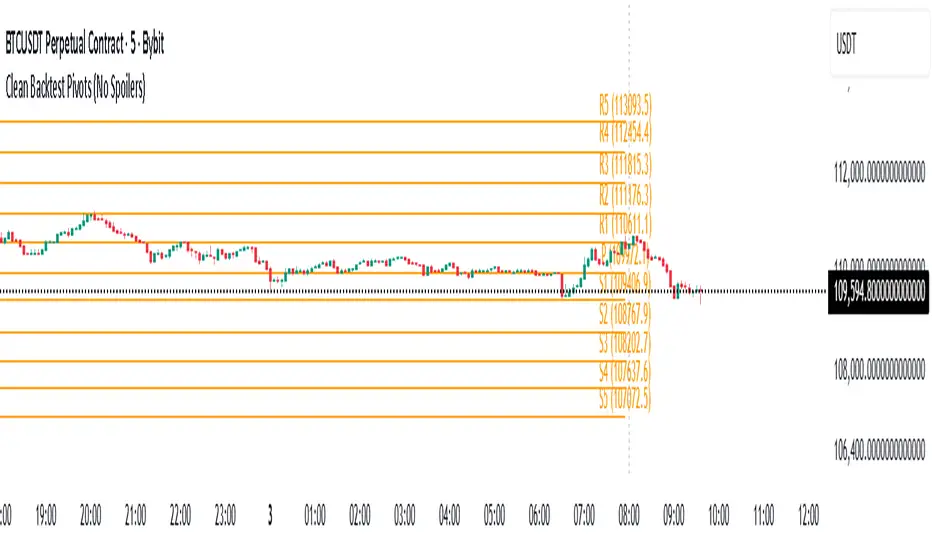
Daily Backtest Pivots Problem with the built-in Pivot Points Standard indicator in backtesting/replay mode:
The default "Pivot Points Standard" indicator is excellent on live charts, but it becomes completely unusable for proper backtesting or bar-replay because it always calculates and displays the current day’s pivot points (P, R1, R2, S1, S2, etc.) using the high/low/close of the still-forming current day — even when you're replaying historical bars.
Example:
When replaying or backtesting September 8 at 08:00 (Asian session), the indicator already shows the final R1, R2, S1, S2 for the entire September 8 daily candle, even though in real trading at that moment you would have no idea where the day will close or what the final daily range will be. This creates massive look-ahead bias and makes any strategy that uses daily pivots impossible to test realistically.
Desired behavior (historical accuracy):
During backtesting or bar replay, the indicator should only plot:
The previous day’s completed pivot levels (which were actually known at the start of the current day)
NO current-day pivot levels at all (or only plot them after the daily candle is closed)
Many custom pivot scripts already do exactly this (they only show the prior day’s levels throughout the current day), which is why people abandon the built-in indicator for backtesting.
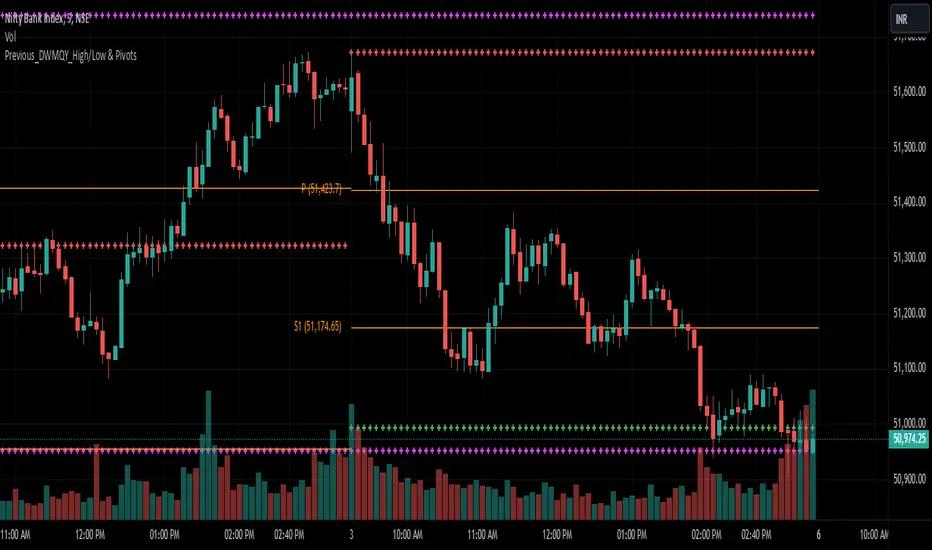
Previous_DWMQY_High/Low & PivotsThis script calculates high/low pivots for different timeframes (daily, weekly, monthly, quarterly, and yearly). You have various pivot point calculation methods (Traditional, Fibonacci, Woodie, Classic, DM, Camarilla) and have inputs that allow customization of the indicator. The script also accounts for custom year-based calculations (bi-yearly, tri-yearly, quinquennially, decennially).
The first part of your code calculates the high and low levels for different timeframes, which are plotted on the chart as crosses. The second part involves the pivot point calculations, where the user selects the type of pivot point calculation (Traditional, Fibonacci, etc.), the timeframe for pivots, and other display settings.
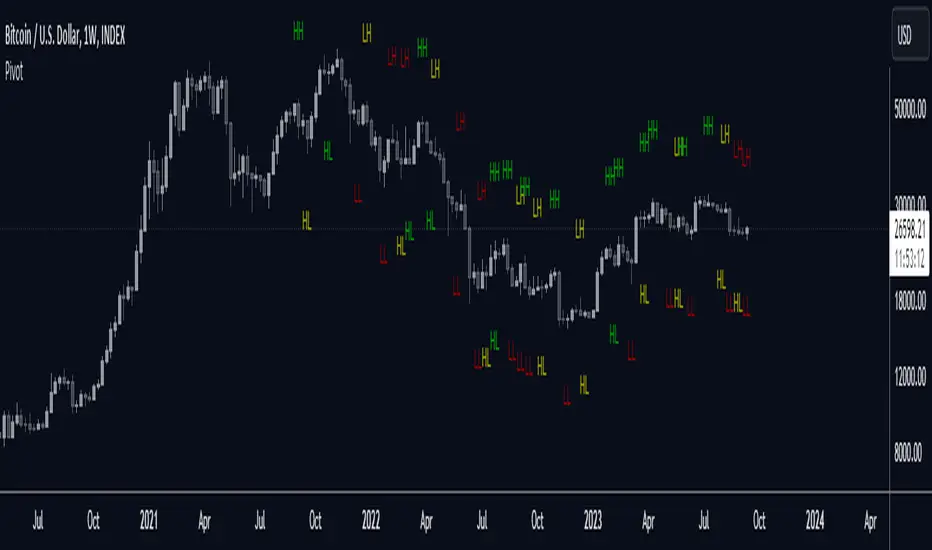
PivotThis library was designed to create three different datasets using Bill Williams fractals. The goal is to spot trends in reversal data and ultimately use these datasets to help predict future price reversals.
First, the pivot() function is used to initialize and populate three separate arrays (high pivot , low pivot , all pivots ). Since each high/low price depends on the bar_index, the bar_index, pivot direction(high/low), and high/low values are compressed into a string to maintain the data's integrity ("__"). Once each string array is populated and organized by bar_index, all three are returned inside a tuple. The return value must be deconstructed H,L,A =pivot() for each array's values to be accessed using getPivot() . This boilerplate allows for data to be accessed more efficiently in a recursive environment. getPivot() was designed to be used inside of a for or while block to populate matrices for further analyses. Again, getPivot() return values must be exposed through deconstruction. x,d,y =getPivot(). See code for more details.
pivot(int XLR) initializes and populates arrays
Parameters
XLR - number of bars to the left and right that must be lower for a high to be considered a pivotHigh, or vice versa. This number will drastically change the size and scope of the returned datasets. smaller values will produce much larger datasets, which might model short term price activity well. In contrast, larger values will produce smaller datasets which might model longer term price activity well.
Returns - tuple [string ]
getPivot(string arrayID, int index) accesses array data
Parameters
arrayID - the variable name for one of the three arrays returned by pivot().
index - the index of the provided array, with 0 being the most recent pivot point. can be set to " i " in a loop to access values recursively
Returns - tuple

KISS Pivot LinesWhat it does
• Automatically finds pivot highs and pivot lows on your chart.
• Draws clean horizontal lines (no messy labels, price or text).
• Filters out weak swings using an ATR filter and merge tolerance so only the bigger turning points stay.
• Keeps just the last N levels (you choose how many) so your chart never gets overloaded.
⸻
How to use
Support & Resistance
• Red lines (highs): potential resistance. Price often retests (“kisses”) these before reversing or breaking through.
• Teal lines (lows): potential support. Price often bounces here or breaks down if momentum is strong.
Trade setups
• Trend trades: Use pivots in confluence with VWAP, EMA, or your trend filter.
• Reversals: Watch for rejection candles or divergence right at a pivot line.
• Breakouts: If price slices cleanly through a pivot line, the old support often flips to resistance (and vice versa).
⸻
Suggested settings
• Left/Right = 6–10 bars → balanced pivots on intraday charts.
• ATR filter = 0.5–1.0× → keeps only strong swings.
• Merge ticks = 2–4 (ES), 8–12 (NQ) → merges nearby levels into one clean line.
• Max lines = 6 highs / 6 lows → keeps things readable.
⸻
⚡ Tip: Price loves to “kiss” these levels on the way back. Don’t just take them blindly—wait for price action or confluence to confirm whether it’s bouncing, rejecting, or breaking.

Modified - Pivot Points Standard with Daily H/L/CThis indicator plots Pivot Points Standard with six calculation methods (Traditional, Fibonacci, Woodie, Classic, DM, Camarilla) and flexible anchors (Auto/D/W/M/Q/Y and multi-year). You can restrict pivots to the current day/week/month, choose daily-based data (uses higher-timeframe OHLC; futures use settlement close) or intraday aggregation, and independently style pivots versus previous-period lines with solid/dashed/dotted types and custom widths. Per-level colors are provided (PP/R/S), with R4/R5 and S4/S5 off by default, plus optional labels showing prices positioned left or right. It also draws the previous Day/Week/Month High, Low, and Close across the current period using completed higher-timeframe values (lookahead_off with ), ensuring they always reflect the prior session/period. Rendering is optimized by limiting historical pivot sets and auto-cleaning old lines for smooth performance on any timeframe.

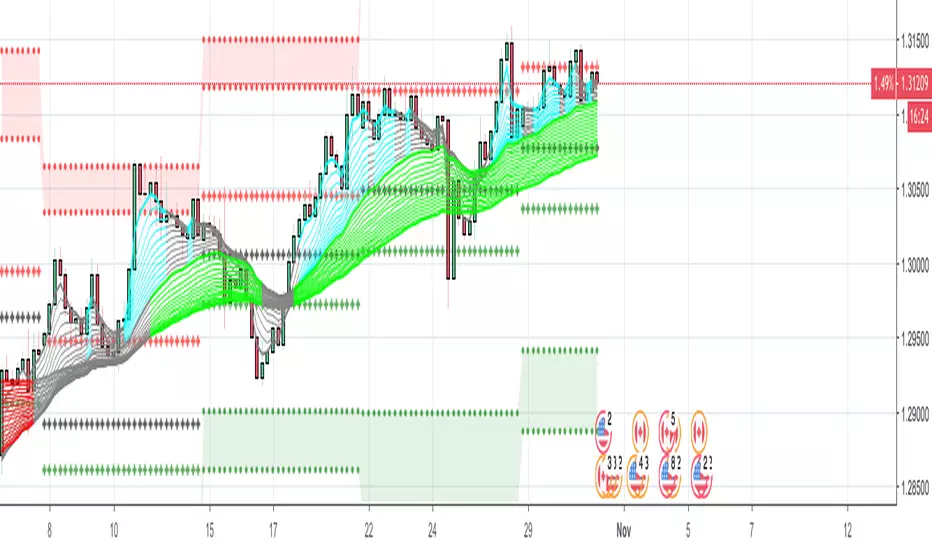
[r380]Bear & Bull Pivot Signal Indicator_(Lite))Bear & Bull Pivot Signal Indicator
Overview:
The Bear & Bull Multi Pivot Signal Indicator is a comprehensive trading tool designed to identify potential market reversal points and trend changes. This indicator combines multiple technical analysis strategies such as RSI, MACD, and pivot points to generate reliable signals. By overlapping these signals, the indicator increases the possibility of accurate trend predictions, providing traders with valuable insights for informed decision-making.
"This indicator is primarily optimized for Bitcoin on a 15-minute timeframe and is recommended for short-term trading. Reliability on other timeframes is not guaranteed."
Key Features:
Bear and Bull Signals: Clearly indicate potential market reversal points using bear and bull emojis.
Support and Resistance Signals: Indicated with sun and snowflake emojis to show critical price levels.
Overheat Cooldown Pivot: Detects market exhaustion points to signal potential reversals.
Settings:
RSI Settings: Adjust the RSI period and thresholds to match your trading strategy. Default values are optimized for short-term trading.
MACD Settings: The MACD settings are pre-configured but can be customized if needed.
Visual Settings: If excessive signals cause visual discomfort, you can selectively enable or disable features in the visual settings.
Signal Descriptions:
🐻 Bear Signal: Indicates a potential high point where the market may reverse downwards. Combines RSI and MACD conditions to provide a reliable overbought signal. When accompanied by high volume, it can indicate a strong resistance level.
🐮 Bull Signal: Indicates a potential low point where the market may reverse upwards. Uses both RSI and MACD conditions to highlight oversold situations. When accompanied by high volume, it can indicate a strong support level.
❄️ Resistance Signal: Shows a resistance level where the price has difficulty moving higher. When the price crosses below this level, it signals a potential downward movement. Combined with high volume, it can signify robust resistance.
☀️ Support Signal: Shows a support level where the price has difficulty moving lower. When the price crosses above this level, it signals a potential upward movement. Combined with high volume, it can signify strong support.
Detailed Explanation:
This indicator is not simply a combination of multiple indicators but is designed to increase the probability of detecting potential trend reversal signals by using multiple signals. If signals only appear when multiple conditions are met, how many trades can we make in a year? Because there is no 100% certainty in any situation, we need to use various signals to construct our strategy and proceed with trading. For example, if only one signal appears, the reliability of the trend reversal signal is somewhat weak, so we can strategize by betting only a portion of the capital. If multiple signals appear simultaneously, we can consider it a highly reliable trend reversal signal and increase the betting amount and stop loss accordingly. The essence of this indicator, in my view, is not to blindly trade based on signals but to use it as an auxiliary tool for strategic decision-making.
RSI (Relative Strength Index), MACD, and Stochastic RSI: By using various indicators to confirm trend reversal signals, bear and bull emojis are included. If the RSI reaches an oversold zone and then drops by a certain amount, while the MACD turns negative and the Stochastic RSI makes a gold or dead cross, the bear and bull signals are activated.
Pivot Points: Calculated based on the high, low, and close prices over a specific lookback period. These points are used to determine support and resistance levels. Pivot points provide a framework for assessing market sentiment and potential reversal zones. The values calculated this way activate the sun and snowflake signals.
The Overheat Cooldown Pivot: captures moments when the market shows signs of exhaustion, particularly when overbought or oversold conditions are accompanied by a drop in volume. This helps traders anticipate market turning points more effectively. These signals appear as red or green triangles indicating potential reversals. Although similar to the bear and bull signals in detecting market cool-off points, these signals rely on volume and may have slightly lower reliability.
Practical Application:
By using this indicator, traders can strategically adjust their bet sizes based on the reliability of the signals. When multiple signals coincide, it indicates a higher probability of a trend reversal, allowing for larger position sizes. Conversely, when signals occur independently, it suggests a lower probability, warranting smaller position sizes. This approach enables traders to manage their risk effectively and capitalize on high-probability trading opportunities without excessively reducing trading frequency.
Trading Method:
The basic setup is for Bitcoin on a 15-minute timeframe, and short-term trading is recommended by the creator. Upon signal activation, if only one signal appears, verify the volume and support/resistance lines, calculate the risk-reward ratio, and enter a position with a low betting ratio. If three signals activate simultaneously, enter a position with a higher betting ratio.
Reliability Order:
🐻🐮 > ❄️☀️ > 🔻🔺 (replacing green triangle emojis)
This indicator provides a powerful method for detecting multiple potential market reversals and trend continuations.
Note: Have realistic expectations and understand the limitations of technical analysis tools. This indicator is a tool to assist in your trading decisions and not a guaranteed prediction of market movements.
Warning! Do not trade solely based on this indicator.
Additionally, if you find the settings lacking, feel free to adjust them yourself! Thank you!
Korean Version
곰돌이와 송아지 멀티 피봇 시그널 인디케이터
개요:
곰돌이와 송아지 멀티 피봇 시그널 인디케이터는 잠재적 시장 반전 지점과 추세 변화를 식별하기 위해 설계된 종합 거래 도구입니다. 이 인디케이터는 RSI, MACD, 피봇 포인트 등의 여러 기술 분석 전략을 결합하여 신뢰할 수 있는 신호를 생성합니다. 이러한 신호들을 중첩함으로써 정확한 추세 예측의 가능성을 높여, 트레이더가 정보를 기반으로 결정을 내리는 데 유용한 통찰력을 제공합니다.
기본적으로 비트코인 15분봉을 기준으로 하며 매매 방법은 단타를 권장합니다. 다른 타임프레임에서의 신뢰는 보장 하지 않습니다.
주요 기능:
곰돌이와 송아지 신호: 시장의 잠재적 반전 지점을 곰돌이와 송아지 이모지로 명확하게 표시합니다.
지지 및 저항 신호: 중요한 가격 수준을 나타내기 위해 태양과 눈송이 이모지로 표시합니다.
오버히트 쿨다운 피봇: 시장 피로 지점을 감지하여 잠재적 반전 신호를 제공합니다.
세팅방법:
RSI 설정: RSI 기간과 임계값을 조정하여 자신의 거래 전략에 맞춥니다. 기본값은 단기 거래에 최적화되어 있습니다.
MACD 설정: MACD 설정은 미리 구성되어 있으며, 필요에 따라 사용자 정의가 가능합니다.
비쥬얼 세팅: 과도한 시그널 때문에 눈이 아프시다면 비쥬얼세팅에서 선택적으로 기능들을 켜거나 끌 수 있으니 참고하세요.
신호 설명:
🐻 곰돌이 신호: 시장이 하락할 가능성이 있는 고점을 나타냅니다. RSI와 MACD 조건을 결합하여 신뢰할 수 있는 과매수 신호를 제공합니다. 높은 거래량과 함께 나타나면 강한 저항 수준을 나타낼 수 있습니다.
🐮 송아지 신호: 시장이 상승할 가능성이 있는 저점을 나타냅니다. RSI와 MACD 조건을 사용하여 과매도 상황을 강조합니다. 높은 거래량과 함께 나타나면 강한 지지 수준을 나타낼 수 있습니다.
❄️ 저항 신호: 가격이 더 이상 상승하기 어려운 저항 수준을 나타냅니다. 가격이 이 수준 아래로 하락하면 잠재적 하락 움직임을 신호합니다. 높은 거래량과 함께 나타나면 강력한 저항을 의미할 수 있습니다.
☀️ 지지 신호: 가격이 더 이상 하락하기 어려운 지지 수준을 나타냅니다. 가격이 이 수준 위로 상승하면 잠재적 상승 움직임을 신호합니다. 높은 거래량과 함께 나타나면 강한 지지를 의미할 수 있습니다.
상세 설명:
이 인디케이터는 여러 인디케이터를 단순히 결합한 것이 아니라, 여러가지 시그널들을 사용해서 잠재적 추세전환 신호 감지 확률을 높이는 것에 목적이 있습니다. 단순히 여러가지 조건들이 중첩되었을때만 신호가 뜬다면 우리는 1년에 몇번이나 매매를 할 수 있을까요. 모든경우에 100% 라는 경우가 없기때문에 우리는 다양한 신호들을 활용하여 전략을 구성하고 매매를 진행 해야합니다. 예를들어 1개의 시그널만 뜬다면 추세전환 신호의 신뢰도가 다소 약하기 때문에 시드의 일부 금액만 배팅 하는 식으로 전략을 구성 할 수도 있고, 만약 여러가지 시그널들이 충접적으로 뜬다면 신뢰도 높은 추세전환의 신호로 인식하여 배팅금액을 높이고 스탑로스를 높게 잡는 방향으로 전략을 구성 할 수 있습니다. 단순히 맹목적으로 시그널이 떳다고 매매하는것이 아닌 보조 신호로써의 기능, 이것이 내가 생각하는 인디케이터의 역할이자 본질 이라고 생각합니다.
RSI (상대 강도 지수)와 MACD, 스토캐스틱 RSI: 여러가지 지표들을 기반으로 추세 반전의 신호를 확인 할 수 있는 곰돌이와 송아지를 넣었습니다. RSI 가 과매도 구간에 도달한 이후일정 수치 이상 하락하는 동시에 MACD가 음수로 변하고 스토캐스틱 RSI가 골드, 데드 크로스가 된다면 곰돌이와 송아지 신호가 활성화 됩니다.
피봇 포인트: 특정 되돌아보기 기간 동안의 최고, 최저, 종가를 기반으로 계산됩니다. 이 포인트는 지지 및 저항 수준을 결정하는 데 사용됩니다. 피봇 포인트는 시장 심리와 잠재적 반전 영역을 평가하는 프레임워크를 제공합니다. 이렇게 계산된 값을 기반으로 눈송이와 해 신호가 활성화 됩니다.
오버히트 쿨다운 피봇: 는 과매수 또는 과매도 상태에서 거래량이 감소할 때 시장 피로 지점을 포착하여 잠재적 반전 지점을 신호합니다. 이러한 피로 지점을 식별함으로써 인디케이터는 트레이더가 시장의 전환점을 보다 효과적으로 예측할 수 있도록 돕습니다. 그렇게 추세 반전의 신호로 녹색 또는 붉은색 삼각형 시그널이 뜹니다. 과열된 시장이 냉각되는 포인트를 찾는점에서는 곰돌이 송아지 신호와 비슷하지만 거래량을 기반으로 하고 있기 때문에 명백히 다른 시그널이며 신뢰도는 약간 낮을 수도 있습니다
실용적 적용:
이 인디케이터를 사용함으로써, 트레이더는 신호의 신뢰도에 따라 베팅 크기를 전략적으로 조정할 수 있습니다. 여러 신호가 동시에 나타날 때, 이는 추세 반전의 가능성이 높음을 나타내며, 더 큰 포지션 크기를 허용합니다. 반대로, 신호가 독립적으로 발생할 때는 낮은 가능성을 나타내므로 작은 포지션 크기가 적합합니다. 이 접근 방식은 트레이더가 효과적으로 리스크를 관리하고 높은 확률의 거래 기회를 활용하면서 거래 빈도를 과도하게 줄이는 것을 방지할 수 있게 합니다.
매매방법:
기본적인 세팅은 비트코인 15분 타임프레임이며 제작자는 단타를 추천합니다. 포지션 진입시 시그널이 1개가 뜬다면 거래량과 지지와 저항라인을 확인하고 손익비를 계산후 낮은 배팅 비율로 포지션에 진입합니다. 만약에 3개의 시그널이 동시에 활성화 된다면 보다 높은 비율로 포지션에 진입합니다.
신뢰도 순서:
]🐻🐮 > ❄️☀️ > 🔻🔺(초록 삼각이모지가 없기때문에 이것으로 대체)
이 지표는 여러 잠재적인 시장 반전 및 추세 지속성을 감지하는 강력한 방법을 제공합니다.
참고: 현실적인 기대를 가지고 기술 분석 도구의 한계를 이해하십시오. 이 지표는 시장 움직임을 보장하는 예측이 아니라 거래 결정을 돕기 위한 도구입니다.
경고! 절대 이 지표만을 가지고 매매하지 마십쇼.
추가적으로 제작자는 지표 세팅에 허접이라 꼬우면 당신이 세팅하십쇼! 감사합니다!

Multi PivotsThis script is meant for day traders. It's based on the CPR concepts. The pivots plots based on the timeframe, means less that 15minuts it will plot daily pivots, less that daily tf, it plots weekly and then monthly. It also includes Camarillas, ADR levels, Fibonacci levels based on last 500 candles, Fib pivots, Pivot zones, developing pivot, Vwap, Dashboard shows RSI,ADX,Vwap,SuperTrend and day price difference. Options available to plot Day HighLow, Initial Balance levels as well. There is option to show running CPR which highlights virgin CPR. It can plot next day pivots as well
I dont own any of codes or ideas in the script. Codes are taken from different scripts and altered based on the requirements. Kudos to all the great pinecoders who provided their codes as public which helps everyone. Thanks

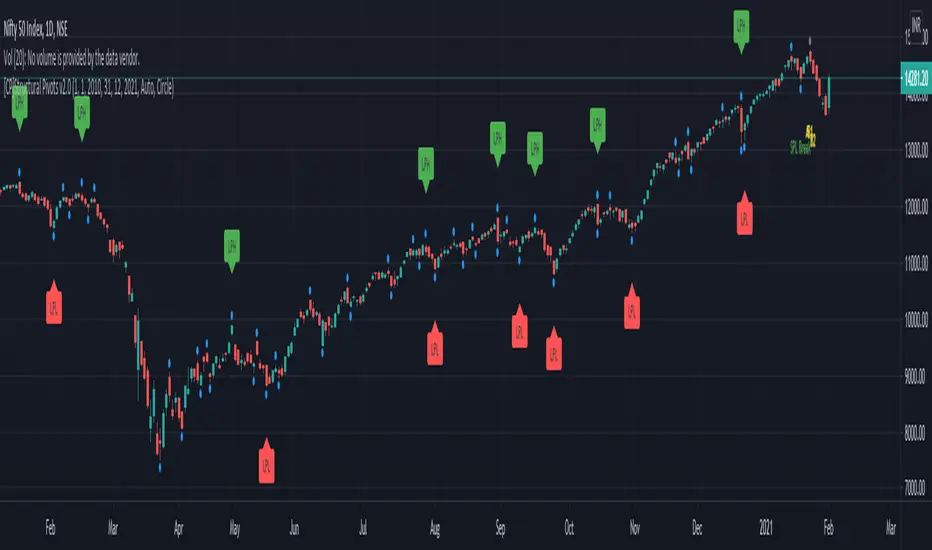
[CP]Structural Pivots v2.0This script marks structural pivots on a chart.
Script marks namely 4 types of pivots,
Structural Pivot High (SPH)
Structural Pivot Low (SPL)
Large Pivot High (LPH)
Large Pivot High (LPL)
SPL (Blue circles at bar low) is marked by finding a combination of 3 bars, an Anchor Bar, Bar 1 and Bar 2.
Bar 1 and Bar 2 should have a higher high and a higher close relative to the Anchor Bar in order to qualify as a legitimate SPL .
Reverse conditions are required for a point to be marked as SPH (Blue circles at bar high).
The complication happens for the fact that Anchor Bar, Bar 1 and Bar 2 need not be consecutive.
They can be far apart from themselves.
To solve this problem, the script generates 3-bar Combinations of all the bars from the last pivot to the current bar.
LPH are marked when an SPL gets broken (price goes below the previously marked SPL).
LPL are marked when an SPH gets broken (price goes above the previously marked SPH).
Unlike 'regular' methods of quantifying breakouts and trailing stops by optimizing various parameters of indicators, this method essentially
finds out swing highs, swing lows and S/R breaks.
One way to use the pivots is to go long when the LPH is broken, and trail the price with SPLs.
Vice-versa for shorts.
PM me on TradingView to obtain access.
Please don't ask for access in the comments section.
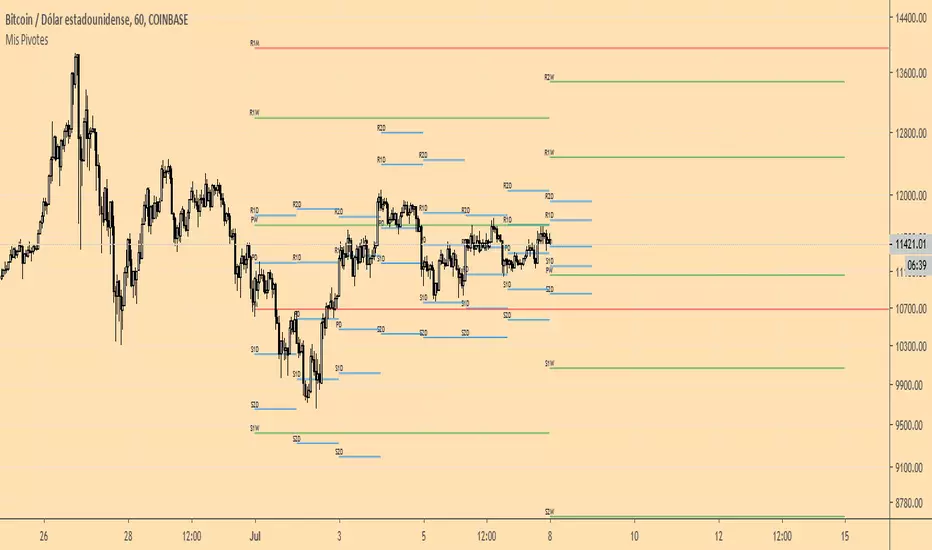
Mis PivotesPrimera prueba de ploteo de objetos line y label introducidos en PineScript v4.
Puntos Pivote tradicionales diario, semanal y mensual.
SVE Pivot PointsSVE Pivot Points are a modified variation of traditional pivot points created by Sylvain Vervoort (SVE). They are designed to adapt more dynamically to price volatility and short-term market structure, giving traders more responsive support and resistance levels.
Unlike standard floor pivots that rely only on the previous period’s high/low/close, SVE Pivot Points incorporate volatility-based smoothing, making the levels more stable during choppy markets and more reactive when volatility expands.
1. Volatility-Adaptive Formulas
SVE uses smoothing techniques (often EMA-based or Vervoort’s proprietary volatility filters) that adjust to current market noise.
This reduces false levels and gives clearer reaction zones.
2. Dynamic Support & Resistance
You still get:
• Pivot (P)
• Support levels (S1, S2, S3)
• Resistance levels (R1, R2, R3)
But they update based on volatility-weighted highs/lows instead of raw numbers.
3. More Reliable in Intraday Trading
SVE pivot points were designed to:
• Improve accuracy
• Reduce whipsaw
• Give better intraday turning points
This is why they’re popular among futures, forex, and index traders.

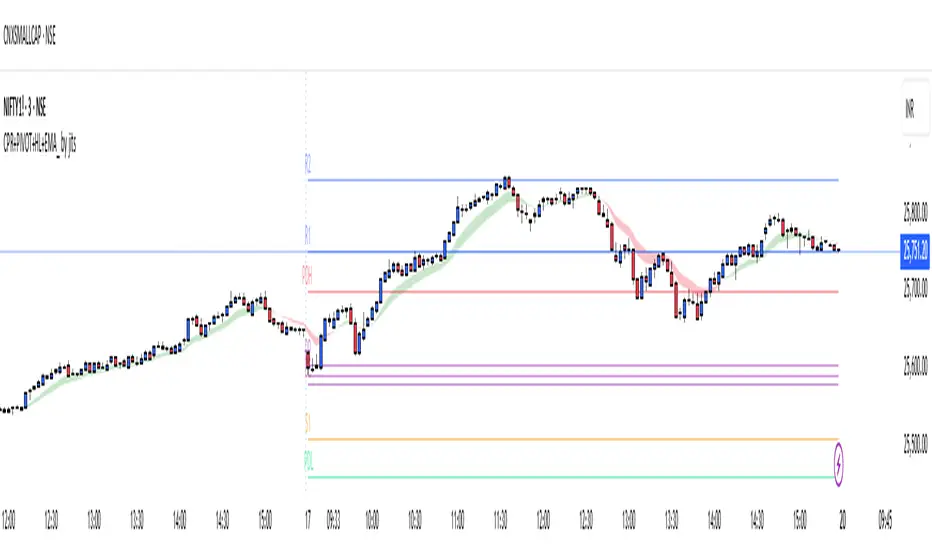
CPR+PIVOT+HL+EMA_ by Jit'sThe **CPR+PIVOT+HL+EMA_ by Jit's** is a custom Trading View indicator designed especially for **index intraday trading** (like NIFTY, BANKNIFTY, and FINNIFTY). It integrates four powerful analytical components—Central Pivot Range (CPR), Pivot Points, Previous Day High/Low, and 9/15 Exponential Moving Averages (EMA)—to provide traders a comprehensive market structure and trend confirmation tool.
Core Components
**1. Central Pivot Range (CPR)**
The CPR forms the central structure of this indicator. It is derived from the previous day’s **high, low, and close** values:
- Pivot (P) = (H + L + C) / 3
- Bottom Central (BC) = (H + L) / 2
- Top Central (TC) = (P - BC) + P
These three levels together represent the market’s “value area.”
A **narrow CPR** suggests a potential trending day ahead, while a **wide CPR** indicates likely consolidation.
**2. Pivot Points & Support/Resistance Levels**
The indicator extends beyond CPR by adding **traditional or Fibonacci pivots**, dynamically plotting resistance (R1–R5) and support (S1–S5) zones. These levels assist in spotting breakout levels and intraday reversal zones.
**3. Previous Day High and Low (PDH/PDL)**
These levels are essential for understanding market context. When price stays **above PDH**, it often signals strong bullish momentum; breaking **below PDL** indicates bearish pressure. Many traders use PDH/PDL along with CPR as key validation points for entries or exits.
**4. EMA (9 and 15 periods)**
The moving averages provide short-term trend confirmation.
- **EMA(9)** captures immediate momentum.
- **EMA(15)** represents short-term trend alignment.
A crossover of EMA(9) above EMA(15) usually supports a **buy signal**, while the opposite indicates a sell bias.
Use Case in Index Trading
This indicator setup is highly suited for **index-based intraday trading** because:
- CPR gives a bias for the day (bullish/bearish).
- PDH/PDL exhibit clear breakout or reversal areas.
- EMAs refine timing for entry/exit.
- Pivot levels mark precise target and stop zones.
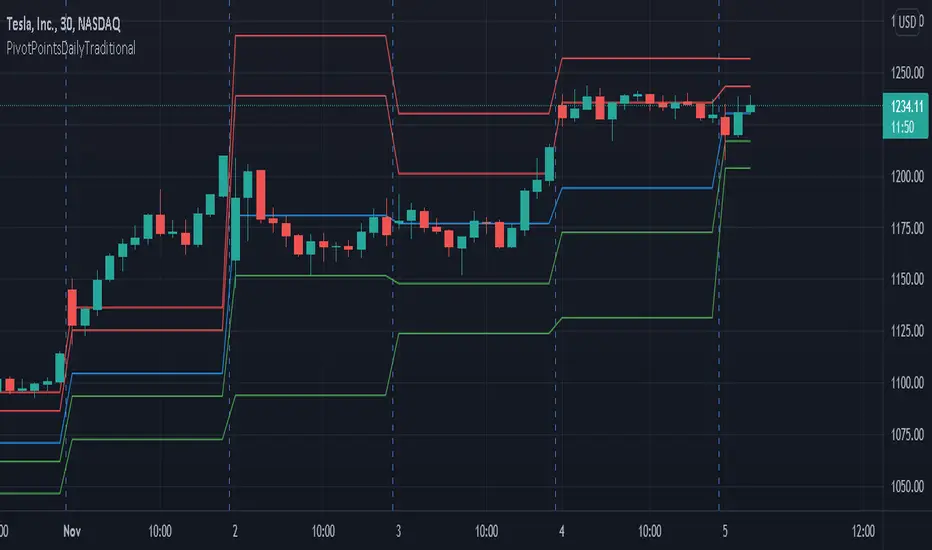
PivotPointsDailyTraditionalLibrary "PivotPointsDailyTraditional"
Provides the traditional daily pivot values and a pivot vacinity function.
P(level, daysPrior) Returns the P value.
Parameters:
level : The level to caclulate.
daysPrior : The number of days in the past to do the calculation.
R(level, daysPrior) Calculates the R value for a given pivot level.
Parameters:
level : The level to caclulate.
daysPrior : The number of days in the past to do the calculation.
S(level, daysPrior) Calculates the S value for a given pivot level.
Parameters:
level : The level to caclulate.
daysPrior : The number of days in the past to do the calculation.
vacinity(value, daysPrior, maxLevel) Returns a value representing where the provided value is in relation to each pivot level.
Parameters:
value : The value to compare against.
daysPrior : The number of days in the past to do the calculation.
maxLevel : The maximum number of pivot levels to include.
K3 W M Q Y PivotsMultiple Pivot Points Chart Overlay. Great for finding potential "decision" zones and possible reversals. Most powerful when multiple timeframe Pivots are clustered.
Black = Pivot
Bright Green = S1
Bright Red = R1
Dark Green = S2
Dark Red = R2
Another Chart showing the power of Pivot confluences:

Daily Pivot Breakout Strategy IndicatorTagline:
A pivot-based breakout system that identifies confirmed daily breakouts with momentum and volume filters, with precise entry timing across all timeframes.
How It Works:
This indicator detects strict pivot high breakouts on daily data, filtered by Rate of Change (ROC ≥30%) and Relative Volume (RVOL >1). It displays both the breakout confirmation signal and the next-day entry signal directly on your chart, regardless of timeframe.
Visual Signals:
Orange Pivot Line: The most recent confirmed pivot high (within 250-day lookback)
Day-0 Label (Teal): Appears on the breakout confirmation day (when price closes above daily pivot with filters met)
Entry Banner (Green): Appears on the next trading day at market open - your actual entry point
Cross-Timeframe Consistency:
Daily Chart: View the big picture - Day-0 on breakout bar, Entry on next bar
Any Timeframe: Logic remains consistent to daily pivots and data, signals adapt to show at the correct time
Built-in Alert Conditions:
5PivotBreakout_Scan (Day-0): Fires when breakout is confirmed. Use this for after-hours scanning to build watchlists of confirmed breakouts
5PivotBreakout_Strategy (Next): Fires at market open the next day. Use this to automate entries on confirmed breakouts
Typical Workflow:
Set up Day-0 alerts on your watchlist to catch breakouts as they happen
Review confirmed breakouts each evening
Set up Entry alerts on selected tickers to automate next-day execution (fires at market open)
Optional: Convert to strategy() for backtesting with custom exits (20% trail is good)
Key Features:
Strict pivot detection: No ties allowed - center must be highest point
Momentum filter: 100-day ROC ensures trending strength
Volume confirmation: 20-day RVOL validates participation
No repainting: Uses lookahead_off for realistic, tradeable signals
Customizable Inputs:
Pivot strength parameters (left/right bars)
Pivot lookback period
ROC period and minimum threshold
RVOL period
Toggle visibility of pivot line and labels
Note: This indicator is for educational purposes only and does not constitute financial advice. Past performance does not guarantee future results. Always test thoroughly before live trading.

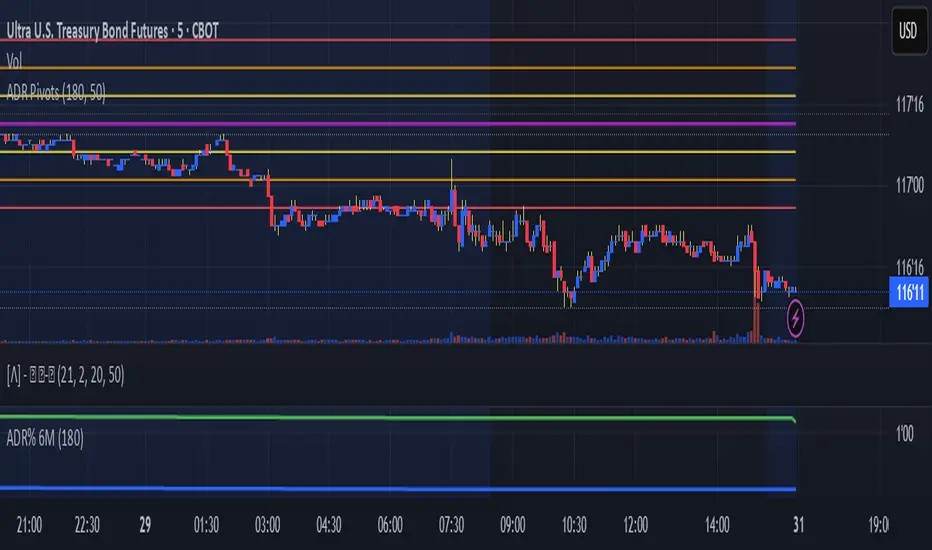
JoeySS Daily Pivot PointsDaily Pivots based on ADR with mods to ADR calcs. Pivot is based on previous day VPOC. Levels should encompass expected daily range based on the ADR calculations.
Auto-Trend Finder (Pivot + ADX)Inspired in part by LuxAlgo Trendlines with Breaks. Extended and enhanced for directional clarity and pivot-based precision.
🔍 What It Does
The Auto-Trend Finder (Pivot + ADX) is a smart trend-detection toolkit that combines:
Pivot-based swing detection (HH, HL, LH, LL)
ADX-filtered trendline projections
Custom slope estimation using ATR, Standard Deviation, Linear Regression, or a blended approach
Candlestick pattern detection for added confirmation (e.g., hammer, engulfing, shooting star)
📈 How It Works
1. Swing Detection
Uses ta.pivothigh / ta.pivotlow to mark major price turning points.
Labels pivots as Higher High (HH), Lower High (LH), Lower Low (LL), or Higher Low (HL).
Optionally overlays basic candle pattern names for visual context.
2. Trendline Logic
Connects successive pivot highs/lows with real-time trendlines.
Draws separate Uptrend and Downtrend lines with distinct colors.
3. Extended Projections
Projects extended dashed lines from the last pivot using slope formulas:
ATR-based (volatility)
Stdev-based (dispersion)
Linear Regression (trend best-fit)
Or a Combined slope using user-defined weights.
Color changes dynamically on breakout to visually signal momentum shifts.
4. ADX Trend Strength Filter
Optional ADX filter disables trendline updates unless directional strength exceeds a threshold (e.g. 20+).
Helps remove noise in sideways markets.
⚠️ Important Notes
Backpainting Warning: This script includes a backpainting setting (backpaint) that may cause lines to appear "reliably predictive" in historical data. Backpainting does not repaint once the pivot is confirmed, but it still reflects a post-fact state. Use this feature cautiously in live trading decisions.
Reused Code Attribution: Extended trendline concept and breakout color logic were inspired by publicly available open-source versions of LuxAlgo's trendline logic. Credit is given in the script comments and here as required.
🛠️ How to Use It
Adjust Pivot Length for swing detection sensitivity.
Toggle ADX filtering on or off to avoid choppy signals.
Choose your preferred Slope Calculation Method.
Use candlestick labels as potential entry signals near trendline retests or breaks.
✅ Why This Is More Than a Mashup
This tool integrates several separate technical methods into one cohesive, customizable framework:
It’s not just combining indicators, it’s engineering synergy between them.
The slope and ADX filtering mechanics dynamically adjust to trend strength.
Candlestick confirmation and labeling give visual, real-time trade confidence.
It enhances open-source logic by adding modular slope options, ADX gating, pattern labeling, and user control.
"Know the structure. Follow the strength. Trade with clarity. Auto-Trend Finder is your edge in the chaos."

Ely Waves PivotsThese pivot points are used to create an expected range based on open and closing candle data. It's a mixture of two different types of pivots and together they form an expected range for various time frames. You can set them up from as little as 4 hours to 1 month. My personal favorites are 4 hour, 1 day, 1 week, and 1 month.
The dashed lines create the pivot area for the time frame chosen, and the thick lines create the expected high and low for the chosen time frame.
These are very powerful if used correctly!
Hope you enjoy!

MI Pivot Points with mid-pivotsJust a standard daily pivot point indicator but I have added mid-pivots as they are critical to my intraday fx trading.
TradeX Labs Pivot MasterLucrorStrategies — Automated Price Action Execution Framework
This indicator-strategy automation is built for traders who want a simple, consistent, and rules-based trading system—no multi-timeframe chaos or overcomplicated confirmation layers. It trades purely from prior-day price action, keeping volatility, structure, and logic constant across all sessions.
Every entry, stop, and target comes directly from the same volatility-adjusted model. If the trade can’t fit your defined dollar risk, it simply won’t execute or plot.
⸻
IMPORTANT NOTE
***Since TradingView utilizes close of bar for plots, this is best utilized for real time entry/exit signals on 1 second charts or lower. If you do not have 1 second charts we can not recommend you to upgrade your subscription but we HIGHLY recommend utilizing this script on a 1 second chart. If utilizing on any higher time frame any signals or trade logic will be delayed and inaccurate or signals can be entirely skipped altogether and populate incorrect entries***
⸻
Purpose & Core Design
The framework is anchored to prior-day settlement data and mathematically transforms it into real-time, session-specific trading levels. This creates a daily map of opportunity that evolves with volatility while maintaining a consistent structure.
This approach eliminates guesswork and ensures the same conditions that produced historical edge apply to every live session.
⸻
Key Inputs & Control
1. Dollar Risk
Set your maximum dollar risk per trade. The system automatically sizes positions to stay at or below that risk limit based on stop distance.
• If the trade qualifies: a red-to-green gradient fill and entry label appear.
• If not: no fill, no entry, no false visual signals.
2. Timer Exit (Default: 30 Minutes)
The strategy is designed for momentum capture in the first 30 minutes after market open. If a trade remains active beyond that time, it is closed automatically.
All back tests and live reports reference this same window to maintain integrity. (Adjustable if you wish.)
3. Days to Keep Lines
Controls how many sessions of plotted levels and fills stay visible (up to 10).
To explore further back, use TradingView’s replay mode. The indicator will continue plotting as far as platform data allows.
4. Font & Label Size
• Price Label Size: Adjusts the numerical price levels beside pivots for manual pre-market entries.
• Level Label Size: Controls the on-chart text size for active trade signals. Both fully customizable.
⸻
Level Structure & Trade Mechanics
All plotted levels originate from a proprietary prior-day volatility formula. You will see:
• Middle Green Horizontal Lines — Support Levels
These mark historically reactive zones where price has a higher probability of holding or bouncing.
• Middle Blue Horizontal Lines — Resistance Levels
These represent opposing zones where price tends to reject or stall.
(Solid and dotted variants handle different roles in execution logic.)
• Red Horizontal Lines — Points of Control (POC Zones)
These are high-impact levels where price historically either rejects violently or breaks with strength.
⸻
Trade Logic
Long Trades
• Trigger: The solid blue line above the current structure acts as the long trigger.
• Stop: The solid blue line below is the stop-loss.
• Target: The next solid blue line above serves as the target.
Long trades are executed when price hits the solid blue trigger above the current level, using solid levels exclusively for entry, stop, and target.
Short Trades
• Trigger: The dotted blue line below the current structure is the short trigger.
• Stop: The dotted blue line above is the stop-loss.
• Target: The next dotted blue line below becomes the target.
Short trades use only dotted levels to define all key mechanics — entry, stop, and target — keeping short setups visually distinct and structurally independent from longs.
This dual structure allows for clean, symmetrical trade logic across both sides of the market, with consistent volatility mapping from prior-day data.
⸻
High-Priority Red Levels (Points of Control)
Red horizontal levels represent areas of major interest — typically where institutional activity concentrated previously. Price often reacts sharply here: either reversing instantly or breaking through with momentum.
These are optional reference points but often signal where the strongest reactions occur.
⸻
Visualization & Behavior
• Executed trades show the red-to-green gradient fill.
• Trades that exceed risk parameters simply do not appear.
• Levels remain clean and persistent day to day for back testing, journaling, or educational
use.
⸻
Disclaimer
This is a closed, proprietary LucrorStrategies tool. It is provided for analytical and educational use only. It does not predict price or guarantee profit. All trade execution, configuration, and outcomes remain the responsibility of the user.
