RSI + Stochastic для M1 скальпингаRSI + Stochastic for M1 Scalping
This indicator combines Relative Strength Index (RSI) and Stochastic Oscillator into a single tool designed specifically for short-term scalping on the 1-minute chart. While both oscillators are widely used, they often produce many signals on their own. This script focuses on signal confirmation through synchronization, which reduces false entries and helps scalpers react faster in fast-moving markets.
How it works
RSI (7-period by default) tracks short-term momentum and highlights overbought (>70) or oversold (<30) conditions.
Stochastic Oscillator (%K = 5, %D = 3, smoothing = 3) adds sensitivity to micro-swings, providing context for intraday momentum.
The indicator generates a visual background highlight only when both oscillators confirm the same condition:
Green zone → RSI and Stochastic are both oversold, suggesting potential exhaustion of downward pressure.
Red zone → RSI and Stochastic are both overbought, indicating potential exhaustion of upward pressure.
Why this mashup is different
Rather than simply plotting RSI and Stochastic together, this tool emphasizes confluence-based filtering:
Signals appear only at extreme conditions across both oscillators, which helps reduce market noise common on M1 charts.
Background coloring makes it easier to spot high-probability setups visually, without needing to interpret multiple plots separately.
The parameter defaults are optimized for scalping strategies, but users can adjust them to fit their style.
How to use
Best suited for M1 and M5 timeframes where overbought/oversold conditions appear frequently.
Can be used to time entries and exits around support/resistance or trend continuation zones.
Works well as a confirmation filter alongside price action or volume-based indicators.
⚠️ Disclaimer: This indicator does not guarantee profitable trades. Always test on demo accounts and combine with risk management before applying to live markets.
חפש סקריפטים עבור "rsi"

RSI 20/80 Arrows + AlertsRSI 20/80 Arrows + Alerts
This indicator is a modified Relative Strength Index (RSI) tool designed to help traders spot potential overbought and oversold conditions using customizable threshold levels (default 80 for overbought, 20 for oversold).
Features:
Custom RSI Levels – Default to 80/20 instead of the standard 70/30, but fully adjustable by the user.
Visual Signals –
Blue Arrow Up appears below the bar when RSI crosses up from below the oversold level (potential buy zone).
Red Arrow Down appears above the bar when RSI crosses down from above the overbought level (potential sell zone).
Alerts Built In – Receive notifications when either signal occurs, with the option to confirm signals only on bar close for reduced noise.
Guide Levels – Optionally display overbought/oversold reference lines on the chart for quick visual reference.
Overlay Mode – Signals are plotted directly on the price chart, so you don’t need to switch between chart windows.
Use Case:
Ideal for traders who want quick, visual confirmation of potential turning points based on RSI, especially in strategies where more extreme levels (like 20/80) help filter out weaker signals. Works well across all markets and timeframes.

RSI Zones - Directional Entry Strict RSI Zones – Directional Entry Tool (Modified RSI)
This is a simple modification of the standard RSI indicator. I’ve added two custom horizontal lines at the 60–65 and 35–40 zones to help spot momentum shifts and potential reversal points.
60–65 zone: When RSI returns here from above 65, it often signals weakening bullish momentum — useful for spotting short opportunities.
35–40 zone: When RSI returns here from below 35, it can indicate momentum loss on the downside — good for potential long setups.
This version helps traders filter out weak signals and avoid chasing extreme moves.
It works best when combined with price action, structure, or divergence.
Only 2 lines were added to the default RSI for better zone awareness. Everything else remains unchanged.

RSI Orderflow S/R LinesRSI Orderflow S/R Lines is a lightweight, overlay-style indicator that automatically marks short-term support and resistance levels derived from momentum shifts in the 14-period Relative Strength Index. Instead of relying on raw RSI values, the script tracks the change in RSI from one bar to the next (ΔRSI). When this one-bar delta exceeds a user-defined positive threshold, it treats the surge in buying momentum as a potential support zone and drops a horizontal line at that bar’s close. Conversely, when ΔRSI falls below the negative of the threshold, the script interprets the selling pressure as a resistance cue and plots a line at that close.
Two simple inputs keep the tool highly configurable. “RSI Δ Threshold” (0–20) lets you dial in how sensitive the signal is: lower values will print levels more frequently, while higher settings focus only on the most forceful momentum swings. “Max S/R Lines” (1–10) controls chart clutter by limiting how many active levels remain on the screen. As new signals emerge, the indicator adds fresh lines and automatically deletes the oldest ones once the user-set cap is reached.
Each level is dynamic in color: green whenever the current price trades above the line (acting as support) and red whenever price is below (acting as resistance). Because every line extends to the right indefinitely, the indicator gives you a clear, real-time view of recent momentum-based zones that may attract bids or offers on subsequent retests.
This approach can complement traditional technical analysis by highlighting hidden supply-and-demand pockets rooted in aggressive shifts in trader conviction. Combine it with price-action confirmation, volume patterns, or broader market structure to refine entries, exits, and stop placement. As always, test settings on your preferred markets and timeframes before committing real capital, and remember that no indicator guarantees future performance—sound risk management is essential.
RSI Convergence DivergenceRSI based oscillator inspired by the MACD.
Indicator that consists of two RSI calibrated at different lengths to take advantage of their convergence, divergence, overall direction, overall strength and several other metrics to extract signals from the price action.
This indicator includes:
- Fast RSI
- Slow RSI
- Signal line to identify convergence/divergence
- Simple moving average applied to the average of the two RSI
- DEMA applied to the average of the two RSI
- An average moving average of the SMA and DEMA
Some of the applications of this indicator:
- Simple convergence/divergence signaled by the moving average going above or below zero.
- Crossover between SMA and DEMA
- Combination of convergence/divergence and one of the 3 MAs reaching overbought or oversold threshold
- Average moving average going above or below 50
The combinations of different conditions are countless and limited only by the imagination of the user.
The visualization inputs, besides allowing to choose the candle coloring, give the user the ability to keep the chart clean and only see the signals he is interested into.

Negroni MA & RSI Strategy, plus trade entry and SL/TP optionsI will start with the context, and some things to think about when using a strategy tool to back-test ideas.
CONTEXT
FIRST: This is derived from other people's work, but I honestly hadn't found a mixed indicator MA strategy tool that does what this now does. If it is out there, apologies!!
This tool can help back-test various MA trends (SMA, EMA, HMA, VWMA); as well as factoring in RSI levels (or not); and can factor in a fixed HTF MA (or not). You can apply a 'retest entry' or a 'breakout entry', and you can also apply various risk mgt for SL/TP orders: 1) No SL/TP; or 2) a fixed %, or 3) dynamic ATR multipliers.
Find below, some details explaining what this tool is attempting to do.
Thank you, tack, salute!
THINGS TO REVIEW (it is not just about 'profitability'!!)
Whilst discretion is always highly encouraged as a trader, and a 100% indicator-driven strategy is VERY unlikely to yield sustainable results going forward, at the very least back-testing your strategies can help provide some guidance, not just on win rate Vs profit factor, but other things including:
a) Trade frequency: if a strategy has an 75% win rate and profit factor of 4, with all your parameters and confluence checks, but only triggers 3 trades every 5 years, is that realistically implementable to your trading situation if you have a $10,000 account?
b) Trade entry type: is it consistently better to wait for a retest of an 'MA zone', or is it better to market buy/sell on breakout of the 'MA zone'?
c) Risk management (SL/TP): is it consistently better to have a fixed static % for SL/TP ("I always place my stops 2% away, whether it is EURUSD or BTCUSDT"), or would you be better placed to try using an ATR multiplier of the respective assets?
d) Moving average type: is your old faithful 100 EMA really serving you well, or is the classic SMA more reliable, or how about the HMA, or the VWMA? Is the 100/200 cross holding up, or do you need something more sensitive? Is there any significant difference between a 10 EMA/20 EMA trend zone compared to a 13 EMA /25 EMA zone?
e) Confluence: Do added confluence checks (RSI, higher timeframe MA) actually improve profitability? But even if they do, is at the cost of cutting too many trades?
INPUTS AND PARAMETERS
Choice 1) Entry Strategy: Retest or Breakout - You can select both!
[ ]:
a) RETEST entry strat: price crosses UNDER FastMA INTO the 'MA trend zone'.
b) BREAKOUT entry strat: price crosses OVER FastMA OUT the 'MA trend zone'.
Choice 2) Risk Management (SL and TP) - You can select more than 1 strategy!
a) No SL/TP: Long trades are closed when the LOW crosses back UNDER the fastMA again, and shorts are closed when the HIGH crosses back OVER the fastMA again.
b) Static % SL/TP: Your SL/TP will be a fixed % away from avg. position price... WARNING: You should change this for various asset classes; FX vol is not the same as crypto altcoin vol!
c) Dynamic ATR SL/TP: Your SL/TP is a multiple of your selected ATR range (default is 50, see 'info' when you select ATR range). ATR accounts for the change in vol of different asset classes somewhat, HOWEVER... you should probably still not have the same multiplier trading S&P500 as you would trading crypto altcoins!
Then select your preferred parameters: EMA, SMA, HMA, VWMA, etc. You can mix and match, and most options have a info/tooltip guide.
RSI note: If you don't care for RSI levels, then set buy signal at 1... i.e always buys! Similarly set sell signal at 99.
ATR note: standard ATR length is usually 14, however... your SL/TP will move POST entry, and can tighten or widen your initial SL/TP... for better AND usually for worse! Go find a trade (strat 3) on the chart, look at the SL/TP lines, now change the number to 5, you'll see.
Fixed HTF MA note: If you don't care for HTF MA confluence, just change the timeframe/options to match the 'Slow MA' options you've chosen.

@thecf RSI + 12-EMA + Magic 89-EMA + RangesThis RSI has a couple modifications. It works with bullish and bearish control zones and implements both a 12 EMA as well as the "magic" 89 Moving Average.
First, the ranges. Whenever the RSI moves above 65 the bulls are in control.
Whenever the RSI moves blow 45 the bears are in control. Everything in between in neutral. Traders can use these levels for information on strength of either bulls or bears and also for support and resistance .
Both EMAs are best used for crossovers, as well as support and resistance .
The idea for the "magic" 89 moving average, originally stems from Fibonacci values that some traders like to use for support and resistance on price.
From observation, it holds more information though, when used as a moving average of the RSI and in combination with a 12 EMA .
When the RSI crosses above the 89 moving average, it can be interpreted as a potential shift in trend up. The 12 EMA then shortly afterwards usually confirms it by also crossing above the 89 moving average.
The 89 moving average can also signalize a potential shift in trend coming up when reaching 70.
The magic MA works best on timeframes like the daily and upwards.
For more information about the indicator feel free to leave a comment.

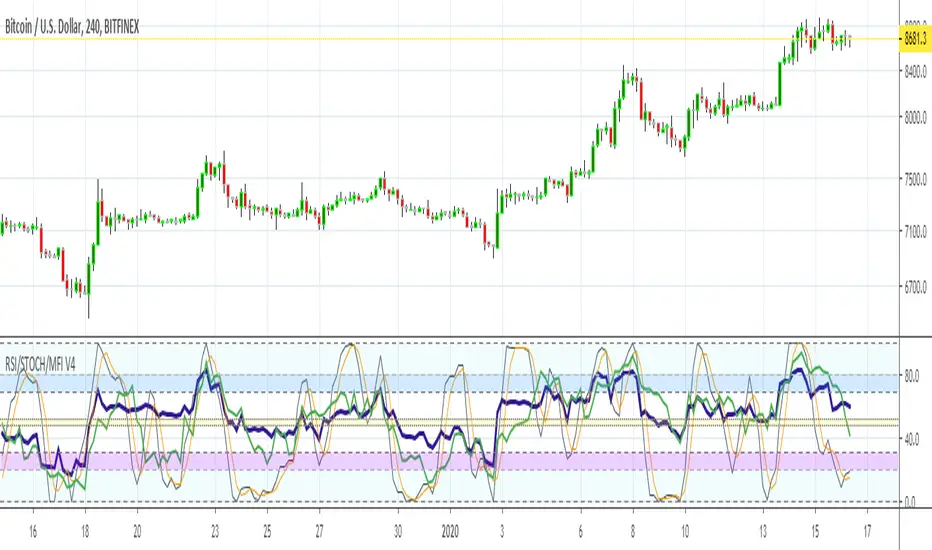
MFI RSI w STOCH OVERLAY V3Combines: Relative Strength (purple) and RSI Stoch (Orange/gray), Money Flow (green) all in one indicator window.
On screen indicator text identifier will read in this order: "RSI/STOCH/MFI V3"
// Changes from original version \\
It was important to bring forth the RSI indicator as the most visually important line and its relationship to the background.
A: Major visual changes from my first published one..as default now
1: Increased RSI line to size 3
2: Increased MFI line to size 2
3: Separated all Bar Line Fields in the background for custom editing, total of 5 now. Much easier to distinguish when the RSI enters these fields.
B: Other major changes as default now
1: Sped up the indicators from 14 to 11, for quicker response. (user can adjust back to 14 or another number)
2: Increased user friendly inputs to adjust colors, lines, data, etc.
3: (darken / lighten and change background colors, increase/decrease line strengths and colors, adjust field data inputs)
Enjoy and Good Luck Trading.
RSI Bands, RSI %B and RSI BandwidthRSI bands provide an intuitive way of visualizing how the price movement causes RSI to move with in its range (0-100). Upper/Lower bands signify overbought and oversold levels respectively (Default: 70/30, you can customize them via options page). These bands closely match what Constance Brown explains in her book "Technical Analysis for the Trading Professional".
I have also coded up 2 scripts to visualize %B and Bandwidth, just as in BollingerBands. As you can see %B is equivalent to the actual RSI. Along with RSI_Bandwidth and %B, the bands convey a lot of information.
Another tip is to render Bollinger Bands along with RSIBands...endless possibilities :)
I have included all 3 scripts in the same chart, as they are all related. Since TradingView doesn't allow sharing more than one script in the same chart, you can only "Add script" RSI Bands.
If you want to use RSI %B and Bandwidth, follow this guide to "Make mine" this chart and get access to the source:
drive.google.com
For the complete list of my indicators, check this post:

RSI Dip Reversal Pro ScannerRSI Upside Reversal Scanner (High Accuracy)
This indicator is designed to detect early-stage upside reversals by identifying when RSI crosses upward from oversold levels while the price remains positioned in the lower portion of its recent range. It combines momentum shift with price location analysis to produce highly reliable reversal signals.
It uses 3 primary filters:
RSI Oversold Cross:
RSI must cross upward from the oversold threshold (default 30).
Price in Bottom Range:
Price must be located within the lower 40% of the last 20-bar range, indicating a discount zone.
Overbought Protection:
RSI must stay below the ceiling level (default 75) to prevent signals near top exhaustion.
When all criteria are met, the indicator plots a “GİRİŞ” (ENTRY) label below the candle.
This tool is ideal for:
Identifying accurate dip-buy zones
Capturing trend reversals early
Optimizing swing and scalp entries
Feeding systematic trading models or bots
It performs well on short- and mid-term timeframes.

RSI(Min-Max)RSI (Min-Max) is an enhanced version of Welles Wilder's Relative Strength Index, designed to offer greater analytical precision and dynamic insight into the behavior of the RSI within each candlestick.In addition to displaying the traditional RSI value, this script calculates the possible extreme values — the minimum and maximum RSI — based on the low and high prices of the current candle. This allows you to estimate how the RSI would react if the price moved to the extremes of the bar, providing a predictive and refined reading of momentum.

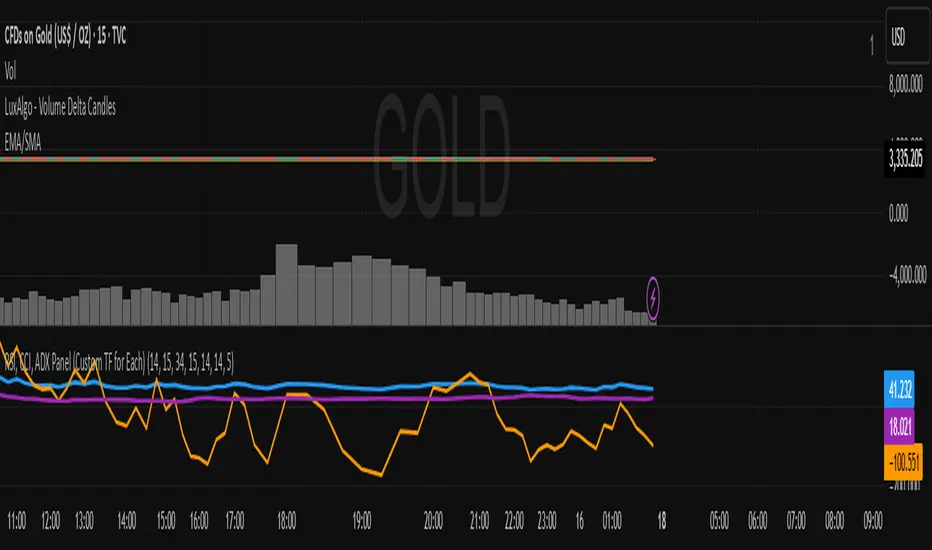
RSI, CCI, ADX Panel (Custom TF for Each)RSI, CCI, ADX Panel (Custom TF for Each)
This indicator combines RSI, CCI, and ADX into a single panel, allowing traders to view three key momentum/trend signals together. Each indicator can be calculated on its own custom timeframe, making it useful for multi-timeframe analysis.
Features:
RSI (Relative Strength Index): Measures momentum, useful for identifying overbought/oversold conditions.
CCI (Commodity Channel Index): Detects cyclical movements and potential reversals.
ADX (Average Directional Index): Evaluates trend strength without regard to direction.
Independent timeframe selection for RSI, CCI, and ADX.
Distinct colors for each indicator (RSI = Blue, CCI = Orange, ADX = Purple).
Single consolidated panel for compact analysis.
This tool is designed to give a multi-perspective view of market strength, momentum, and trend in one place.
RSI, Volume, MACD, EMA ComboRSI + Volume + MACD + EMA Trading System
This script combines four powerful indicators—Relative Strength Index (RSI), Volume, Moving Average Convergence Divergence (MACD), and Exponential Moving Average (EMA)—to create a comprehensive trading strategy for better trend confirmation and trade entries.
How It Works
RSI (Relative Strength Index)
Helps identify overbought and oversold conditions.
Used to confirm momentum strength before taking a trade.
Volume
Confirms the strength of price movements.
Avoids false signals by ensuring there is sufficient trading activity.
MACD (Moving Average Convergence Divergence)
Confirms trend direction and momentum shifts.
Provides buy/sell signals through MACD line crossovers.
EMA (Exponential Moving Average)
Acts as a dynamic support and resistance level.
Helps filter out trades that go against the overall trend.
Trading Logic
Buy Signal:
RSI is above 50 (bullish momentum).
MACD shows a bullish crossover.
The price is above the EMA (trend confirmation).
Volume is increasing (strong participation).
Sell Signal:
RSI is below 50 (bearish momentum).
MACD shows a bearish crossover.
The price is below the EMA (downtrend confirmation).
Volume is increasing (intense selling pressure).
Backtesting & Risk Management
The strategy is optimized for scalping on the 1-minute timeframe (adjustable for other timeframes).
Default settings use realistic commission and slippage to simulate actual trading conditions.
A stop-loss and take-profit system is integrated to manage risk effectively.
This script is designed to help traders filter out false signals, improve trend confirmation, and increase trade accuracy by combining multiple indicators in a structured way.

Gabriel's Cyclic Smoothed RSI [Enhanced]Overview
Gabriel's Cyclic Smoothed RSI (short title: cRSI ) is a sophisticated technical indicator developed to provide traders with deeper insights into market rhythms and price momentum. Building upon the traditional Relative Strength Index (RSI), this enhanced version incorporates dynamic cycle analysis, divergence detection, and optional stochastic oscillators to deliver a more nuanced understanding of market conditions.
Key Features
Cyclic Smoothed RSI (cRSI):
Adaptive Momentum: The cRSI adapts to the dominant market cycle, providing a smoothed RSI that reacts dynamically to price changes.
Ultra-Smooth & Zero-Lag: Designed to minimize lag, ensuring timely signals that closely follow price movements.
Accurate Divergence Detection: Identifies both regular and hidden bullish/bearish divergences, enhancing signal reliability.
Dynamic Overbought/Oversold Bands:
Customizable Thresholds: Set dynamic overbought and oversold levels based on market rhythm analysis.
Adaptive Bands: Bands adjust according to the dominant cycle, offering a more accurate representation of market extremes.
Stochastic cRSI & KDJ Oscillator (Optional):
Enhanced Oscillators: Incorporate stochastic and KDJ oscillators for additional momentum analysis.
Ribbon Displays: Visual ribbons provide clarity on oscillator trends and potential reversal points.
Divergence Detection:
Regular & Hidden Divergences: Detects both regular and hidden bullish/bearish divergences to anticipate potential trend reversals.
Customizable Lookback: Adjust pivot lookback periods to fine-tune divergence sensitivity.
Visual Enhancements:
Triangles & Labels: Visual signals in the form of triangles and labels indicate buy/sell opportunities and divergence events.
Bar Coloring: Option to color bars based on signal strength, providing immediate visual cues.
Alert Conditions:
Custom Alerts: Set up alerts for various signal types, including strong buy/sell signals and divergence events, ensuring you never miss critical market movements.
Input Settings
cRSI Settings
Source: Select the data source for calculations (e.g., Close, Open, High, Low, HLC3, OHLC4).
Dominant Cycle Length: Define the dominant market cycle length based on rhythm analysis.
Vibration: Adjusts the sensitivity of the cRSI to price changes.
Leveling %: Determines the percentage level for dynamic band adjustments.
Show cRSI Plot: Toggle the display of the cRSI line.
Show Cyclic Smoothed Bands: Toggle the display of dynamic overbought and oversold bands.
Show Trend Fill: Enable or disable the trend fill cloud between upper and lower bands.
MA Settings
MA Type: Choose the type of Moving Average (SMA, Bollinger Bands, EMA, SMMA (RMA), WMA, VWMA) to smooth the cRSI.
MA Length: Set the length of the Moving Average.
BB StdDev: Define the standard deviation multiplier for Bollinger Bands.
Show cRSI-based MA: Toggle the display of the cRSI-based Moving Average line.
Stochastic Settings
Show Stochastic cRSI: Enable the stochastic oscillator based on cRSI.
Ribbon: Enable ribbon display for the Stochastic oscillator.
Show KDJ: Toggle the display of the KDJ oscillator.
KDJ Ribbon: Enable ribbon display for the KDJ oscillator.
Stochastic Length: Set the length for the Stochastic calculation.
%K Smoothing: Define the smoothing period for %K.
%D Smoothing: Define the smoothing period for %D.
Stoch Scaling %: Adjusts the vertical scaling of the stochastic to prevent distortion.
Overbought/Oversold Settings
Overbought: Set the Overbought threshold for the cRSI.
OB Extreme: Define the Extreme Overbought threshold for the Stochastic cRSI.
Oversold: Set the Oversold threshold for the cRSI.
OS Extreme: Define the Extreme Oversold threshold for the Stochastic cRSI.
Divergence Settings
Pivot Lookback Right: Number of bars to the right of the pivot for divergence detection.
Pivot Lookback Left: Number of bars to the left of the pivot for divergence detection.
Max of Lookback Range: Maximum number of bars to look back for divergence detection.
Min of Lookback Range: Minimum number of bars to look back for divergence detection.
Plot Bullish: Enable plotting of bullish divergence signals.
Plot Hidden Bullish: Enable plotting of hidden bullish divergence signals.
Plot Bearish: Enable plotting of bearish divergence signals.
Plot Hidden Bearish: Enable plotting of hidden bearish divergence signals.
Delay Plot Until Candle is Closed: Prevents repainting by delaying the plotting of divergence signals until the candle is fully closed.

Multiple Ticker Stochastic RSIThe Stochastic RSI is a technical indicator ranging between 0 and 100, based on applying the Stochastic oscillator formula to a set of relative strength index (RSI). Unlike the original Stochastic RSI indicator, this allows you to define up to two additional tickers for which all three will be averaged and outputted visually looking like a standard Stochastic RSI indicator. Potential buy and sell visuals are included, as well as alerts. Please note that this indicator is not meant to be used by itself.

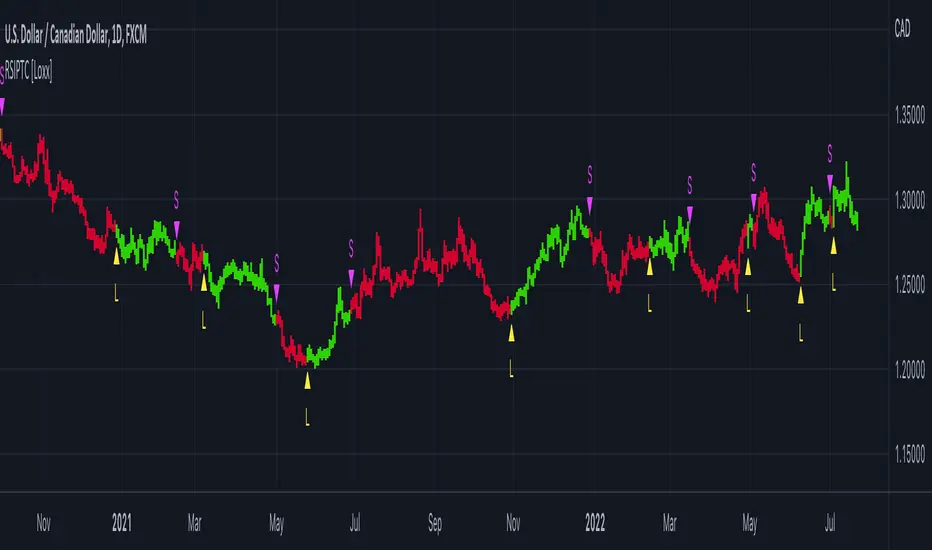
RSI Precision Trend Candles [Loxx]RSI Precision Trend Candles is a candle coloring indicator that uses an average range algorithm to determine trend direction. The precision trend algorithm can be used on any calculated output to tease out interesting trend information.
What is RSI?
The relative strength index (RSI) is a momentum indicator used in technical analysis. RSI measures the speed and magnitude of a security's recent price changes to evaluate overvalued or undervalued conditions in the price of that security.
The RSI is displayed as an oscillator (a line graph) on a scale of zero to 100. The indicator was developed by J. Welles Wilder Jr. and introduced in his seminal 1978 book, New Concepts in Technical Trading Systems.
Included
Bar coloring
Signals
Alerts
Loxx's Expanded Source Types
MACD + RSI with Trade SignalsThis indicator by default comes with the MACD shown but can be switched to show the RSI instead. Settings for each indicator can also be customized as well as Buy/Sell signals given based on pull back crossovers that follow the 200 EMA of the price Chart. There's an above/below middle fill option you can use but I tend not to but I know some traders like to see when an oscillator is above/below the middle and use it as a trend diretion. By the way, the fourth setting for the MACD (which is 2 by default) is the size of the histogram.
Buy Signal = Price is above the 200 EMA. Current or previous MACD or RSI line is/was below middle line and now crossed above the signal line.
Sell Signal = Price is below the 200 EMA. Current or previous MACD or RSI line is/was above middle line and now crossed below the signal line.
There are alerts for each signal as well (MACD and RSI, both buy and sell).
Feel free to leave a comment regarding issues or suggestions for this indicator or ideas for the next one I should do :)

ENVELOPE RSI - Buy Sell SignalsThis indicator is mainly based on Overbought and Oversold . Indicator for short-term trading. This way you can get small but acceptable signals.
The main basis of the indicator is as follows:
To buy, the indicator is waiting for the instrument to be oversold from the RSI point of view. Then, if the chart crosses the bottom line of the Envelope indicator from the bottom to the top, a buy signal is issued.
For sell, the indicator waits for the instrument to be overbought from the RSI perspective. Then, if the chart crosses the top line of the Envelope indicator from top to bottom, a sell signal is issued.
The general basis is the consonance of the price and the RSI indicator .
The best settings I came up with myself:
Time frame: 15 minutes
Overbought: 80
Oversell: 25
RSI Length: 8
It can be done on different instruments. But always set your profit and loss limits.
(Profit to loss ratio in this indicator can be 1: 1.)
Disclaimer : This information and trading indicators and tools provided neither is, nor should be construed, as an offer, or a solicitation of an offer, to buy or sell securities. You shall be fully responsible for any investment decision you make, and such decisions will be based solely on your evaluation of your financial circumstances, investment objectives, risk tolerance, and liquidity needs.
I am not liable for any profit, financial improvement, losses or damages, monetary or other that may result from the application of information contained within this indicator. Individual traders must use their own due diligence in analyzing featured trading indicators, other trading tools, webinars and other educational materials to determine if they represent suitable and useable features and capabilities for the individual trader.

MTF RSI + Average (Multi-Timeframe) [TH]Multi-Timeframe Relative Strength Index --- MTF RSI
Eliminates having to change time intervals to view a different Time Interval's RSI value (up to 5 time intervals possible through the settings).
The RSI values from Multiple Time Frames can be averaged together to show one single RSI.
A table overlay (info box) makes it easy to quickly identify RSI values on the multiple different time frames.

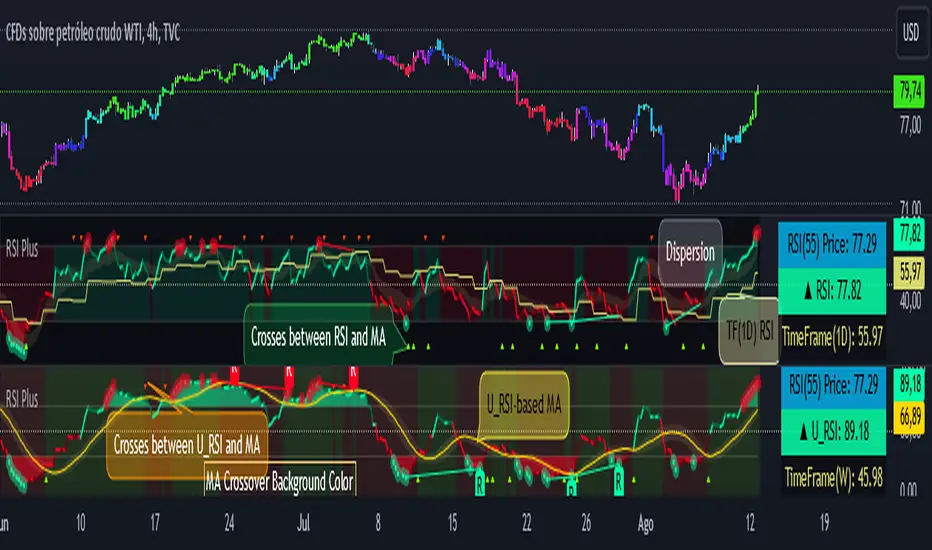
RSI PlusRSI Plus:
☑️ Show the divergences.
☑️ Shows the approximate price of an RSI level (by default it is level 55 but it can be changed for any other level).
☑️ Shows the bulls and bears zones, in green when crossing level 50 up and red when crossing down.
☑️ Circle the highest and lowest levels as possible purchases and sales.
☑️ Includes a smoothed RSI.
RSI Plus:
☑️ Muestra las divergencias.
☑️ Muestra el precio aproximado de un nivel del RSI (por defecto viene el nivel 55 pero se lo puede cambiar por cualquier otro nivel).
☑️ Muestra la zonas de toros y osos, en verde cuando cruza hacia arriba el nivel 50 y rojo cuando cruza hacia abajo.
☑️ Marca con un circulo los niveles mas alto y mas bajos como posibles compras y ventas.
☑️ Incluye un RSI suavizado.
RSI TrendsRSI is a momentum indicator, however most people seem to be using it to go against the momentum by trying to identify tops/bottoms using it. Its in my opinion the wrong way to be using it. It can be easily used for trend following which seems like a better use for it.
Uptrend - RSI > 60
Downtrend - RSI < 40
Sideways - RSI between 40 and 60
If however not interested in filtering for sideways trends and convert it to a long-short only strategy that stays in market all the time then it can be simply modified by setting both overbought/oversold thresholds to 50. In such a case uptrend will be above 50 and downtrend will be less than 50.
Note: wait for close for current bar to be confirmed as RSI is calculated at close

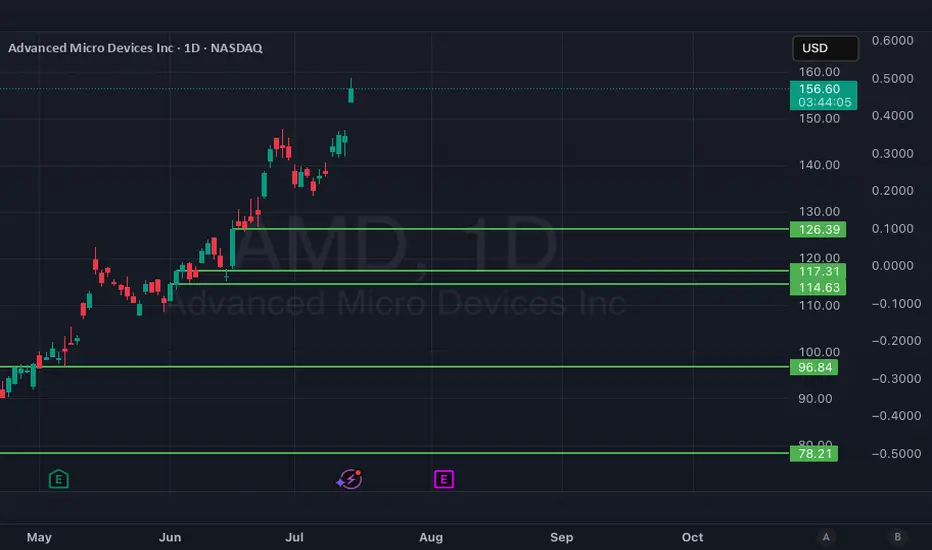
RSI LevelsRSI Levels
- The relative strength index ( RSI ) is a technical indicator used in the analysis of financial markets.
It is intended to chart the current and historical strength or weakness of a stock or market based on the closing prices of a recent trading period.
- This indicator allows us to visualize the levels of rsi in the chart, so that we can calculate take profit and stop points in a simple way,
knowing what position the price is currently in relation to these levels and how much space we have.
- We can also visualize the slope of the three levels of rsi , overbought, oversold and level 50, something that is not possible in the oscillator version.
- It allows you to display 2 rsi values at the same time.
- Allows to change the color of candlesticks based on rsi.

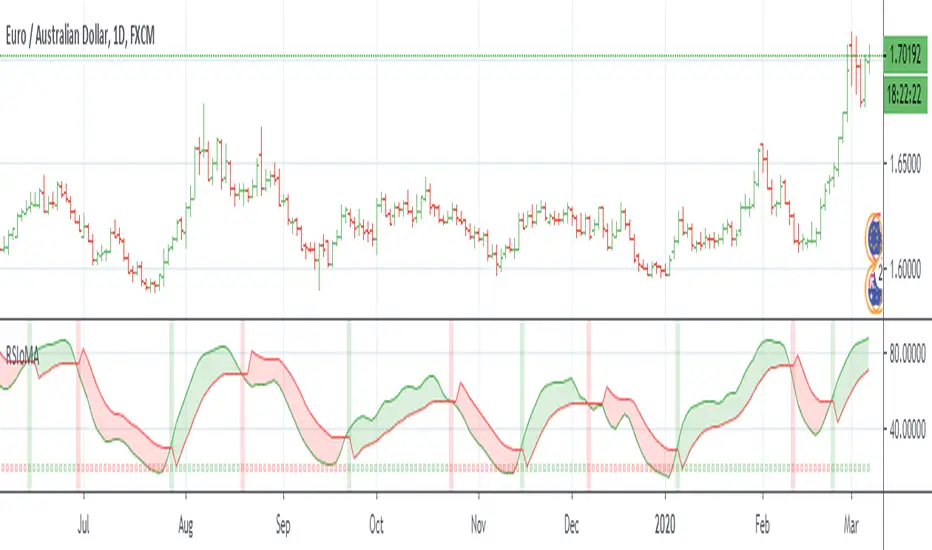
RSI of MAsRSI of MAs is designed to calculate the moving average for a specific period, and then take the RSI of that value. This script allows the user to select which moving average they would like to utilize for the calculation, as well as customizing how the Signal Line is calculated. There are many combinations available and you will need to tune the indicator to fit your trading style. The Signal Line is designed to indicate when there is a potential change in price action. If the Signal Line is below RSIoMA, price is bullish. If the Signal Line is above RSIoMA, price is bearish.
MA Period is the length/period the moving average is calculated with
RSI Period is the length/period the RSI is calculated with
RSI MA Mode determines which moving average is applied to the MA period
Signal Line determines which moving average or QQE is used to calculate the signal line
Signal Line Period is the length/period the Signal Line is calculated with
As always, trade at your own risk.
Multiple MA Options Credits to @Fractured
Signal Line Options Credits to @lejmer
Bits and Pieces from @AlexGrover, @Montyjus, and @Jiehonglim