Daily Short-Term Levels & Pivots with BOS/CHoCHDaily Short-Term Levels & Pivots with BOS/CHoCH
OverviewThis indicator combines essential tools for short-term and long-term traders, integrating Daily Short-Term Levels (NDCP), Pivots, and detection of Break of Structure (BOS) and Change of Character (CHoCH). Designed for TradingView, it’s ideal for scalping, day trading, and market structure analysis across any timeframe. It provides clear visualization of key levels, pivots, and structural patterns, with customizable settings to suit various trading styles.
Key Features
1. Daily Short-Term Levels (NDCP)
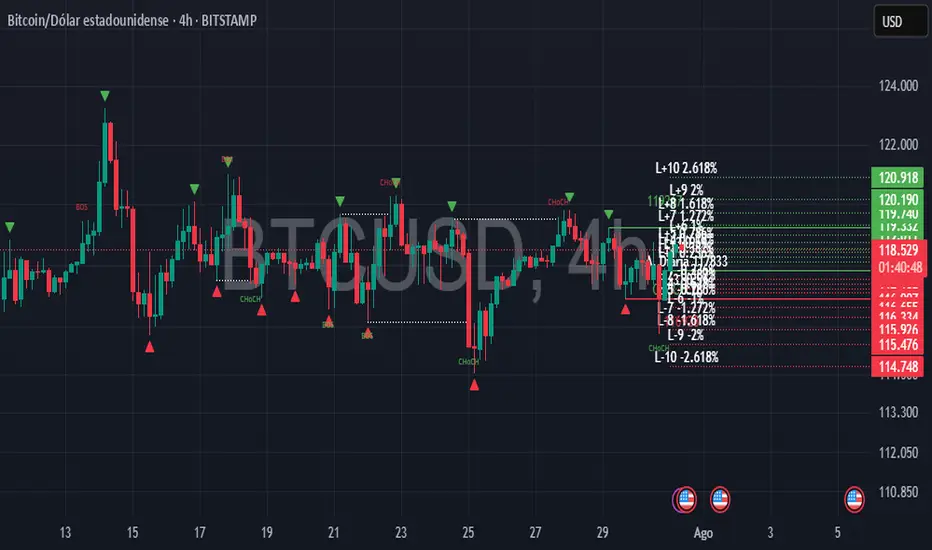
Purpose: Displays support and resistance levels based on the daily open, calculated as bullish and bearish percentages.
Levels: Up to 10 bullish levels (L+1 to L+10) and 10 bearish levels (L-1 to L-10), with configurable percentages (default: 0.236% to 2.618%).
Daily Open: A line marking the daily open price, with an option to display its value.
Customization:
Enable/disable levels and daily open.
Adjust colors, line thickness, and style (solid, dashed, dotted).
Position labels (Left, Right, Center) with adjustable offsets.
Show levels on all timeframes or only on daily and higher.
2. Pivots
Purpose: Identifies significant highs and lows (pivots) on the chart, useful for spotting reversal or continuation points.
Visualization: Green triangles (highs) and red triangles (lows) mark pivot points.
Customization:
Enable/disable pivot visualization.
Adjust the number of left and right bars to define pivots (default: 5 bars).
Change triangle colors.
3. Break of Structure (BOS) and Change of Character (CHoCH)
Purpose: Detects Break of Structure (BOS) and Change of Character (CHoCH) based on pivots, aiding in trend identification and reversals.
Visualization:
Resistance (green) and support (red) lines drawn from the latest pivots.
Labels for "BOS" (trend continuation), "CHoCH" (trend reversal), and "CD" (cross detected).
Historical CHoCH lines (optional, dotted) to track past structural changes.
Customization:
Enable/disable BOS/CHoCH and historical CHoCH lines.
Adjust colors and thickness for lines and labels.
Configure pivot sensitivity for BOS/CHoCH detection.
Indicator Settings
General Settings
Enable Daily Short-Term Levels: Toggle daily open-based levels.
Enable Pivots: Show triangles for significant highs/lows.
Enable BOS and CHoCH: Activate detection of structural breaks and reversals.
Daily Short-Term Levels
Show Daily Levels: Enable/disable bullish and bearish level lines.
Enable on All Timeframes: Display levels on intraday timeframes (e.g., 1M, 5M).
Text Color: Set the color for level labels.
Daily Open: Options to show the open line, its value, color, thickness, and style.
Label Alignment: Left (near daily open), Right (chart edge), or Center, with adjustable offsets.
Bullish/Bearish Levels: Configure percentages (0.236% to 2.618%), colors, line thickness, style, and value visibility.
Pivots and BOS/CHoCH
Pivot Colors: Green for highs, red for lows.
Left/Right Bars: Define pivot sensitivity (number of bars without breaking the high/low).
Show BOS: Enable labels for structural breaks.
Show Historical CHoCH Lines: Display dotted lines for past CHoCH events.
Colors and Thickness: Customize support, resistance, BOS, CHoCH lines, and "CD" labels.
How to Use
Add to Chart:
Search for "Daily Short-Term Levels & Pivots with BOS/CHoCH" in TradingView’s indicators and add it.
Initial Setup:
By default, daily levels, pivots, and BOS/CHoCH are enabled.
Adjust level percentages, colors, and styles to match your strategy.
Interpretation:
Daily Levels: Use bullish (L+1 to L+10) and bearish (L-1 to L-10) levels as support/resistance zones for entries, exits, or stops.
Pivots: Triangles mark key reversal or continuation points. Use them to confirm trends or identify high-probability zones.
BOS/CHoCH:
BOS: Indicates trend continuation (bullish if breaking a support, bearish if breaking a resistance).
CHoCH: Signals a potential trend reversal (bullish to bearish or vice versa).
CD: Confirms a pivot level cross, marking the start of a BOS or CHoCH.
Timeframes:
Ideal for scalping (1M, 5M) with "Enable on All Timeframes" activated.
Effective on higher timeframes (4H, D) for structural analysis.
Customization:
Adjust pivot bars (left_bars, right_bars) for more/less sensitivity.
Configure label offsets to avoid clutter on detailed charts.
Notes and Recommendations
Scalping: Use low timeframes (1M, 5M) with "Enable on All Timeframes" for visible daily levels. Set left_bars/right_bars to lower values (3-5) for faster pivots.
Swing Trading: On higher timeframes (4H, D), daily levels and BOS/CHoCH help identify key trend zones.
Avoid Clutter: If labels overlap, adjust offset_etiquetas, offset_derecha, or offset_centro, or select "Right" or "Center" alignment.
Testing: Experiment with percentage settings and styles to suit your market (Forex, stocks, crypto, etc.).
Limitations: On very low timeframes, pivots may be sensitive to noise. Increase left_bars/right_bars for more robust pivots.
Acknowledgments
Developed with passion for the TradingView community. I hope this indicator enhances your technical analysis! Feel free to leave feedback or contact me with suggestions or issues.
Happy trading!
חפש סקריפטים עבור "scalping"
Langlands-Operadic Möbius Vortex (LOMV)Langlands-Operadic Möbius Vortex (LOMV)
Where Pure Mathematics Meets Market Reality
A Revolutionary Synthesis of Number Theory, Category Theory, and Market Dynamics
🎓 THEORETICAL FOUNDATION
The Langlands-Operadic Möbius Vortex represents a groundbreaking fusion of three profound mathematical frameworks that have never before been combined for market analysis:
The Langlands Program: Harmonic Analysis in Markets
Developed by Robert Langlands (Fields Medal recipient), the Langlands Program creates bridges between number theory, algebraic geometry, and harmonic analysis. In our indicator:
L-Function Implementation:
- Utilizes the Möbius function μ(n) for weighted price analysis
- Applies Riemann zeta function convergence principles
- Calculates quantum harmonic resonance between -2 and +2
- Measures deep mathematical patterns invisible to traditional analysis
The L-Function core calculation employs:
L_sum = Σ(return_val × μ(n) × n^(-s))
Where s is the critical strip parameter (0.5-2.5), controlling mathematical precision and signal smoothness.
Operadic Composition Theory: Multi-Strategy Democracy
Category theory and operads provide the mathematical framework for composing multiple trading strategies into a unified signal. This isn't simple averaging - it's mathematical composition using:
Strategy Composition Arity (2-5 strategies):
- Momentum analysis via RSI transformation
- Mean reversion through Bollinger Band mathematics
- Order Flow Polarity Index (revolutionary T3-smoothed volume analysis)
- Trend detection using Directional Movement
- Higher timeframe momentum confirmation
Agreement Threshold System: Democratic voting where strategies must reach consensus before signal generation. This prevents false signals during market uncertainty.
Möbius Function: Number Theory in Action
The Möbius function μ(n) forms the mathematical backbone:
- μ(n) = 1 if n is a square-free positive integer with even number of prime factors
- μ(n) = -1 if n is a square-free positive integer with odd number of prime factors
- μ(n) = 0 if n has a squared prime factor
This creates oscillating weights that reveal hidden market periodicities and harmonic structures.
🔧 COMPREHENSIVE INPUT SYSTEM
Langlands Program Parameters
Modular Level N (5-50, default 30):
Primary lookback for quantum harmonic analysis. Optimized by timeframe:
- Scalping (1-5min): 15-25
- Day Trading (15min-1H): 25-35
- Swing Trading (4H-1D): 35-50
- Asset-specific: Crypto 15-25, Stocks 30-40, Forex 35-45
L-Function Critical Strip (0.5-2.5, default 1.5):
Controls Riemann zeta convergence precision:
- Higher values: More stable, smoother signals
- Lower values: More reactive, catches quick moves
- High frequency: 0.8-1.2, Medium: 1.3-1.7, Low: 1.8-2.3
Frobenius Trace Period (5-50, default 21):
Galois representation lookback for price-volume correlation:
- Measures harmonic relationships in market flows
- Scalping: 8-15, Day Trading: 18-25, Swing: 25-40
HTF Multi-Scale Analysis:
Higher timeframe context prevents trading against major trends:
- Provides market bias and filters signals
- Improves win rates by 15-25% through trend alignment
Operadic Composition Parameters
Strategy Composition Arity (2-5, default 4):
Number of algorithms composed for final signal:
- Conservative: 4-5 strategies (higher confidence)
- Moderate: 3-4 strategies (balanced approach)
- Aggressive: 2-3 strategies (more frequent signals)
Category Agreement Threshold (2-5, default 3):
Democratic voting minimum for signal generation:
- Higher agreement: Fewer but higher quality signals
- Lower agreement: More signals, potential false positives
Swiss-Cheese Mixing (0.1-0.5, default 0.382):
Golden ratio φ⁻¹ based blending of trend factors:
- 0.382 is φ⁻¹, optimal for natural market fractals
- Higher values: Stronger trend following
- Lower values: More contrarian signals
OFPI Configuration:
- OFPI Length (5-30, default 14): Order Flow calculation period
- T3 Smoothing (3-10, default 5): Advanced exponential smoothing
- T3 Volume Factor (0.5-1.0, default 0.7): Smoothing aggressiveness control
Unified Scoring System
Component Weights (sum ≈ 1.0):
- L-Function Weight (0.1-0.5, default 0.3): Mathematical harmony emphasis
- Galois Rank Weight (0.1-0.5, default 0.2): Market structure complexity
- Operadic Weight (0.1-0.5, default 0.3): Multi-strategy consensus
- Correspondence Weight (0.1-0.5, default 0.2): Theory-practice alignment
Signal Threshold (0.5-10.0, default 5.0):
Quality filter producing:
- 8.0+: EXCEPTIONAL signals only
- 6.0-7.9: STRONG signals
- 4.0-5.9: MODERATE signals
- 2.0-3.9: WEAK signals
🎨 ADVANCED VISUAL SYSTEM
Multi-Dimensional Quantum Aura Bands
Five-layer resonance field showing market energy:
- Colors: Theme-matched gradients (Quantum purple, Holographic cyan, etc.)
- Expansion: Dynamic based on score intensity and volatility
- Function: Multi-timeframe support/resistance zones
Morphism Flow Portals
Category theory visualization showing market topology:
- Green/Cyan Portals: Bullish mathematical flow
- Red/Orange Portals: Bearish mathematical flow
- Size/Intensity: Proportional to signal strength
- Recursion Depth (1-8): Nested patterns for flow evolution
Fractal Grid System
Dynamic support/resistance with projected L-Scores:
- Multiple Timeframes: 10, 20, 30, 40, 50-period highs/lows
- Smart Spacing: Prevents level overlap using ATR-based minimum distance
- Projections: Estimated signal scores when price reaches levels
- Usage: Precise entry/exit timing with mathematical confirmation
Wick Pressure Analysis
Rejection level prediction using candle mathematics:
- Upper Wicks: Selling pressure zones (purple/red lines)
- Lower Wicks: Buying pressure zones (purple/green lines)
- Glow Intensity (1-8): Visual emphasis and line reach
- Application: Confluence with fractal grid creates high-probability zones
Regime Intensity Heatmap
Background coloring showing market energy:
- Black/Dark: Low activity, range-bound markets
- Purple Glow: Building momentum and trend development
- Bright Purple: High activity, strong directional moves
- Calculation: Combines trend, momentum, volatility, and score intensity
Six Professional Themes
- Quantum: Purple/violet for general trading and mathematical focus
- Holographic: Cyan/magenta optimized for cryptocurrency markets
- Crystalline: Blue/turquoise for conservative, stability-focused trading
- Plasma: Gold/magenta for high-energy volatility trading
- Cosmic Neon: Bright neon colors for maximum visibility and aggressive trading
📊 INSTITUTIONAL-GRADE DASHBOARD
Unified AI Score Section
- Total Score (-10 to +10): Primary decision metric
- >5: Strong bullish signals
- <-5: Strong bearish signals
- Quality ratings: EXCEPTIONAL > STRONG > MODERATE > WEAK
- Component Analysis: Individual L-Function, Galois, Operadic, and Correspondence contributions
Order Flow Analysis
Revolutionary OFPI integration:
- OFPI Value (-100% to +100%): Real buying vs selling pressure
- Visual Gauge: Horizontal bar chart showing flow intensity
- Momentum Status: SHIFTING, ACCELERATING, STRONG, MODERATE, or WEAK
- Trading Application: Flow shifts often precede major moves
Signal Performance Tracking
- Win Rate Monitoring: Real-time success percentage with emoji indicators
- Signal Count: Total signals generated for frequency analysis
- Current Position: LONG, SHORT, or NONE with P&L tracking
- Volatility Regime: HIGH, MEDIUM, or LOW classification
Market Structure Analysis
- Möbius Field Strength: Mathematical field oscillation intensity
- CHAOTIC: High complexity, use wider stops
- STRONG: Active field, normal position sizing
- MODERATE: Balanced conditions
- WEAK: Low activity, consider smaller positions
- HTF Trend: Higher timeframe bias (BULL/BEAR/NEUTRAL)
- Strategy Agreement: Multi-algorithm consensus level
Position Management
When in trades, displays:
- Entry Price: Original signal price
- Current P&L: Real-time percentage with risk level assessment
- Duration: Bars in trade for timing analysis
- Risk Level: HIGH/MEDIUM/LOW based on current exposure
🚀 SIGNAL GENERATION LOGIC
Balanced Long/Short Architecture
The indicator generates signals through multiple convergent pathways:
Long Entry Conditions:
- Score threshold breach with algorithmic agreement
- Strong bullish order flow (OFPI > 0.15) with positive composite signal
- Bullish pattern recognition with mathematical confirmation
- HTF trend alignment with momentum shifting
- Extreme bullish OFPI (>0.3) with any positive score
Short Entry Conditions:
- Score threshold breach with bearish agreement
- Strong bearish order flow (OFPI < -0.15) with negative composite signal
- Bearish pattern recognition with mathematical confirmation
- HTF trend alignment with momentum shifting
- Extreme bearish OFPI (<-0.3) with any negative score
Exit Logic:
- Score deterioration below continuation threshold
- Signal quality degradation
- Opposing order flow acceleration
- 10-bar minimum between signals prevents overtrading
⚙️ OPTIMIZATION GUIDELINES
Asset-Specific Settings
Cryptocurrency Trading:
- Modular Level: 15-25 (capture volatility)
- L-Function Precision: 0.8-1.3 (reactive to price swings)
- OFPI Length: 10-20 (fast correlation shifts)
- Cascade Levels: 5-7, Theme: Holographic
Stock Index Trading:
- Modular Level: 25-35 (balanced trending)
- L-Function Precision: 1.5-1.8 (stable patterns)
- OFPI Length: 14-20 (standard correlation)
- Cascade Levels: 4-5, Theme: Quantum
Forex Trading:
- Modular Level: 35-45 (smooth trends)
- L-Function Precision: 1.6-2.1 (high smoothing)
- OFPI Length: 18-25 (disable volume amplification)
- Cascade Levels: 3-4, Theme: Crystalline
Timeframe Optimization
Scalping (1-5 minute charts):
- Reduce all lookback parameters by 30-40%
- Increase L-Function precision for noise reduction
- Enable all visual elements for maximum information
- Use Small dashboard to save screen space
Day Trading (15 minute - 1 hour):
- Use default parameters as starting point
- Adjust based on market volatility
- Normal dashboard provides optimal information density
- Focus on OFPI momentum shifts for entries
Swing Trading (4 hour - Daily):
- Increase lookback parameters by 30-50%
- Higher L-Function precision for stability
- Large dashboard for comprehensive analysis
- Emphasize HTF trend alignment
🏆 ADVANCED TRADING STRATEGIES
The Mathematical Confluence Method
1. Wait for Fractal Grid level approach
2. Confirm with projected L-Score > threshold
3. Verify OFPI alignment with direction
4. Enter on portal signal with quality ≥ STRONG
5. Exit on score deterioration or opposing flow
The Regime Trading System
1. Monitor Aether Flow background intensity
2. Trade aggressively during bright purple periods
3. Reduce position size during dark periods
4. Use Möbius Field strength for stop placement
5. Align with HTF trend for maximum probability
The OFPI Momentum Strategy
1. Watch for momentum shifting detection
2. Confirm with accelerating flow in direction
3. Enter on immediate portal signal
4. Scale out at Fibonacci levels
5. Exit on flow deceleration or reversal
⚠️ RISK MANAGEMENT INTEGRATION
Mathematical Position Sizing
- Use Galois Rank for volatility-adjusted sizing
- Möbius Field strength determines stop width
- Fractal Dimension guides maximum exposure
- OFPI momentum affects entry timing
Signal Quality Filtering
- Trade only STRONG or EXCEPTIONAL quality signals
- Increase position size with higher agreement levels
- Reduce risk during CHAOTIC Möbius field periods
- Respect HTF trend alignment for directional bias
🔬 DEVELOPMENT JOURNEY
Creating the LOMV was an extraordinary mathematical undertaking that pushed the boundaries of what's possible in technical analysis. This indicator almost didn't happen. The theoretical complexity nearly proved insurmountable.
The Mathematical Challenge
Implementing the Langlands Program required deep research into:
- Number theory and the Möbius function
- Riemann zeta function convergence properties
- L-function analytical continuation
- Galois representations in finite fields
The mathematical literature spans decades of pure mathematics research, requiring translation from abstract theory to practical market application.
The Computational Complexity
Operadic composition theory demanded:
- Category theory implementation in Pine Script
- Multi-dimensional array management for strategy composition
- Real-time democratic voting algorithms
- Performance optimization for complex calculations
The Integration Breakthrough
Bringing together three disparate mathematical frameworks required:
- Novel approaches to signal weighting and combination
- Revolutionary Order Flow Polarity Index development
- Advanced T3 smoothing implementation
- Balanced signal generation preventing directional bias
Months of intensive research culminated in breakthrough moments when the mathematics finally aligned with market reality. The result is an indicator that reveals market structure invisible to conventional analysis while maintaining practical trading utility.
🎯 PRACTICAL IMPLEMENTATION
Getting Started
1. Apply indicator with default settings
2. Select appropriate theme for your markets
3. Observe dashboard metrics during different market conditions
4. Practice signal identification without trading
5. Gradually adjust parameters based on observations
Signal Confirmation Process
- Never trade on score alone - verify quality rating
- Confirm OFPI alignment with intended direction
- Check fractal grid level proximity for timing
- Ensure Möbius field strength supports position size
- Validate against HTF trend for bias confirmation
Performance Monitoring
- Track win rate in dashboard for strategy assessment
- Monitor component contributions for optimization
- Adjust threshold based on desired signal frequency
- Document performance across different market regimes
🌟 UNIQUE INNOVATIONS
1. First Integration of Langlands Program mathematics with practical trading
2. Revolutionary OFPI with T3 smoothing and momentum detection
3. Operadic Composition using category theory for signal democracy
4. Dynamic Fractal Grid with projected L-Score calculations
5. Multi-Dimensional Visualization through morphism flow portals
6. Regime-Adaptive Background showing market energy intensity
7. Balanced Signal Generation preventing directional bias
8. Professional Dashboard with institutional-grade metrics
📚 EDUCATIONAL VALUE
The LOMV serves as both a practical trading tool and an educational gateway to advanced mathematics. Traders gain exposure to:
- Pure mathematics applications in markets
- Category theory and operadic composition
- Number theory through Möbius function implementation
- Harmonic analysis via L-function calculations
- Advanced signal processing through T3 smoothing
⚖️ RESPONSIBLE USAGE
This indicator represents advanced mathematical research applied to market analysis. While the underlying mathematics are rigorously implemented, markets remain inherently unpredictable.
Key Principles:
- Use as part of comprehensive trading strategy
- Implement proper risk management at all times
- Backtest thoroughly before live implementation
- Understand that past performance does not guarantee future results
- Never risk more than you can afford to lose
The mathematics reveal deep market structure, but successful trading requires discipline, patience, and sound risk management beyond any indicator.
🔮 CONCLUSION
The Langlands-Operadic Möbius Vortex represents a quantum leap forward in technical analysis, bringing PhD-level pure mathematics to practical trading while maintaining visual elegance and usability.
From the harmonic analysis of the Langlands Program to the democratic composition of operadic theory, from the number-theoretic precision of the Möbius function to the revolutionary Order Flow Polarity Index, every component works in mathematical harmony to reveal the hidden order within market chaos.
This is more than an indicator - it's a mathematical lens that transforms how you see and understand market structure.
Trade with mathematical precision. Trade with the LOMV.
*"Mathematics is the language with which God has written the universe." - Galileo Galilei*
*In markets, as in nature, profound mathematical beauty underlies apparent chaos. The LOMV reveals this hidden order.*
— Dskyz, Trade with insight. Trade with anticipation.

Emperor RSI CandleDescription:
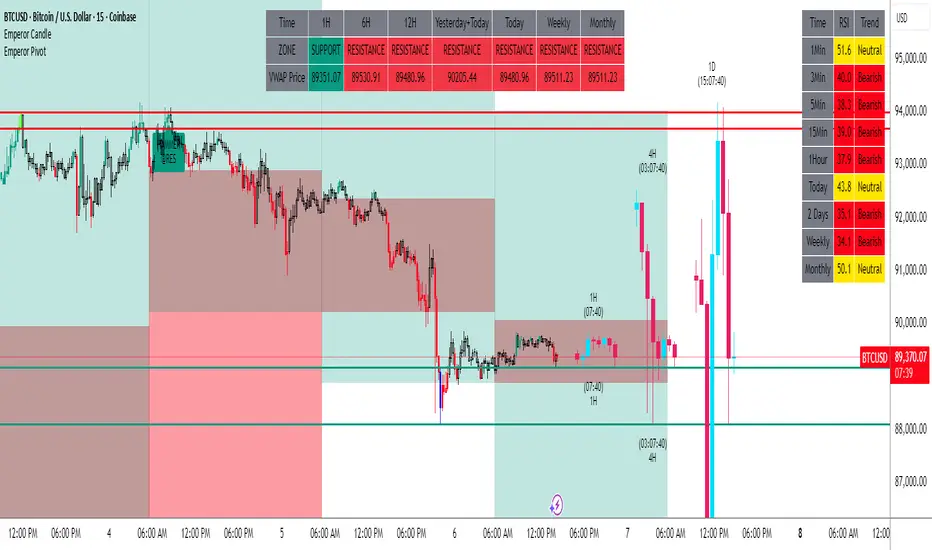
The Emperor RSI Candle is a real-time, non-lagging trading indicator that colors candles based on RSI (Relative Strength Index) levels. It offers instant visual feedback on market momentum, making it easy to identify trend strength, overbought/oversold zones, and potential reversals with precision.
Unlike traditional RSI indicators, which display RSI values in a separate panel, Emperor RSI Candle integrates RSI signals directly into the candles, providing a cleaner, more intuitive charting experience. Its multi-timeframe RSI box shows RSI values across different timeframes, offering confluence confirmation for better trade decisions.
🔥 Emperor RSI Candle is original because it includes a multi-timeframe RSI box that displays RSI values from:
1 min → Monthly timeframes simultaneously.
📊 How this is unique:
Traders can instantly compare RSI values across different timeframes.
This helps them spot confluence and divergences, which is not possible with standard RSI indicators.
The multi-timeframe confluence feature makes the indicator highly effective for both short-term and long-term traders.
🚀 What the script does:
Real-time candle coloring based on RSI levels.
Multi-timeframe RSI box for confluence insights.
Customizable RSI settings for adaptability.
How it benefits traders:
Instant visual feedback for momentum and reversals.
No lag signals for precise trading decisions.
Flexible customization for different trading styles.
Unique visual signals:
Green, red, parrot green, and blue candles → Clearly indicating bullish/bearish momentum and overbought/oversold zones.
Multi-timeframe RSI box → For cross-timeframe confluence.
⚡️ 🔥 UNIQUE FEATURES 🔥:
✅ Multi-Timeframe RSI Box:
Displays RSI values from 1 min to monthly timeframes, helping traders confirm confluence across different timeframes.
✅ Fully Customizable RSI Levels & Display:
Modify RSI thresholds, source, and appearance to fit your trading style.
✅ Dynamic Candle Borders for Weak Signals:
Green border → Weak bullishness (RSI between 50-60).
Red border → Weak bearishness (RSI between 40-50).
✅ Lag-Free, Real-Time Accuracy:
No repainting or delay—instant visual signals for accurate decisions.
✅ Scalable for Any Trading Style:
Perfect for both intraday scalping and positional trading.
📊 🔥 HOW IT WORKS 🔥:
The indicator dynamically colors candles based on RSI values, providing real-time visual signals:
🟢 Above 60 RSI → Green candle:
Indicates bullish momentum, signaling potential upward continuation.
🟩 Above 80 RSI → Parrot green candle:
Overbought zone → Possible reversal or profit booking.
🟥 Below 40 RSI → Red candle:
Signals bearish momentum, indicating potential downward continuation.
🔵 Below 20 RSI → Blue candle:
Oversold zone → Possible reversal opportunity.
🔲 Neutral candles:
50-60 RSI → Green border: Weak bullishness.
40-50 RSI → Red border: Weak bearishness.
📊 🔥 MULTI-TIMEFRAME RSI BOX 🔥:
The Emperor RSI Candle includes an RSI box displaying multi-timeframe RSI values from 1 min to monthly. This provides:
✅ Confluence confirmation:
Compare RSI across multiple timeframes to strengthen trade conviction.
✅ Spot divergences:
Identify hidden trends by comparing smaller and larger timeframes.
✅ Validate trade entries/exits:
Use higher timeframe RSI to confirm smaller timeframe signals
⚙️ 🔥 HOW TO USE IT 🔥:
To maximize the accuracy and clarity of Emperor RSI Candle, follow these steps:
🔧 STEP 1: Chart Settings Configuration
Go to Chart Settings → Symbols
Uncheck the following options:
Body
Borders
Wick
✅ This ensures that only the Emperor Candle colors are visible, making the signals clear and distinct.
🔧 STEP 2: Style Settings for Emperor Candle
After applying the Emperor RSI Candle:
Go to Settings → Style tab
Wick section:
Select Color 2 and Color 3 → Set Opacity to 100%.
Border section:
Select Color 2 and Color 3 → Set Opacity to 100%.
✅ This ensures the candles display with full visibility and accurate colors.
⚙️ 🔥 CUSTOMIZATION OPTIONS 🔥:
Emperor RSI Candle offers full flexibility to match your trading style:
✅ RSI Length:
Modify the period used for RSI calculation (default: 10).
✅ Top & Bottom Levels:
Adjust the overbought (default: 80) and oversold (default: 20) thresholds.
✅ Intermediate Levels:
Up Level: Default: 60 → Bullish RSI threshold.
Down Level: Default: 40 → Bearish RSI threshold.
Mid Level: Default: 50 → Neutral zone.
✅ RSI Source:
Select the price source for RSI calculation (Close, Open, High, Low).
✅ RSI Period:
Customize the RSI calculation period (default: 10).
✅ Font Size:
Adjust the RSI box font size for better visibility.
✅ Box Position:
Choose where to display the RSI box:
Top Left / Top Center / Top Right
Bottom Left / Bottom Center / Bottom Right
💡 🔥 HOW IT IMPROVES TRADING 🔥:
✅ Clear trend identification:
Instantly recognize bullish, bearish, or neutral conditions through candle colors.
✅ Precise entries and exits:
Spot overbought and oversold zones with visual clarity.
✅ Multi-timeframe confirmation:
Validate trades with RSI confluence across multiple timeframes.
✅ No lag, real-time accuracy:
Immediate visual signals for faster and more reliable trade decisions.
✅ Customizable settings:
Tailor the indicator to fit your trading strategy and preferences.
✅ Works for all trading styles:
Suitable for scalping, day trading, and swing trading.
🔥How Traders Can Use Emperor RSI Candle for Trading:
🟢 Green Candles (Above 60 RSI) → Bullish Momentum:
Indicates strong upward movement → Ideal for long entries.
Traders can hold until RSI approaches 80 for profit booking.
🟥 Red Candles (Below 40 RSI) → Bearish Momentum:
Signals strong downward movement → Ideal for short trades.
Traders can exit or book profits near RSI 20.
2. Spotting Overbought and Oversold Zones for Reversals:
🟩 Parrot Green Candles (Above 80 RSI) → Overbought Zone:
Indicates potential for reversals or profit booking.
Traders can tighten stop-losses or exit positions.
🔵 Blue Candles (Below 20 RSI) → Oversold Zone:
Signals a potential reversal opportunity.
Traders can look for buy signals with confluence confirmation.
3. Catching Weak Bullish and Bearish Trends with Border Colors:
🟢 Green Border (RSI 50-60) → Weak Bullishness:
Indicates mild upward momentum.
Traders can consider cautious long entries.
🔴 Red Border (RSI 40-50) → Weak Bearishness:
Indicates mild downward pressure.
Traders can consider cautious short entries.
4. Using the RSI Multi-Timeframe Box for Confluence:
✅ Displays RSI values from 1 min to monthly timeframes.
Usage:
Confluence confirmation:
Multiple timeframes showing bullish RSI → Strong uptrend → Reliable buy signals.
Multiple timeframes showing bearish RSI → Strong downtrend → Reliable sell signals.
Spotting divergences:
If lower timeframes are bullish but higher timeframes are bearish, it indicates a potential reversal.
5. Customization Tips for Different Trading Styles:
✅ For Scalping:
Use a smaller RSI period (9-10) for faster signals.
Check the multi-timeframe RSI box to confirm signals quickly.
✅ For Swing Trading:
Use the default RSI period (14-15) for more accurate signals.
Focus on higher timeframes (1 hr, 4 hr, daily) for stronger trend confirmation.
Triad Trade MatrixOverview
Triad Trade Matrix is an advanced multi-strategy indicator built using Pine Script v5. It is designed to simultaneously track and display key trading metrics for three distinct trading styles on a single chart:
Swing Trading (Swing Supreme):
This mode captures longer-term trends and is designed for trades that typically span several days. It uses customizable depth and deviation parameters to determine swing signals.
Day Trading (Day Blaze):
This mode focuses on intraday price movements. It generates signals that are intended to be executed within a single trading session. The parameters for depth and deviation are tuned to capture more frequent, shorter-term moves.
Scalping (Scalp Surge):
This mode is designed for very short-term trades where quick entries and exits are key. It uses more sensitive parameters to detect rapid price movements suitable for scalping strategies.
Each trading style is represented by its own merged table that displays real-time metrics. The tables update automatically as new trading signals are generated.
Key Features
Multi-Style Tracking:
Swing Supreme (Large): For swing trading; uses a purple theme.
Day Blaze (Medium): For day trading; uses an orange theme.
Scalp Surge (Small): For scalping; uses a green theme.
Real-Time Metrics:
Each table displays key trade metrics including:
Entry Price: The price at which the trade was entered.
Exit Price: The price at which the previous trade was exited.
Position Size: Calculated as the account size divided by the entry price.
Direction: Indicates whether the trade is “Up” (long) or “Down” (short).
Time: The time when the trade was executed (formatted to hours and minutes).
Wins/Losses: The cumulative number of winning and losing trades.
Current Price & PnL: The current price on the chart and the profit/loss computed relative to the entry price.
Duration: The number of bars that the trade has been open.
History Column: A merged summary column that shows the most recent trade’s details (entry, exit, and result).
Customizability:
Column Visibility: Users can toggle individual columns (Ticker, Timeframe, Entry, Exit, etc.) on or off according to their preference.
Appearance Settings: You can customize the table border width, frame color, header background, and text colors.
History Toggle: The merged history column can be enabled or disabled.
Chart Markers: There is an option to show or hide chart markers (labels and lines) that indicate trade entries and exits on the chart.
Trade History Management:
The indicator maintains a rolling history (up to three recent trades per trading style) and displays the latest summary in the merged table.
This history column provides a quick reference to recent performance.
How It Works
Signal Generation & Trade Metrics
Trade Entry/Exit Calculation:
For each trading style, the indicator uses built-in functions (such as ta.lowestbars and ta.highestbars) to analyze price movements. Based on a customizable "depth" and "deviation" parameter, it determines the point of entry for a trade.
Swing Supreme: Uses larger depth/deviation values to capture swing trends.
Day Blaze: Uses intermediate values for intraday moves.
Scalp Surge: Uses tighter parameters to pick up rapid price changes.
Metrics Update:
When a new trade signal is generated (i.e., when the trade entry price is updated), the indicator calculates:
The current PnL as the difference between the current price and the entry price (or vice versa, depending on the trade direction).
The duration as the number of bars since the trade was opened.
The position size using the formula: accountSize / entryPrice.
History Recording:
Each time a new trade is triggered (i.e., when the entry price is updated), a summary string is created (showing entry, exit, and win/loss status) and appended to the corresponding trade history array. The merged table then displays the latest summary from this history.
Table Display
Merged Table Structure:
Each trading style (Swing Supreme, Day Blaze, and Scalp Surge) is represented by a table that has 15 columns. The columns are:
Trade Type (e.g., Swing Supreme)
Ticker
Timeframe
Entry Price
Exit Price
Position Size
Direction
Time of Entry
Account Size
Wins
Losses
Current Price
Current PnL
Duration (in bars)
History (the latest trade summary)
User Customization:
Through the settings panel, users can choose which columns to display.
If a column is toggled off, its cells will remain blank, allowing traders to focus on the metrics that matter most to them.
Appearance & Themes:
The table headers and cell backgrounds are customizable via color inputs. The trading style names are color-coded:
Swing Supreme (Large): Uses a purple theme.
Day Blaze (Medium): Uses an orange theme.
Scalp Surge (Small): Uses a green theme.
How to Use the Indicator
Add the Indicator to Your Chart:
Once published, add "Triad Trade Matrix" to your TradingView chart.
Configure the Settings:
Adjust the Account Size to match your trading capital.
Use the Depth and Deviation inputs for each trading style to fine-tune the signal sensitivity.
Toggle the Chart Markers on if you want visual entry/exit markers on the chart.
Customize which columns are visible via the column visibility toggles.
Enable or disable the History Column to show the merged trade history in the table.
Adjust the appearance settings (colors, border width, etc.) to suit your chart background and preferences.
Interpret the Tables:
Swing Supreme:
This table shows metrics for swing trades.
Look for changes in entry price, PnL, and trade duration to monitor longer-term moves.
Day Blaze:
This table tracks day trading activity.It will update more frequently, reflecting intraday trends.
Scalp Surge:
This table is dedicated to scalping signals.Use it to see quick entry/exit data and rapid profit/loss changes.
The History column (if enabled) gives you a snapshot of the most recent trade (e.g., "E:123.45 X:124.00 Up Win").
Use allerts:
The indicator includes alert condition for new trade entries(both long and short)for each trading style.
Summary:
Triad Trade Matrix provides an robust,multi-dimensional view of your trading performance across swing trading, day trading, and scalping.
Best to be used whith my other indicators
True low high
Vma Ext_Adv_CustomTbl
This indicator is ideal for traders who wish to monitor multiple trading styles simultaneously, with a clear, technical, and real-time display of performance metrics.
Happy Trading!

PowerStrike Pro V3Purpose of the Script
"PowerStrike Pro V3" is a custom indicator designed to generate high-accuracy buy/sell signals by combining multiple technical analysis tools. This script is optimized for trend-following, scalping, and support/resistance strategies. It integrates popular indicators such as RSI, Supertrend, Bollinger Bands, and dynamic support/resistance levels to provide traders with reliable signals.
Components of the Script and How It Works
The script combines the following key components, each contributing to the total signal strength based on user-defined weights. Below is a detailed explanation of how each component works and how it contributes to the overall score:
1. RSI (Relative Strength Index)
How It Works:
RSI identifies overbought (above 70) and oversold (below 30) conditions in the market.
The script uses RSI values to measure the strength of the trend and generate buy/sell signals.
When RSI is in the oversold zone, it strengthens buy signals. When in the overbought zone, it strengthens sell signals.
Contribution to Total Score:
RSI's contribution is calculated based on its strength in the oversold or overbought zones.
The final contribution is weighted by the user-defined "RSI Weight" and added to the total score.
2. Support and Resistance Levels
How It Works:
The script dynamically calculates recent peaks (resistance) and valleys (support) using a user-defined lookback period.
These levels are plotted on the chart as dynamic support and resistance lines.
The proximity of the price to these levels strengthens the signals.
Contribution to Total Score:
If the price is near a support level, it increases the strength of buy signals.
If the price is near a resistance level, it increases the strength of sell signals.
The contribution is weighted by the "Support/Resistance Weight" and added to the total score.
3. Supertrend Indicator
How It Works:
Supertrend uses ATR (Average True Range) and a multiplier to determine the trend direction.
The script uses Supertrend's direction changes as a filter for buy/sell signals.
When Supertrend is in an uptrend, it strengthens buy signals. When in a downtrend, it strengthens sell signals.
Contribution to Total Score:
Supertrend's contribution is weighted by the "Supertrend Weight" and added to the total score.
4. Bollinger Bands
How It Works:
Bollinger Bands measure price volatility and identify potential support/resistance levels.
The script generates buy signals when the price crosses above the lower band and sell signals when it crosses below the upper band.
Contribution to Total Score:
A crossover above the lower band increases the strength of buy signals.
A crossover below the upper band increases the strength of sell signals.
The contribution is weighted by the "Bollinger Bands Weight" and added to the total score.
5. Order Book Data
How It Works:
The script analyzes bid/ask volumes from the order book to assess market depth.
High bid volume near support levels strengthens buy signals.
High ask volume near resistance levels strengthens sell signals.
Contribution to Total Score:
Order book data is weighted by the "Order Book Weight" and added to the total score.
Signal Types and Their Meaning
The script generates two types of signals:
Weak Signals:
Weak signals indicate the early stages of a trend or minor corrections.
These are represented by small green (buy) or red (sell) triangles on the chart.
Weak signals are suitable for low-risk trades or scalping strategies.
Strong Signals:
Strong signals indicate the continuation of a trend or significant reversal points.
These are represented by larger green (buy) or red (sell) arrows on the chart.
Strong signals are suitable for higher-risk, higher-reward trades.
Total Score Calculation
The script calculates the total buy and sell scores by combining the weighted contributions of all components. The formula for the total score is as follows:
Copy
Total Buy Score = (RSI Buy Strength * RSI Weight) + (Support Strength * Support/Resistance Weight) + (Supertrend Buy Strength * Supertrend Weight) + (Bollinger Buy Strength * Bollinger Weight) + (Order Book Buy Strength * Order Book Weight)
Total Sell Score = (RSI Sell Strength * RSI Weight) + (Resistance Strength * Support/Resistance Weight) + (Supertrend Sell Strength * Supertrend Weight) + (Bollinger Sell Strength * Bollinger Weight) + (Order Book Sell Strength * Order Book Weight)
The total score is then compared to user-defined thresholds to generate weak or strong signals. For example:
A total buy score above 80% generates a weak buy signal.
A total buy score above 85% generates a strong buy signal.
Recommended Strategies
Trend Following: Use strong signals to trade in the direction of the main trend.
Scalping: Use weak signals to capture short-term price movements.
Support/Resistance Trading: Use the dynamically plotted support and resistance levels to identify reversal points.
How to Use the Script
Weight Settings:
Adjust the weights for each component (RSI, Supertrend, Bollinger Bands, etc.) in the script settings to customize the signal strength calculation.
Signal Thresholds:
Set the thresholds for weak and strong signals (e.g., 80% for weak signals, 85% for strong signals).
Chart Visualization:
The script automatically plots buy/sell signals on the chart. Use these signals in conjunction with your trading strategy.
Unique Features of the Script
Dynamic Weighting: Each component's contribution to the total score can be customized using user-defined weights.
Integrated Support/Resistance: The script dynamically calculates and plots support/resistance levels, enhancing signal accuracy.
Order Book Analysis: The inclusion of order book data provides additional confirmation for signals.
Final Notes
While "PowerStrike Pro V3" combines multiple indicators to generate reliable signals, no indicator guarantees 100% accuracy. Always use proper risk management and combine this script with other analysis tools for the best results

OnChart - SuiteThe Motivation Behind OnChart Suite
In the dynamic world of trading, the ability to interpret market trends and make timely decisions is paramount. OnChart Suite was developed to empower traders by offering a comprehensive suite of tools that combine advanced analysis with intuitive user experience. The goal is to support traders in navigating complex market environments, helping them refine their strategies and gain a deeper understanding of price movements.
█ Key Features
🤖 ApexAlphaClouds: Identifies potential price rejections or breakthroughs by analyzing dynamic price ranges.
🔢 Matrix Algo: Offers multi-timeframe trend sentiment analysis using key market indicators.
🎯 CandleSniper: Detects key decision points based on phase calculation and Fibonacci levels.
🧲 MagnetZone Horizon: Highlights strategic price zones that can act as smart FVGs.
🟢 NeonZenith: Combines trend analysis with decision points and Fibonacci targets.
█ How These Tools Work Together
OnChart Suite integrates each of these powerful tools to provide traders with a comprehensive analysis framework. By combining the ApexAlphaClouds for price movement intuition, the Matrix Algo for trend sentiment, the CandleSniper for decision points, the MagnetZone Horizon for strategic price zones, and the NeonZenith for trend and target analysis, traders can develop robust trading strategies. This integration ensures that traders have access to multiple perspectives on market conditions, enhancing their ability to make calculated decisions.
█ Detailed Feature Explanations:
--------------🤖 ApexAlphaClouds --------------
How the Tool Can Help Traders
The `ApexAlphaClouds` indicator is designed to assist traders by identifying dynamic price ranges where the market tends to consolidate, which are critical for making informed trading decisions. The tool uses an ML algorithm to analyze high-price data over a set period and determines key levels on the chart, which are visualized as "clouds." These clouds represent potential support and resistance areas, where price action is likely to pause, reverse, or experience increased volatility.
The primary benefit for traders is the ability to identify these key zones in real-time, allowing them to anticipate potential market movements and plan trades accordingly. For example, if a trader sees that price is approaching a cloud boundary, they might expect a reversal or a breakout, depending on the broader market context. This can be particularly useful in range-bound markets or when looking for potential entry and exit points in trending markets.
How Traders Can Use the Indicator
Identifying Support and Resistance:
The clouds plotted by the `ApexAlphaClouds` indicator can be used to identify dynamic support and resistance levels. Traders can watch how the price reacts when it enters these clouds. If the price bounces off a lower cloud, it may suggest support, while a rejection from an upper could indicate resistance.
Trend Reversals and Continuations:
The indicator's middle cloud can help identify potential trend reversals. If price moves through the middle cloud and continues in the same direction, it could indicate a trend continuation. Conversely, if price reverses within the middle cloud, it might signal a potential trend reversal.
Volatility and Breakouts:
The distance between the upper and lower clouds can give traders an idea of market volatility. Narrow clouds suggest low volatility, which may precede a breakout, while wide clouds indicate higher volatility, where prices might oscillate within the range.
Settings Input and Their Effects
’ApexAlphaClouds` (Toggle) -This setting allows the trader to enable or disable the `ApexAlphaClouds` indicator on their chart.
Effect: When enabled, the clouds representing dynamic price ranges will be displayed on the chart. Disabling this will hide the indicator’s outputs.
Target Area Size - This setting determines the number of bars (length) the algorithm considers when collecting high prices for clustering.
Effect: A larger value will make the indicator consider a broader historical range, potentially smoothing out the clouds and identifying longer-term price ranges. A smaller value will focus on more recent price action, which might be useful for short-term trading strategies.
Accuracy - This setting specifies the number of groups that the algorithm will try to identify within the selected data range.
Effect: A higher value increases the number of identified clusters, making the indicator more sensitive to minor fluctuations in price. This can be useful for traders looking to identify multiple potential reversal points. A lower value will focus on the most prominent price clusters, which may be more relevant for long-term analysis.
Maximum Calibration - This setting controls the maximum number of iterations the machine learning algorithm will perform to find the optimal clusters.
Effect: Increasing allows the algorithm more time to refine the clusters, potentially leading to more accurate and stable clouds. However, it may also increase the computation time. Decreasing this value may speed up the process but could result in less accurate clustering.
Wide Range Calibration - This setting determines the maximum number of bars the algorithm will consider when applying the clustering.
Effect: A larger value allows the algorithm to analyse a wider range of historical data, which can help identify significant long-term price ranges. A smaller value will limit the analysis to more recent data, which might be preferable for traders focused on short-term movements.
Smoothing Factor - This setting applies a smoothing function to the clouds, reducing noise and making the price ranges more visually consistent.
Effect :A higher smoothing factor will produce smoother, more consistent clouds, which might be beneficial in volatile markets to avoid false signals. A lower smoothing factor will make the clouds more responsive to recent price changes, which could be useful for scalping or short-term trading strategies.
Usage Scenarios
Scalping:
Traders using short-term strategies might set Accuracy to a smaller value and reduce the Smoothing Factor to make the clouds more responsive to recent price action. This helps in identifying quick reversal points.
Swing Trading:
Swing traders could use a larger Target Area Size and increase Accuracy to identify key price ranges that have held over longer periods. Adjusting Wide Range Calibration to a higher value allows them to consider broader historical trends.
Trend Following:
By observing how price interacts with the clouds, trend-following traders can look for breakouts or breakdowns from the clouds to confirm entry points in the direction of the trend.
Volatility Management:
Traders can monitor the width of the clouds to gauge market volatility and adjust their strategies accordingly, tightening stops in narrow cloud ranges or widening them in broader ranges.
Conclusion
The `ApexAlphaClouds` indicator is a powerful tool for traders looking to analyze price action with a focus on dynamic price ranges. By understanding and utilizing the settings, traders can customize the indicator to fit their specific trading strategies, whether they are scalping, swing trading, or trend following. The key is to adjust the inputs based on the market context and trading goals, using the clouds as a visual guide to anticipate market movements and make informed decisions.
--------------🔢 Matrix Algo --------------
Matrix Algo is a multi-timeframe (MTF) tool designed to provide traders with a comprehensive view of market conditions across different timeframes using a combination of popular technical indicators. The indicator aggregates data from RSI, MACD, and Bollinger Bands across multiple timeframes, presenting this information in a matrix format to help traders make informed decisions based on a complete market overview. This allows traders to quickly assess the overall market sentiment and trend direction without having to manually check each indicator on different timeframes. By offering a bird’s-eye view of the market conditions.
How Traders Can Use Matrix Algo?
Identify Trends and Reversals: By analysing the matrix, traders can identify whether the market is bullish, bearish, or in consolidation across different timeframes.
Confirm Signals: The Matrix Algo can confirm signals from other trading strategies by providing additional context from multiple indicators across several timeframes.
Settings:
Toggle individual timeframes - (Monthly, Weekly, 3D, Daily, 4h, etc.) to include or exclude from the matrix.
Effect: The matrix displays whether the market conditions are favorable (green) or unfavorable (red) for each indicator and timeframe combination. This color-coded information helps traders quickly assess the market situation.
--------------🎯 CandleSniper --------------
Overview:
The CandleSniper indicator is designed to identify potential turning points in the market by combining various technical analysis tools. It leverages a combination of the MACD indicator, advanced phase analysis technique, and Fibonacci levels to highlight moments where price action may be reversing. This helps traders spot divergence opportunities and set potential target levels.
Explanation
MACD Divergence with Phase Analysis:
The indicator leverages the MACD (Moving Average Convergence Divergence) to identify divergences, which can indicate potential reversal points in the market. The MACD is computed using standard short and long lengths, along with a signal line.
An advanced phase analysis technique is employed to measure the difference between price and its moving averages, enabling the identification of cyclical turning points in the market
A potential bullish decision point is identified when the MACD line crosses above the signal line during a cyclical turning point. Conversely, a potential bearish decision point is identified when the MACD line crosses below the signal line during a cyclical turning point.
Fibonacci Levels for Targeting:
The indicator calculates Fibonacci extension levels based on recent price swings to provide target levels for potential price movements.
For a bullish setup, the indicator identifies levels above the current price as potential targets, while for a bearish setup, it identifies levels below the current price.
Fib Filter Line:
The Fib Filter Line is represented in purple for bullish turning points and white for bearish turning points. These lines serve as additional filters to help traders identify stronger, more reliable turning points in the market. Designed for those who prefer a more conservative approach, the Fib Filter Line offers an extra layer of confirmation based on price movements, allowing traders to filter out weaker signals and focus on more significant market shifts.
Inputs and Settings:
lookbackPeriod: Defines the period over which the indicator looks back to calculate the Fibonacci levels. Adjusting this setting can change the sensitivity of the decision points.
Dimmer and DimmerPeriod: These settings control the smoothing applied to the price data before the phase calculation. They help in reducing noise and ensuring that only significant price movements are considered for decision points.
How to Use:
Traders can use the CandleSniper indicator to identify potential decision points by observing the color changes on the bars and the plotted Fibonacci levels:
🟢 Bullish Decision Points:
When the indicator detects a bullish divergence, it highlights the bars in purple and plots potential upward Fibonacci levels as targets.
🔴 Bearish Decision Points:
When a bearish divergence is detected, the indicator highlights the bars in white and plots downward Fibonacci levels as targets.
These decision points can help traders identify when the market might be ready for a reversal or continuation or even use as a start point from where the trader can start his own analysis
Combining with Other Tools
The CandleSniper indicator can be combined with other OnChart tools to create a comprehensive trading framework:
🔢 Matrix Algo:
Use Matrix Algo to assess the overall market sentiment across multiple timeframes, then apply CandleSniper for pinpointing specific entry or exit points.
🤖 ApexAlphaClouds:
Overlay ApexAlphaClouds to visualise dynamic price ranges, using CandleSniper to identify decision points within these ranges.
This combination allows traders to develop a robust trading strategy that considers broader market trends and specific price action signal intuition.
--------------🧲 MagnetZone Horizon --------------
Overview:
The MagnetZone Horizon indicator is a specialized tool designed to identify potential gaps between two significant changes in the Average True Range (ATR). These gaps, calculated dynamically, serve as areas where the price might react, often acting as smart Fair Value Gaps (FVG). By highlighting these zones, traders can gain insights into where the market might find support, resistance, or potential reversal points.
How Traders Can Use This Indicator:
Identifying Smart Fair Value Gaps:
The MagnetZone Horizon indicator helps traders locate gaps between ATR shifts that are likely to act as significant decision points. These gaps can indicate areas where price corrections or consolidations might occur, providing opportunities for strategic entries or exits.
Adaptive Support and Resistance:
The levels calculated by the indicator adjust according to market volatility, offering dynamic support and resistance zones. These zones are particularly useful in identifying potential reversals or continuation patterns.
Volatility-Based Trading:
Since the indicator bases its calculations on ATR, it inherently adjusts to market conditions, allowing traders to align their strategies with the current level of volatility. This adaptability makes it suitable for both trending and range-bound markets.
Settings and Their Impact:
MagnetZone Horizon (Enable/Disable): This toggle allows traders to activate or deactivate the visualization of the MagnetZone Horizon on their charts.
Factor: This setting multiplies the ATR to scale the detected gaps. A higher factor results in broader zones, which might capture more significant market movements, while a lower factor creates tighter zones for more precise analysis.
Factor=5
Factor=7
Division: This setting works in conjunction with the Factor to further refine the gap calculations. Adjusting the Division setting allows traders to fine-tune how sensitive the indicator is to ATR changes, which can help in pinpointing more precise smart FVGs.
Use Cases:
Gap Trading:
Traders can use the identified gaps as potential areas to enter or exit trades, particularly if the price approaches these smart FVGs. The idea is to capitalize on the likelihood that the market will react to these gaps.
Reversal Identification:
The zones marked by the MagnetZone Horizon can indicate potential reversal points, especially in volatile markets where significant ATR changes suggest a shift in market sentiment.
Trend Continuation or Rejection:
By monitoring how the price interacts with these dynamically calculated zones, traders can assess whether a trend is likely to continue or reverse, aiding in more informed trading decisions.
The MagnetZone Horizon indicator is particularly useful for traders looking to identify significant gaps in market activity that are influenced by volatility. These smart FVGs provide a deeper understanding of where the market might react, offering a valuable tool for enhancing trading strategies and adds another strategic piece to the puzzle in the OnChart Suite.
--------------🟢NeonZenith Indicator--------------
Overview:
NeonZenith is a tool designed to provide traders with a better understanding of market trends and potential decision points by utilising multiple elements, including EMAs and Fibonacci levels. This indicator identifies key structures in recent price movements, helping traders recognize potential trend shifts and generate target levels for their trading strategies. Additionally, NeonZenith incorporates elements from the ApexAlphaCloud to enhance the interpretation of market sentiment, particularly regarding price rejections or breakthroughs.
Key Features:
Trend Direction Identification:
NeonZenith uses EMAs to help traders gauge the overall trend direction. By analysing the relationship between different EMAs, the tool highlights potential points where trends may strengthen or reverse, offering decision points for traders to consider in their strategies.
Decision Points:
The tool generates decision points based on EMA interactions, providing traders with crucial levels that may indicate potential market entries or exits. These decision points are derived from the intersection of EMAs, which are known for their reliability in identifying trend shifts.
Fibonacci Target Levels:
Based on the identified price structures, NeonZenith calculates Fibonacci levels that serve as potential target areas. These levels help traders set realistic goals for their trades, whether they are looking to take profits or manage risks effectively.
ApexAlphaCloud Integration:
The tool integrates a middle cloud from the ApexAlphaCloud, which helps traders anticipate potential price rejections or breakthroughs. This cloud provides additional context to the trend analysis, enhancing traders' ability to gauge the market's sentiment and make them think about potential price movements.
Settings:
Left and Right Border Width:
These settings control the lookback period for identifying significant price structures. By adjusting these parameters, traders can fine-tune the sensitivity of the indicator to recent price movements.
Fibonacci Calculation:
The tool calculates Fibonacci levels based on recent lows and highs, offering multiple targets for both long and short positions. These targets include various levels that traders can use to plan their entry, take-profit, and stop-loss orders.
Plotting and Visualization:
NeonZenith provides clear visual cues on the chart, including shapes and labels to mark significant decision points and target areas. These visual elements help traders quickly interpret the information provided by the indicator and apply it to their trading strategies.
How to Use NeonZenith:
Trend Identification:
Use the tool to identify the current trend direction by observing the interaction between the EMAs ,the flag sign and triangle, flag represent general trend changes and the triangle represents minor and inside trend changes.
Fibonacci Levels:
Use the generated Fibonacci levels to set target areas for your trades. These levels can guide you in deciding where to take profits or place stop-loss orders.
Sentiment Gauge:
Utilise the middle cloud from the ApexAlphaCloud to assess potential price rejections or breakthroughs. This feature provides additional insight into the strength of the current trend and helps you anticipate possible market reversals.
Conclusion:
NeonZenith is a versatile and simple tool designed to support traders in understanding market trends, identifying decision points, and setting realistic targets based on Fibonacci levels. Its integration with the ApexAlphaCloud enhances the tool's ability to provide a comprehensive view of market sentiment, making it a valuable addition to any trader's toolkit.

Auto Trend Lines Breakouts and Bounces Signals and AlertsAuto Trend Lines Breakout with Confirmation Bounce Signals and Alerts
This indicator draws trend lines automatically based on the 2 pivot points, which are calculated based on the specified number of bars (length), which is of course customizable. The indicator then shows you when these trend lines get touched (potential bounce) or “almost touched” (Yes! The script can do that as well!) by the current price of the instrument or broken and then confirmed by the “after break come back touch” – classic! Everything is shown on the chart, and for everything - alarms can be set up with just a few clicks!
Now there are 2 modes here (you can hide all signals as well and just use the trend lines):
1) Current/recent trend lines only: will only show 2 current upper/lower trend lines as well as previous 2 for reference.
2) All time (historical) trend lines: will show 2 current upper/lower trend lines as well as the historical lines from the past and these lines are often very respected by the price!
Besides that, you can set the indicator to show you exactly what you want: Just the trend lines touches/bounces, breaks with confirmation touches/bounces or BOTH.
In addition to that, you can set the indicator to only show you these touches/bounces and breaks with additional confirmations, only if confirmed by :
- Moving Average (customizable length): LONG signals based off the trend lines will only be shown if above EMA, SHORT if below.
- Signals where the candle color confirms the direction of the trade, but the candle type is opposite (like a green colored bearish hammer for example) will be avoided (such candles can be very uncertain/deceptive)
- Signals where the signal candle is doji will be avoided (uncertain)
- Signals will only be shown if supported by the trend line slope (for example, with this feature turned on, if there is an upper line trend line, but the line is actually above, touching the top of the candles and the price touches/crosses it or it gets broken – there will be no signal as even though the trend line is an upper line above candles, it’s slope is positive (going up), if the slope would be down, like a classical down/bearish trend line and the price touches/bounces off it or the line gets broken, only then the indicator will show the signal/alert.
- OFFSET: this one is really cool! With this feature you can hunt these conditions when the price comes very near the trend line, but never touches it. With this setting turned on, with a correct offset amount – you will be able to catch these! You will need to play around with the offset amount, depending on the timeframe/instrument, be quick-n-easy!
The indicator also includes Round Number lines on the chart, which are customizable for any instrument. As you know round numbers are appreciated by the price and can be very nicely used with this indicator looking for combos or using trend lines for signals, while round numbers as partial profit price targets or stop-loss areas.
Important economic events are also shown on the chart as red vertical lines (during these events, volatility can suddenly spike, so it’s best to stay away from trading!)
This is a very powerful indicator with plenty of customizations to find the best approaches, can be used for any instrument and on any timeframe! Awesome for scalping and could be used with swing trading as well! Enjoy!
To add the alerts
-Right-click anywhere on the TradingView chart
-Click on Add alert
-Condition: Auto Trend Lines Breakout with Confirmation Bounce Signals and Alerts
-Alert name: DO NOT TOUCH THIS
-Hit “Create”
-Note: If you change ANY Settings within the indicator – you must DELETE the current alert and create a new one per steps above, otherwise it will continue triggering alerts per old Settings!
A few strategies how this indicator can be used (these were actually tested and showed awesome results!):
1) Bounce Scalping: Simply hunting bounces off the trend lines. Often the price will slightly cross the trend line and then immediately bounces from it for nice little price move, which is great for scalping or if you for example take 2/3s off the position and leave the remaining, often with such bounces – the price may reverse from the trend line and go in the opposite direction considerably.
2) Break-Bounce-Confirm: this is the “Breaks with Confirmation Bounce” option of the script which fully automates the classical trend lines break confirmation, where the trend line is broken (which could be a fake out), so you wait for a touch/bounce of that trend line back from the initial break and open the position right there or wait and see if after the touch/bounce back, the price once again goes into the direction of the break.
For stop-loss and take-profit areas, you can use:
1) Pivots (these are marked with red and green crosses on the chart), which are used to draw the actual trend lines.
2) The actual trend lines themselves (if one gets broken + confirmation, you can set your stop-loss if that same line gets broken again in the opposite direction | similar for take-profit, you can take profit or partial profit at next trend line on the chart if the price reaches it.
3) Use the Round Numbers included, for example: use the closest round number as a visual soft stop-loss and the furthest one away as a visual soft take-profit.
You can try combining this indicator with divergence, stochastic, Bollinger bands, pretty much anything!
If you wish to try this out for a week or so – please reach out and I will give you access.

[ADOL_]Trend Break Pro ARVIS BOTENG) Trend Break Pro Version : ARVIS BOT
It automatically draws trend lines and signals signals based on sophisticated standards.
It is an indicator that can be used as a tool for trading. from scalping
It was made as an all-round player that can even use the swing.
It contains all the signals of a breakout of the basic trend line,
By applying a new logic, signals that are faster than the breakout point of the basic trend line and
I made it to produce a better value while catching the signal of the press.
principle)
Basic trendline features:
It reflects the concepts of HH and LL.
Trendlines are created using the basic construction method, connecting highs and highs and lows and lows.
The 3 candles prior to the breakout of the trend line are the triggers to create a ready-to-prepare base signal.
What is HH? It is an abbreviation of Higher High, which means to raise the high.
What is LL? An abbreviation of Lower Low, which means to lower the low.
Features of the new core logic:
This is a quick way to find a reversal of a trend, taking into account candle patterns, volume, and moving averages.
The candle pattern that is reversed when the trading volume increases and then disappears is processed by subdividing and digitizing the pattern.
generate a signal. At the turning point of the trend, it triggers a long and short reversal signal.
For trading volume, obv was utilized. Overlaid elements allow you to find signals that are slightly faster than the trend line.
What is obv? OBV = An abbreviation of On Balance Volume. It is a secondary indicator showing the cumulative total of trading volume.
The background is a notation of the section where the trend is reversing.
option)
The degree of freedom to set options according to scalping, single stroke, swing, and bot implementation is given.
A volatility warning notification has been included. The function of TD setup is included.
You can set the range of candles as an option. The backtesting value is printed.
The backtesting value is calculated as the average of the opening and closing prices.
Volatility warnings are displayed in yellow.
TD Setup: Numbers floating on the candle, in ascending and descending order (=sequence) from 1 to 9.
The reason for writing up to 9 is based on statistics, and the more fundamental principle is the theory of the Fibonacci sequence.
The Fibonacci sequence is the number in the golden ratio that makes up nature, 1.1.2.3.5.8.13.21.34.55.89...
The sum of the nth and n+1th numbers becomes n+2th.
A note on odds of winning. Even if the win rate is 33%, if the profit-loss stop-loss ratio is 3 to 1, the profit exceeds 2, so cumulative profits are generated.
In other words, it is decided by considering both the win rate and profit/loss ratio, not just the win rate. The logic of a short stop loss and a long profit trend is reflected.
time frame)
Applicable to any timeframe.
Scalping: 1 minute, 3 minute, 5 minute / Danta: 15 minute, 1 hour / Swing: 4 hour, daily
Recommended time frame: 3, 15 minutes
alarm)
Various alert functions are available. based on the alert signal
When trading, various signals help to set specific conditions.
- Basic long and short alerts
- Volatility warning alert
- Filtered long and short alerts
- Long and short alerts occur Next peak alerts
- Uptrend line, downtrend line breakout alert
- Alerts about bot start and end when bot is running
- Filtered uptrend line, downtrend line breakout alert
- Alerts for rising and falling 1 setup and rising and falling 9 setups respectively
trading method)
1. For the trend line breakout signal, when the signal overlaps more than 3 times, the breakout probability increases.
It reflects the concept below.
One touch of support/resistance: The first touch sees longs at support and shorts at resistance.
2 touches of support/resistance line: Confirm the position once more in the stage of building support/resistance line (compacting). We see longs at support and shorts at resistance.
3 touches of the ground/resistance line: This is a section with a high possibility of both directions.
Support/resistance line 4 (over) touch: Used as a breakout reference line. When breaking through, short at support and long at resistance.
When the support/resistance line breaks through the closing price, support becomes resistance and resistance becomes support.
2. Trade support/resistance lines using the trend line breakout and signal as an important reference bar.
example)
3-1. Entry criteria/stop loss criteria (when trading hands and bots)
- entry criteria; Follow the signal.
- Stop loss criteria;
Use fixed stop loss: Set 1% fixed stop loss section from signal generation. (% is set individually)
Use Candle Stop Loss: Set a stop loss when the low or high point of the signal generating bar collapses.
Use flow stop loss: Set the stop loss considering the flow of the wave.
3-2. Entry criteria/stop loss criteria (in case of signal-based bot trading)
- Approach with a low magnification (more than 10 times is not recommended) to prevent the risk of liquidation of the largest drop,
There is an opposite signal after entering without setting stop loss separately.
4. Note
You are solely responsible for any trading decisions you make.
5. How to use
It is set to be available only to invited users. When invited,
Tap Add Indicator to Favorites at the bottom of the indicator.
If you click the indicator at the top of the chart screen and look at the left tab, there is a Favorites tab.
Add an indicator by clicking the indicator name in the Favorites tab.
KOR) Trend Break Pro버전 : ARVIS BOT ; 아비스 봇 입니다.
추세선을 자동으로 작도해주며, 정교화된 기준으로 시그널을
발생시켜 매매에 도구로써 활용가능한 지표입니다. 스캘핑부터
스윙까지 활용가능한 올라운드 플레이어로 만들어졌습니다.
기본 추세선 돌파의 시그널들을 모두 포함하고 있으며,
새로운 로직을 적용하여 기본 추세선 돌파시점보다 빠른 신호와
눌림의 신호까지 잡아내면서, 더 나은 값을 산출하도록 만들었습니다.
원리)
기본 추세선 기능 :
HH와 LL의 개념을 반영합니다.
추세선은 고점과 고점, 저점과 저점을 잇는 기본 작도 방법으로 만들어집니다.
추세선 돌파의 3개 이전 캔들부터 신호발생으로 준비를 기본 시그널을 만듭니다.
HH란 ? Higher High의 약자로 고점을 높인다는 의미입니다.
LL란? Lower Low의 약자로 저점을 낮춘다는 의미입니다.
새로운 핵심적인 로직의 기능 :
추세의 반전을 빠르게 찾기 위한 방법으로 캔들패턴, 거래량, 이평선을 고려하여 만들어졌습니다.
거래량이 증가하다가 소멸하는 시점에서 반전되는 캔들패턴을 세분화하고 수치화하여 가공된
신호를 발생시킵니다. 추세의 전환자리에서 롱과 숏의 전환 신호를 발생시키도록 합니다.
거래량에는 obv가 활용되었습니다. 중첩된 요소들을 통해 추세선보다 조금 더 빠른 신호를 찾을 수 있습니다.
obv란 ? OBV = On Blance Volume의 약자로 거래량의 누적합계를 나타내는 보조지표 입니다.
배경은 추세가 전환되는 구간의 표기입니다.
옵션)
스캘핑과 단타, 스윙, 봇의 구현에 맞게 옵션을 설정할 수 있는 자유도를 부여하였습니다.
변동성 경고 알림이 포함되었습니다. TD셋업의 기능이 포함되었습니다.
캔들의 범위를 옵션으로 설정할 수 있습니다. 백테스팅 값이 출력됩니다.
백테스팅 값은 시가와 종가의 평균값으로 산출됩니다.
변동성경고는 yellow 컬러로 표기됩니다.
TD셋업 : 캔들위에 플로팅 되는 숫자로 1~9까지의 오름차순, 내림차순 (=시퀀스)으로 구성됩니다.
9까지 쓰는 이유는 통계기반, 좀 더 근본적인 원리는 피보나치 수열의 이론이 반영되어 있습니다.
피보나치 수열이란 자연을 이루는 황금비율의 숫자로 1.1.2.3.5.8.13.21.34.55.89...
n번째와 n+1번째 숫자의 합이 n+2번째가 됩니다.
원리 예시)
승률에 관한 참고사항. 승률이 33퍼센트의 승률이어도 3대 1의 익절 손절 비율이면 이익이 2를 넘어가니까 누적수익이 발생합니다.
즉, 승률과 손익비를 모두 고려해서 결정하는 것이지, 승률만 봐서는 안됩니다.
손절은 짧게, 수익은 추세대로 길게의 로직이 반영되어 있습니다.
타임프레임)
모든 시간프레임에 적용 가능합니다.
스캘핑 : 1분봉, 3분봉, 5분봉 / 단타 : 15분봉, 1시간봉 / 스윙 : 4시간봉, 일봉
추천타임프레임 : 3, 15분봉
5분봉)
15분봉)
4시간봉)
알람)
다양한 얼러트 기능을 사용할 수 있습니다. 얼러트 신호를 기반으로
매매시 다양한 신호는 구체적 조건 설정에 도움이 됩니다.
- 기본 롱,숏 얼러트
- 변동성 경고 얼러트
- 필터링된 롱,숏 얼러트
- 롱,숏 얼러트 발생 다음봉 얼러트
- 상승추세선, 하락추세선 돌파 얼러트
- 봇구동시 봇의 시작과 종료에 관한 얼러트
- 필터링된 상승추세선, 하락추세선 돌파 얼러트
- 상승,하락1셋업과 상승,하락9셋업 각각에 대한 얼러트
매매방법)
1. 추세선 돌파신호는 신호가 3번이상 중첩될시 돌파확률이 상승합니다.
아래 개념을 반영합니다.
지지/저항선 1터치 : 첫번째 터치에는 지지선에서 롱을, 저항선에서 숏을 봅니다.
지지/저항선 2터치 : 지지/저항선 구축(다지기)의 단계로 한번 더 자리를 확인합니다. 지지선에서 롱을, 저항선에서 숏을 봅니다.
지/저항선의 3터치 : 양방향의 가능성이 높은 구간입니다.
지지/저항선4(이상)터치 : 돌파기준선으로 사용합니다. 돌파할 때, 지지선에서 숏을, 저항선에서 롱을 칩니다.
지지/저항선이 종가로 뚫리면 지지는 저항이 되고, 저항은 지지가 됩니다.
2. 추세선돌파와 시그널이 발생한 봉을 중요한 기준봉으로 활용하여 지지/저항선 매매를 합니다.
예시)
3-1. 진입기준/손절기준(손,봇 매매시)
- 진입기준; 시그널을 따릅니다.
- 손절기준;
고정손절가 이용 : 시그널 발생으로부터 1% 고정 손절가 구간을 설정합니다.(%는 개별로 설정)
캔들손절가 이용 : 시그널 발생봉의 저점이나 고점이 무너지면 손절을 설정합니다.
흐름손절가 이용 : 파동의 흐름을 고려하여 손절을 설정합니다.
3-2. 진입기준/손절기준(신호기반 봇 매매시)
- 저배율(10배이상은 권장하지 않습니다)로 접근해 최대낙폭의 청산위험을 예방하며,
손절가를 따로 설정하지 않고 진입후 반대신호가 뜰때마다 스위칭을 합니다.
4. 참고
귀하가 내리는 모든 거래 결정은 전적으로 귀하의 책임입니다.
5. 사용방법
초대된 사용자만 사용할 수 있도록 설정이 되어있습니다. 초대를 받을 경우,
지표 하단의 즐겨찾기에 인디케이터 넣기를 누릅니다.
차트화면 상단에 지표를 눌러서 왼쪽탭에 보면 즐겨찾기 탭이 있습니다.
즐겨찾기 탭에서 지표이름을 눌러서 지표를 추가합니다.
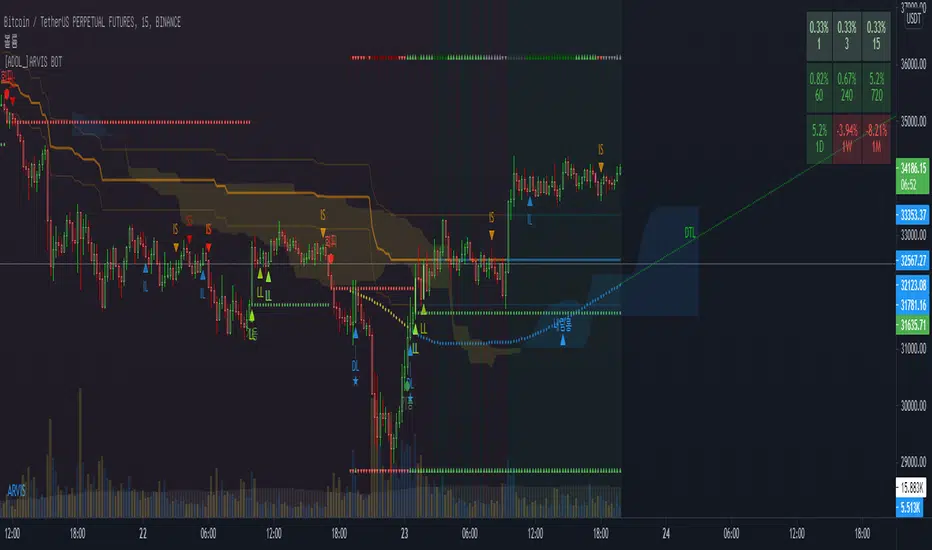
RSI VWAP EMA ON CHART1. Understand the components
VWAP (Volume Weighted Average Price)
Green: price is above VWAP → bullish trend
Red: price is below VWAP → bearish trend
Blue: price exactly at VWAP → neutral
Acts as a dynamic trend line and support/resistance.
4 Moving Averages (MA1–MA4)
Customizable lengths and type (SMA or EMA).
Useful for trend confirmation and dynamic support/resistance.
Typically:
MA1 = fastest (short-term)
MA4 = slowest (long-term)
When price is above multiple MAs → strong bullish trend; below → bearish trend.
RSI Overlay with VWAP Alignment
RSI line normalized to price scale.
Background shading indicates momentum aligned with VWAP trend:
Green shading: RSI > 50 and price above VWAP → bullish momentum
Red shading: RSI < 50 and price below VWAP → bearish momentum
Gray areas: neutral or momentum does not align with VWAP.
2. Basic usage workflow
Trend Confirmation
Look at VWAP color: price above → bullish, below → bearish.
Check RSI + VWAP shading: green confirms bullish momentum, red confirms bearish momentum.
Check MA alignment: shorter MAs above longer MAs = stronger bullish trend; vice versa for bearish.
Entry Signals (Scalping)
Long (Buy) Setup
Price above VWAP (green)
RSI green shading (RSI > 50)
Shorter MAs above longer MAs (trend support)
Short (Sell) Setup
Price below VWAP (red)
RSI red shading (RSI < 50)
Shorter MAs below longer MAs
Exits / Stops
Exit if price closes against VWAP trend (e.g., price drops below VWAP during a bullish trade).
Use nearest MA support/resistance as stop-loss or take-profit zones.
3. Optional adjustments for scalping
RSI length / thresholds
Shorter RSI (7–10) → faster response for scalping.
Standard RSI (14) → smoother, fewer false signals.
MA lengths
Short-term: 20–50
Medium-term: 50–100
Long-term: 100–200
Can tweak for the timeframe you trade (1m, 5m, 15m).
Timeframe
VWAP works best on intraday charts (1m, 5m, 15m).
Use higher timeframe (e.g., 15m or 1h) for trend direction and lower timeframe (1m–5m) for entries.
4. Example Scalping Setup
Bullish setup (buy):
Price above VWAP → VWAP green
RSI > 50 and green shading
Shorter MAs above longer MAs
Enter on small pullback or breakout
Stop: below nearest MA or VWAP
Bearish setup (sell):
Price below VWAP → VWAP red
RSI < 50 and red shading
Shorter MAs below longer MAs
Enter on minor bounce or breakdown
Stop: above nearest MA or VWAP
5. Visual cues summary
Element Interpretation
VWAP Green Price above VWAP → bullish trend
VWAP Red Price below VWAP → bearish trend
RSI Green Shading Bullish momentum aligns with VWAP
RSI Red Shading Bearish momentum aligns with VWAP
MA Alignment Trend strength (short above long = bullish, short below long = bearish)

VWAP + 4 MAs with RSI Overlay & VWAP Alignment1. Understand the components
VWAP (Volume Weighted Average Price)
Green: price is above VWAP → bullish trend
Red: price is below VWAP → bearish trend
Blue: price exactly at VWAP → neutral
Acts as a dynamic trend line and support/resistance.
4 Moving Averages (MA1–MA4)
Customizable lengths and type (SMA or EMA).
Useful for trend confirmation and dynamic support/resistance.
Typically:
MA1 = fastest (short-term)
MA4 = slowest (long-term)
When price is above multiple MAs → strong bullish trend; below → bearish trend.
RSI Overlay with VWAP Alignment
RSI line normalized to price scale.
Background shading indicates momentum aligned with VWAP trend:
Green shading: RSI > 50 and price above VWAP → bullish momentum
Red shading: RSI < 50 and price below VWAP → bearish momentum
Gray areas: neutral or momentum does not align with VWAP.
2. Basic usage workflow
Trend Confirmation
Look at VWAP color: price above → bullish, below → bearish.
Check RSI + VWAP shading: green confirms bullish momentum, red confirms bearish momentum.
Check MA alignment: shorter MAs above longer MAs = stronger bullish trend; vice versa for bearish.
Entry Signals (Scalping)
Long (Buy) Setup
Price above VWAP (green)
RSI green shading (RSI > 50)
Shorter MAs above longer MAs (trend support)
Short (Sell) Setup
Price below VWAP (red)
RSI red shading (RSI < 50)
Shorter MAs below longer MAs
Exits / Stops
Exit if price closes against VWAP trend (e.g., price drops below VWAP during a bullish trade).
Use nearest MA support/resistance as stop-loss or take-profit zones.
3. Optional adjustments for scalping
RSI length / thresholds
Shorter RSI (7–10) → faster response for scalping.
Standard RSI (14) → smoother, fewer false signals.
MA lengths
Short-term: 20–50
Medium-term: 50–100
Long-term: 100–200
Can tweak for the timeframe you trade (1m, 5m, 15m).
Timeframe
VWAP works best on intraday charts (1m, 5m, 15m).
Use higher timeframe (e.g., 15m or 1h) for trend direction and lower timeframe (1m–5m) for entries.
4. Example Scalping Setup
Bullish setup (buy):
Price above VWAP → VWAP green
RSI > 50 and green shading
Shorter MAs above longer MAs
Enter on small pullback or breakout
Stop: below nearest MA or VWAP
Bearish setup (sell):
Price below VWAP → VWAP red
RSI < 50 and red shading
Shorter MAs below longer MAs
Enter on minor bounce or breakdown
Stop: above nearest MA or VWAP
5. Visual cues summary
Element Interpretation
VWAP Green Price above VWAP → bullish trend
VWAP Red Price below VWAP → bearish trend
RSI Green Shading Bullish momentum aligns with VWAP
RSI Red Shading Bearish momentum aligns with VWAP
MA Alignment Trend strength (short above long = bullish, short below long = bearish)

One Minute AI scalper keep extended trading hours on# One Minute AI Scalper - Trading Indicator
## Overview
The One Minute AI Scalper is a precision-engineered trading indicator designed specifically for short-term scalping strategies on 1-minute timeframes. This indicator combines multiple technical analysis methods to identify high-probability entry points for both long and short positions, making it ideal for active traders seeking quick, momentum-based opportunities.
## Key Features
### Visual Signals
- **Long Entry Arrows**: Clear green triangle markers appear below price bars when bullish conditions align
- **Short Entry Arrows**: Clear red triangle markers appear above price bars when bearish conditions align
- Clean, uncluttered chart interface focusing on actionable signals
### Advanced Signal Generation
The indicator utilizes a sophisticated multi-factor approach to generate trading signals:
1. **Trend Analysis**: Employs moving average crossover methodology to identify the prevailing market direction
2. **Momentum Confirmation**: Analyzes candlestick patterns and price behavior to confirm momentum strength
3. **Volume Validation**: Incorporates volume analysis to distinguish between high-conviction and standard signals
4. **Reversal Detection**: Identifies potential trend reversals by examining recent price action patterns
5. **Precision Entry Filtering**: Uses specific candlestick characteristics to minimize false signals
### Alert System
Comprehensive alert functionality for all signal types:
- Long Entry alerts
- Short Entry alerts
## How It Works
### Long Position Signals
The indicator generates long entry signals when multiple bullish conditions simultaneously align, including:
- Confirmation of upward momentum through price action
- Specific candlestick structure indicating strong buying pressure
- Price position relative to key moving averages
- Recent price behavior suggesting reversal potential
- Volume characteristics supporting the move
### Short Position Signals
Short entry signals are generated when multiple bearish conditions converge, including:
- Confirmation of downward momentum through price action
- Specific candlestick structure indicating strong selling pressure
- Price position relative to key moving averages
- Recent price behavior suggesting reversal potential
- Volume characteristics supporting the move
### Position Management
The indicator includes intelligent position state tracking to:
- Prevent duplicate signals while in an active position
- Generate exit signals based on opposing price action
- Maintain clear status of whether you're in a long or short position
## Best Practices
### Recommended Usage
- **Timeframe**: Optimized for 1-minute charts
- **Extended Hours**: Keep extended trading hours enabled for full market coverage
- **Markets**: Works on stocks, forex, crypto, and futures
- **Strategy**: Best suited for scalping and day trading strategies
### Risk Management
- Always use proper stop-loss orders
- Consider position sizing based on account risk tolerance
- Pay attention to volume-indicated signals for higher conviction trades
- Avoid trading during low-liquidity periods
- Combine with your own risk management rules
### Trading Tips
- Higher volume signals generally indicate stronger conviction
- Wait for clear arrow signals rather than trying to anticipate them
- Monitor overall market conditions and major support/resistance levels
- Be aware of news events that may cause unusual volatility
- Practice in a paper trading account before using real capital
## Important Notes
### What This Indicator Does
✅ Provides clear visual entry signals for long and short positions
✅ Incorporates multiple technical factors for signal generation
✅ Includes volume analysis for conviction assessment
✅ Offers comprehensive alert options for all signal types
✅ Maintains position state awareness
### What This Indicator Doesn't Do
❌ Does not guarantee profitable trades
❌ Does not provide specific price targets or stop-loss levels
❌ Does not replace the need for proper risk management
❌ Does not account for fundamental analysis or news events
❌ Does not adapt settings automatically to market conditions
## Disclaimer
This indicator is provided for educational and informational purposes only. It is not financial advice, and past performance does not guarantee future results. Trading involves substantial risk of loss, and you should only trade with capital you can afford to lose. Always conduct your own research and consider consulting with a qualified financial advisor before making trading decisions.
## Configuration
This indicator uses fixed, optimized parameters that have been carefully calibrated for 1-minute scalping. No user configuration is required - simply add it to your chart and monitor for signals.
## Support
For questions, suggestions, or feedback about this indicator, please use the comments section or contact the author directly through TradingView.
---
**Version**: 6.0
**Category**: Momentum/Scalping
**Overlay**: Yes
**Timeframe**: 1 minute (optimized)

123Scalp-AHTDetector de patrones con confirmación para scalping.
Identifica Hammer/Shooting Star, Engulfing, Morning/Evening Star y Doji. Genera BUY/SELL con Entry/SL/TP (1R/1.5R/2R), opción 1-bar exit, filtro EMA, y alertas. Render Classic o Anchored (ABS) anclado al precio. No repinta tras la confirmación; pensado para intradía/scalping.
Scalp Pattern Signals — fast pattern/confirmation for intraday.
Detects Hammer/Shooting Star, Engulfing, Morning/Evening Star, and Doji. Produces BUY/SELL with Entry/SL/TP (1R/1.5R/2R), optional 1-bar exit, EMA trend filter, and alerts. Choose Classic or Anchored (ABS) rendering (anchored to price). No repaint after confirmation; built for scalping/intraday.

Reversal Point Dynamics⇋ Reversal Point Dynamics (RPD)
This is not an indicator; it is a complete system for deconstructing the mechanics of a market reversal. Reversal Point Dynamics (RPD) moves far beyond simplistic pattern recognition, venturing into a deep analysis of the underlying forces that cause trends to exhaust, pause, and turn. It is engineered from the ground up to identify high-probability reversal points by quantifying the confluence of market dynamics in real-time.
Where other tools provide a static signal, RPD delivers a dynamic probability. It understands that a true market turning point is not a single event, but a cascade of failing momentum, structural breakdown, and a shift in market order. RPD's core engine meticulously analyzes each of these dynamic components—the market's underlying state, its velocity and acceleration, its degree of chaos (entropy), and its structural framework. These forces are synthesized into a single, unified Probability Score, offering you an unprecedented, transparent view into the conviction behind every potential reversal.
This is not a "black box" system. It is an open-architecture engine designed to empower the discerning trader. Featuring real-time signal projection, an integrated Fibonacci R2R Target Engine, and a comprehensive dashboard that acts as your Dynamics Control Center , RPD gives you a complete, holistic view of the market's state.
The Theoretical Core: Deconstructing Market Dynamics
RPD's analytical power is born from the intelligent synthesis of multiple, distinct theoretical models. Each pillar of the engine analyzes a different facet of market behavior. The convergence of these analyses—the "Singularity" event referenced in the dashboard—is what generates the final, high-conviction probability score.
1. Pillar One: Quantum State Analysis (QSA)
This is the foundational analysis of the market's current state within its recent context. Instead of treating price as a random walk, QSA quantizes it into a finite number of discrete "states."
Formulaic Concept: The engine establishes a price range using the highest high and lowest low over the Adaptive Analysis Period. This range is then divided into a user-defined number of Analysis Levels. The current price is mapped to one of these states (e.g., in a 9-level system, State 0 is the absolute low, and State 8 is the absolute high).
Analytical Edge: This acts as a powerful foundational filter. The engine will only begin searching for reversal signals when the market has reached a statistically stretched, extreme state (e.g., State 0 or 8). The Edge Sensitivity input allows you to control exactly how close to this extreme edge the price must be, ensuring you are trading from points of maximum potential exhaustion.
2. Pillar Two: Price State Roc (PSR) - The Dynamics of Momentum
This pillar analyzes the kinetic forces of the market: its velocity and acceleration. It understands that it’s not just where the price is, but how it got there that matters.
Formulaic Concept: The psr function calculates two derivatives of price.
Velocity: (price - price ). This measures the speed and direction of the current move.
Acceleration: (velocity - velocity ). This measures the rate of change in that speed. A negative acceleration (deceleration) during a strong rally is a critical pre-reversal warning, indicating momentum is fading even as price may be pushing higher.
Analytical Edge: The engine specifically hunts for exhaustion patterns where momentum is clearly decelerating as price reaches an extreme state. This is the mechanical signature of a weakening trend.
3. Pillar Three: Market Entropy Analysis - The Dynamics of Order & Chaos
This is RPD's chaos filter, a concept borrowed from information theory. Entropy measures the degree of randomness or disorder in the market's price action.
Formulaic Concept: The calculateEntropy function analyzes recent price changes. A market moving directionally and smoothly has low entropy (high order). A market chopping back and forth without direction has high entropy (high chaos). The value is normalized between 0 and 1.
Analytical Edge: The most reliable trades occur in low-entropy, ordered environments. RPD uses the Entropy Threshold to disqualify signals that attempt to form in chaotic, unpredictable conditions, providing a powerful shield against whipsaw markets.
4. Pillar Four: The Synthesis Engine & Probability Calculation
This is where all the dynamic forces converge. The final probability score is a weighted calculation that heavily rewards confluence.
Formulaic Concept: The calculateProbability function intelligently assembles the final score:
A Base Score is established from trend strength and entropy.
An Entropy Score adds points for low entropy (order) and subtracts for high entropy (chaos).
A significant Divergence Bonus is awarded for a classic momentum divergence.
RSI & Volume Bonuses are added if momentum oscillators are in extreme territory or a volume spike confirms institutional interest.
MTF & Adaptive Bonuses add further weight for alignment with higher timeframe structure.
Analytical Edge: A signal backed by multiple dynamic forces (e.g., extreme state + decelerating momentum + low entropy + volume spike) will receive an exponentially higher probability score. This is the very essence of analyzing reversal point dynamics.
The Command Center: Mastering the Inputs
Every input is a precise lever of control, allowing you to fine-tune the RPD engine to your exact trading style, market, and timeframe.
🧠 Core Algorithm
Predictive Mode (Early Detection):
What It Is: Enables the engine to search for potential reversals on the current, unclosed bar.
How It Works: Analyzes intra-bar acceleration and state to identify developing exhaustion. These signals are marked with a ' ? ' and are tentative.
How To Use It: Enable for scalping or very aggressive day trading to get the earliest possible indication. Disable for swing trading or a more conservative approach that waits for full bar confirmation.
Live Signal Mode (Current Bar):
What It Is: A highly aggressive mode that plots tentative signals with a ' ! ' on the live bar based on projected price and momentum. These signals repaint intra-bar.
How It Works: Uses a linear regression projection of the close to anticipate a reversal.
How To Use It: For advanced users who use intra-bar dynamics for execution and understand the nature of repainting signals.
Adaptive Analysis Period:
What It Is: The main lookback period for the QSA, PSR, and Entropy calculations. This is the engine's "memory."
How It Works: A shorter period makes the engine highly sensitive to local price swings. A longer period makes it focus only on major, significant market structure.
How To Use It: Scalping (1-5m): 15-25. Day Trading (15m-1H): 25-40. Swing Trading (4H+): 40-60.
Fractal Strength (Bars):
What It Is: Defines the strength of the pivot detection used for confirming reversal events.
How It Works: A value of '2' requires a candle's high/low to be more extreme than the two bars to its left and right.
How To Use It: '2' is a robust standard. Increase to '3' for an even stricter definition of a structural pivot, which will result in fewer signals.
MTF Multiplier:
What It Is: Integrates pivot data from a higher timeframe for confluence.
How It Works: A multiplier of '4' on a 15-minute chart will pull pivot data from the 1-hour chart (15 * 4 = 60m).
How To Use It: Set to a multiple that corresponds to your preferred higher timeframe for contextual analysis.
🎯 Signal Settings
Min Probability %:
What It Is: Your master quality filter. A signal is only plotted if its score exceeds this threshold.
How It Works: Directly filters the output of the final probability calculation.
How To Use It: High-Quality (80-95): For A+ setups only. Balanced (65-75): For day trading. Aggressive (50-60): For scalping.
Min Signal Distance (Bars):
What It Is: A noise filter that prevents signals from clustering in choppy conditions.
How It Works: Enforces a "cooldown" period of N bars after a signal.
How To Use It: Increase in ranging markets to focus on major swings. Decrease on lower timeframes.
Entropy Threshold:
What It Is: Your "chaos shield." Sets the maximum allowable market randomness for a signal.
How It Works: If calculated entropy is above this value, the signal is invalidated.
How To Use It: Lower values (0.1-0.5): Extremely strict. Higher values (0.7-1.0): More lenient. 0.85 is a good balance.
Adaptive Entropy & Aggressive Mode:
What It Is: Toggles for dynamically adjusting the engine's core parameters.
How It Works: Adaptive Entropy can slightly lower the required probability in strong trends. Aggressive Mode uses more lenient settings across the board.
How To Use It: Keep Adaptive on. Use Aggressive Mode sparingly, primarily for scalping highly volatile assets.
📊 State Analysis
Analysis Levels:
What It Is: The number of discrete "states" for the QSA.
How It Works: More levels create a finer-grained analysis of price location.
How To Use It: 6-7 levels are ideal. Increasing to 9 can provide more precision on very volatile assets.
Edge Sensitivity:
What It Is: Defines how close to the absolute top/bottom of the range price must be.
How It Works: '0' means price must be in the absolute highest/lowest state. '3' allows a signal within the top/bottom 3 states.
How To Use It: '3' provides a good balance. Lower it to '1' or '0' if you only want to trade extreme exhaustion.
The Dashboard: Your Dynamics Control Center
The dashboard provides a transparent, real-time view into the engine's brain. Use it to understand the context behind every signal and to gauge the current market environment at a glance.
🎯 UNIFIED PROB SCORE
TOTAL SCORE: The highest probability score (either Peak or Valley) the engine is currently calculating. This is your main at-a-glance conviction metric. The "Singularity" header refers to the event where market dynamics align—the event RPD is built to detect.
Quality: A human-readable interpretation of the Total Score. "EXCEPTIONAL" (🌟) is a rare, A+ confluence event. "STRONG" (💪) is a high-quality, tradable setup.
📊 ORDER FLOW & COMPONENT ANALYSIS
Volume Spike: Shows if the current volume is significantly higher than average (YES/NO). A 'YES' adds major confirmation.
Peak/Valley Conf: This breaks down the probability score into its directional components, showing you the separate confidence levels for a potential top (Peak) versus a bottom (Valley).
🌌 MARKET STRUCTURE
HTF Trend: Shows the direction of the underlying trend based on a Supertrend calculation.
Entropy: The current market chaos reading. "🔥 LOW" is an ideal, ordered state for trading. "😴 HIGH" is a warning of choppy, unpredictable conditions.
🔮 FIB & R2R ZONE (Large Dashboard)
This section gives you the status of the Fibonacci Target Engine. It shows if an Active Channel (entry zone) or Stop Zone (invalidation zone) is active and displays the precise price levels for the static entry, target, and stop calculated at the time of the signal.
🛡️ FILTERS & PREDICTIVES (Large Dashboard)
This panel provides a status check on all the bonus filters. It shows the current RSI Status, whether a Divergence is present, and if a Live Pending signal is forming.
The Visual Interface: A Symphony of Data
Every visual element is designed for instant, intuitive interpretation of market dynamics.
Signal Markers: These are the primary outputs of the engine.
▼/▲ b: A fully confirmed signal that has passed all filters.
? b: A tentative signal generated in Predictive Mode, indicating developing dynamics.
◈ b: This diamond icon replaces the standard triangle when the signal is confirmed by a strong momentum divergence, highlighting it as a superior setup where dynamics are misaligned with price.
Harmonic Wave: The flowing, colored wave around the price.
What It Represents: The market's "flow dynamic" and volatility.
How to Interpret It: Expanding waves show increasing volatility. The color is tied to the "Quantum Color" in your theme, representing the underlying energy field of the market.
Entropy Particles: The small dots appearing above/below price.
What They Represent: A direct visualization of the "order dynamic."
How to Interpret Them: Their presence signifies a low-entropy, ordered state ideal for trading. Their color indicates the direction of momentum (PSR velocity). Their absence means the market is too chaotic (high entropy).
The Fibonacci Target Engine: The dynamic R2R system appearing post-signal.
Static Fib Levels: Colored horizontal lines representing the market's "structural dynamic."
The Green "Active Channel" Box: Your zone of consideration. An area to manage a potential entry.
Development Philosophy
Reversal Point Dynamics was engineered to answer a fundamental question: can we objectively measure the forces behind a market turn? It is a synthesis of concepts from market microstructure, statistics, and information theory. The objective was never to create a "perfect" system, but to build a robust decision-support tool that provides a measurable, statistical edge by focusing on the principle of confluence.
By demanding that multiple, independent market dynamics align simultaneously, RPD filters out the vast majority of market noise. It is designed for the trader who thinks in terms of probability and risk management, not in terms of certainties. It is a tool to help you discount the obvious and bet on the unexpected alignment of market forces.
"Markets are constantly in a state of uncertainty and flux and money is made by discounting the obvious and betting on the unexpected."
— George Soros
Trade with insight. Trade with anticipation.
— Dskyz, for DAFE Trading Systems

Multi-Average Trend Indicator (MATI)[FibonacciFlux]Multi-Average Trend Indicator (MATI)
Overview
The Multi-Average Trend Indicator (MATI) is a versatile technical analysis tool designed for traders who aim to enhance their market insights and streamline their decision-making processes across various timeframes. By integrating multiple advanced moving averages, this indicator serves as a robust framework for identifying market trends, making it suitable for different trading styles—from scalping to swing trading.
MATI 4-hourly support/resistance
MATI 1-hourly support/resistance
MATI 15 minutes support/resistance
MATI 1 minutes support/resistance
Key Features
1. Diverse Moving Averages
- COVWMA (Coefficient of Variation Weighted Moving Average) :
- Provides insights into price volatility, helping traders identify the strength of trends in fast-moving markets, particularly useful for 1-minute scalping .
- DEMA (Double Exponential Moving Average) :
- Minimizes lag and quickly responds to price changes, making it ideal for capturing short-term price movements during volatile trading sessions .
- EMA (Exponential Moving Average) :
- Focuses on recent price action to indicate the prevailing trend, vital for day traders looking to enter positions based on current momentum.
- KAMA (Kaufman's Adaptive Moving Average) :
- Adapts to market volatility, smoothing out price action and reducing false signals, which is crucial for 4-hour day trading strategies.
- SMA (Simple Moving Average) :
- Provides a foundational view of the market trend, useful for swing traders looking at overall price direction over longer periods.
- VIDYA (Variable Index Dynamic Average) :
- Adjusts based on market conditions, offering a dynamic perspective that can help traders capture emerging trends.
2. Combined Moving Average
- The MATI's combined moving average synthesizes all individual moving averages into a single line, providing a clear and concise summary of market direction. This feature is especially useful for identifying trend continuations or reversals across various timeframes .
3. Dynamic Color Coding
- Each moving average is visually represented with color coding:
- Green indicates bullish conditions, while Red suggests bearish trends.
- This visual feedback allows traders to quickly assess market sentiment, facilitating faster decision-making.
4. Signal Generation and Alerts
- The indicator generates buy signals when the combined moving average crosses above its previous value, indicating a potential upward trend—ideal for quick entries in scalping.
- Conversely, sell signals are triggered when the combined moving average crosses below its previous value, useful for exiting positions or entering short trades.
Insights and Applications
1. Scalping on 1-Minute Charts
- The MATI excels in fast-paced environments, allowing scalpers to identify quick entry and exit points based on short-term trends. With dynamic signals and alerts, traders can react swiftly to price movements, maximizing profit potential in brief price fluctuations.
2. Day Trading on 4-Hour Charts
- For day traders, the MATI provides essential insights into intraday trends. By analyzing the combined moving average and its relation to individual moving averages, traders can make informed decisions on when to enter or exit positions, capitalizing on daily price swings.
3. Swing Trading on Daily Charts
- The MATI also serves as a valuable tool for swing traders. By evaluating longer-term trends through the combined moving average, traders can identify potential swing points and adjust their strategies accordingly. The flexibility of adjusting the lengths of the moving averages allows for tailored approaches based on market volatility.
Benefits
1. Clarity and Insight
- The combination of diverse moving averages offers a clear visual representation of market trends, aiding traders in making informed decisions across multiple timeframes.
2. Flexibility and Customization
- With adjustable parameters, traders can adapt the MATI to their specific strategies, making it suitable for various market conditions and trading styles.
3. Real-Time Alerts and Efficiency
- Built-in alerts minimize response times, allowing traders to capitalize on opportunities as they arise, regardless of their trading style.
Conclusion
The Multi-Average Trend Indicator (MATI) is an essential tool for traders seeking to enhance their technical analysis capabilities. By seamlessly integrating multiple moving averages with dynamic color coding and real-time alerts, this indicator provides a comprehensive approach to understanding market trends. Its versatility makes it an invaluable asset for scalpers, day traders, and swing traders alike.
Important Note
As with any trading tool, thorough analysis and risk management are crucial when using this indicator. Past performance does not guarantee future results, and traders should always be prepared for market fluctuations.

MyTime Hybrid TargetsThis script, "MyTime Hybrid Targets," is a professional-grade trading system that combines trend-following momentum with advanced liquidity concepts and volatility-adjusted targets. It is designed to provide traders with a high-probability "Institutional-style" framework for scalping or swing trading.
Here is a point-by-point breakdown of the script’s features:
1. 4-Layer Trend Confirmation Engine
The script uses a strict multi-layer filter to ensure you only trade in the direction of the "Strong Trend."
EMA Hybrid: Uses a 13-period and 20-period EMA crossover logic to detect short-term trend direction.
SuperTrend Integration: Filters entries through the SuperTrend algorithm to ensure the price has broken structural resistance/support.
RSI Momentum Filter: Only triggers Buy signals when RSI > 50 and Sell signals when RSI < 50, ensuring positive or negative momentum is present.
2. Smart Liquidity Sweep Logic
Unlike standard indicators that fire on every crossover, this script includes a Liquidity Sweep check:
Institutional "Stop-Hunts": It identifies when the price has swept the 10-bar low (for buys) or the 10-bar high (for sells).
Smart Money Entry: This identifies the "sweep before the move," allowing you to enter where big players are entering, rather than getting caught in the trap.
3. Volatility-Filtered Candle Entries
ATR Strength Gate: Only "Strong Candles" (Marubozu or high-momentum candles) trigger a signal. The candle body must be at least 50% of the recent ATR, filtering out weak, "indecisive" price action and dojis.
4. Triple-Stage Hybrid Profit Targets
The indicator automatically projects three distinct types of profit targets the moment a signal is fired:
T1 - Structural Fibonacci (0.618): Targets the next major structural level based on the recent 20-bar swing high/low. This is your high-probability "Scalp" target.
T2 - Dynamic Zone (1.5x ATR): A volatility-adjusted target that accounts for the current market environment.
T3 - Trend Extension (2.5x ATR): Designed for "Runners" to capture larger trend extensions during high-volatility moves.
5. Clean & Actionable UI
B/S Labels: Large, clear "B" (Buy) and "S" (Sell) labels appear below and above the bars to ensure you never miss an entry.
Multi-Target Dashboard: Floating labels on the chart tell you exactly which target is which (Fib vs. Zone vs. ATR), keeping your chart organized and professional.
Best Use Cases:
Scalping: 1m to 5m timeframes for quick T1/T2 hits.
Intraday/Swing: 15m to 1h timeframes for trend-following moves toward T3.

VWAP Multi-Timeframe Pro═══════════════════════════════════════════════════════════════════════════════
VWAP Multi-Timeframe Pro - 6 VWAP + Dynamic Levels - Alphaomega18
📝 COMPLETE DESCRIPTION
═══════════════════════════════════════════════════════════════════════════════
🎯 THE MOST COMPLETE VWAP INDICATOR ON THE MARKETPLACE
VWAP Multi-Timeframe Pro simultaneously displays 6 different VWAPs (Asia/London/NY Sessions + Daily/Weekly/Monthly) with key price levels and intelligent dynamic color for complete institutional market vision.
Designed for professional traders: futures, forex, crypto, stocks. Compatible all timeframes.
🔥 WHY THIS INDICATOR IS UNIQUE
Other VWAP indicators display 1 or 2 VWAPs maximum.
**VWAP MTF Pro gives you EVERYTHING in one indicator:**
✅ **6 Simultaneous VWAPs**: Asia, London, NY, Daily, Weekly, Monthly
✅ **3 Key Price Levels**: Previous VWAP, Daily Open, Previous Close
✅ **Dynamic Color**: GREEN line if price above, RED if below
✅ **Standard Deviation Bands**: ±1σ, ±2σ, ±3σ for extreme deviations
✅ **10 Configurable Alerts**: Crossovers and extreme zones
✅ **100% Customizable**: Colors, styles, selective display
One indicator = Complete 24/7 institutional flow vision!
📊 THE 6 DISPLAYED VWAPS
🔷 **1. VWAP ASIA SESSION** (Yellow default)
→ Customizable Asian session (00:00-08:00 default)
→ Visible only during Asia session
→ Identifies key Asian trading levels
🔷 **2. VWAP LONDON SESSION** (Cyan default)
→ European session (08:00-16:00 default)
→ Visible only during London session
→ Captures European institutional flow
🔷 **3. VWAP NY SESSION** (Orange default)
→ American session (15:30-22:00 default)
→ Visible only during NY session
→ Highest volume of the day
🔷 **4. VWAP DAILY** (Blue default)
→ Full day VWAP
→ Most important level for day traders
→ Major support/resistance
🔷 **5. VWAP WEEKLY** (Purple default)
→ Weekly VWAP
→ Medium-term trend
→ Key level for swing traders
🔷 **6. VWAP MONTHLY** (Fuchsia default)
→ Monthly VWAP
→ Long-term vision
→ Major institutional levels
📍 3 ESSENTIAL PRICE LEVELS (NEW)
🔷 **PREVIOUS DAY VWAP CLOSE** (Dashed line - Dynamic color!)
**The Revolutionary Feature:**
→ Displays previous day's VWAP Daily close
→ **GREEN line** when price ABOVE = Bullish signal ✅
→ **RED line** when price BELOW = Bearish signal ❌
→ Changes color in real-time at crossover!
**Why it's powerful:**
```
If you're trading LONG and line is GREEN:
→ You're on right side of market
→ Institutions are with you
→ Hold trade with confidence
If line turns RED:
→ EXIT immediately
→ Momentum has changed
→ Institutions selling now
```
🔷 **DAILY OPEN** (White dotted default)
→ Current day's opening price
→ Major psychological level
→ Intraday support/resistance
🔷 **PREVIOUS DAY CLOSE** (Purple dotted default)
→ Previous day's close
→ Gap analysis (up/down/none)
→ Critical institutional level
📏 STANDARD DEVIATION BANDS
**3 Bands on each side of VWAP:**
→ ±1σ (68% of distribution)
→ ±2σ (95% of distribution)
→ ±3σ (99.7% of distribution)
**VWAP selection for bands:**
Choose from: Asia / London / NY / Daily / Weekly / Monthly
**Usage:**
```
Price reaches +3σ:
→ Extreme overbought
→ Reversal or consolidation likely
→ Take LONG profits or prepare SHORT
Price reaches -3σ:
→ Extreme oversold
→ Reversal or consolidation likely
→ Take SHORT profits or prepare LONG
Price between ±1σ:
→ "Normal" zone
→ Trading range
→ Wait for breakout
```
🎯 REAL USE CASES
📌 **CASE 1: MNQ Day Trading with Dynamic Color**
**Morning Setup:**
```
08:00 - Market opens
→ Price at 16,300
→ Prev Day VWAP Close at 16,250
→ Line = GREEN ✅ (price above)
→ Signal: Bullish sentiment confirmed
Action: Look for LONG setups only
Avoid: SHORT trades against trend
```
**Momentum Change:**
```
10:30 - Price drops rapidly
→ Price drops to 16,240
→ Line turns RED ❗
→ Signal: Momentum changed!
Action: EXIT LONG positions immediately
Look for: SHORT setups now
```
**Result:**
→ You stay on right side of market permanently
→ No fighting institutions
→ Profits maximized, losses minimized
📌 **CASE 2: Gap Analysis with Daily Open + Prev Close**
**Gap UP:**
```
Daily Open (white): 16,320
Prev Day Close (purple): 16,280
Gap = +40 points
Analysis:
→ Bullish gap
→ If VWAP prev line = GREEN = Continuation
→ If price retests Prev Close (purple) and bounces = LONG entry
```
**Gap DOWN:**
```
Daily Open (white): 16,240
Prev Day Close (purple): 16,280
Gap = -40 points
Analysis:
→ Bearish gap
→ If VWAP prev line = RED = Continuation
→ If price rallies to Prev Close (purple) and rejects = SHORT entry
```
📌 **CASE 3: Multi-Timeframe Confirmation**
**LONG Setup Maximum Conviction:**
```
✅ Price > VWAP Monthly (fuchsia) → Long-term bullish trend
✅ Price > VWAP Weekly (purple) → Medium-term bullish trend
✅ Price > VWAP Daily (blue) → Short-term bullish trend
✅ Prev Day VWAP = GREEN → Today's momentum bullish
✅ Price > Daily Open (white) → Positive opening
Signal: ALL timeframes aligned LONG!
Action: LONG entry with strong conviction
Stop: Below VWAP Daily
```
**SHORT Setup Maximum Conviction:**
```
✅ Price < VWAP Monthly (fuchsia) → Long-term bearish trend
✅ Price < VWAP Weekly (purple) → Medium-term bearish trend
✅ Price < VWAP Daily (blue) → Short-term bearish trend
✅ Prev Day VWAP = RED → Today's momentum bearish
✅ Price < Daily Open (white) → Negative opening
Signal: ALL timeframes aligned SHORT!
Action: SHORT entry with strong conviction
Stop: Above VWAP Daily
```
📌 **CASE 4: Session Trading (London/NY Overlap)**
**15:30 - NY Session Opens:**
```
Before 15:30:
→ Price in VWAP London (cyan)
→ Consolidation, range
15:30 - NY opens:
→ VWAP NY (orange) appears
→ Volume explodes
→ Price breaks above VWAP Daily (blue)
→ Prev Day VWAP = GREEN ✅
Action:
→ LONG entry on breakout
→ Stop below VWAP Daily
→ Target +3σ upper band
```
⚙️ COMPLETE CUSTOMIZATION
🎨 **EACH VWAP IS CONFIGURABLE:**
**For each VWAP (6 groups):**
→ Show/Hide (On/Off)
→ Customizable color
→ Line thickness (1-5)
**Asia/London/NY Sessions:**
→ Configurable start/end hours
→ Adapt to your timezone
→ Customize per market
**Forex Example:**
```
Asia: 00:00-08:00 (Tokyo)
London: 08:00-16:00 (London)
NY: 13:00-20:00 (New York)
```
**US Futures Example:**
```
Asia: 18:00-02:00 (overnight)
London: 02:00-08:30
NY: 08:30-15:00 (RTH)
```
🎨 **PREVIOUS DAY VWAP - Dynamic Color:**
→ **Dynamic Color (Green/Red)**: On/Off
• ON = Line changes color (GREEN/RED)
• OFF = Fixed color
→ **Color Above**: Color when price above (default: Green)
→ **Color Below**: Color when price below (default: Red)
→ **Static Color**: If Dynamic Color OFF (default: White)
→ **Line Width**: Thickness (1-5)
→ **Line Style**: Solid / Dashed / Dotted
🎨 **DAILY PRICE LEVELS:**
**Daily Open:**
→ Show/Hide
→ Color (default: White)
→ Thickness
→ Style (Solid/Dashed/Dotted)
**Previous Day Close:**
→ Show/Hide
→ Color (default: Purple/Fuchsia)
→ Thickness
→ Style (Solid/Dashed/Dotted)
📏 **STANDARD DEVIATION BANDS:**
→ **Show Bands**: On/Off
→ **Bands Timeframe**: Choose VWAP (Asia/London/NY/Daily/Weekly/Monthly)
→ **Standard Deviation 1/2/3**: σ values (default: 1.0 / 2.0 / 3.0)
→ **Upper Colors**: Customizable
→ **Lower Colors**: Customizable
👁️ **DISPLAY:**
→ **Show Labels**: Display price labels (On/Off)
→ **Label Size**: Tiny / Small / Normal / Large
🔔 COMPLETE ALERTS (10 ALERTS)
**VWAP Daily Crossovers:**
1. Price > VWAP Daily
2. Price < VWAP Daily
**Extreme Bands:**
3. Price reaches +3σ
4. Price reaches -3σ
**Previous Day VWAP:**
5. Price > Previous Day VWAP
6. Price < Previous Day VWAP
**Daily Open:**
7. Price > Daily Open
8. Price < Daily Open
**Previous Day Close:**
9. Price > Previous Close
10. Price < Previous Close
💡 MARKETS AND TIMEFRAMES
✅ **ALL markets compatible:**
• Futures (ES, NQ, YM, RTY, MNQ, MES, etc.)
• Forex (EUR/USD, GBP/USD, USD/JPY, etc.)
• Crypto (BTC, ETH, altcoins - 24/7)
• Stocks (Tesla, Apple, Nvidia, etc.)
• Indices (S&P 500, Nasdaq, Dow Jones)
• Commodities (Gold, Oil, etc.)
✅ **All timeframes:**
• Scalping: 1min, 5min
• Day Trading: 15min, 30min, 1H ⭐ (optimal!)
• Swing Trading: 4H, Daily
• Position Trading: Weekly
Note: More reliable with real volume data
→ TradingView Premium recommended for tick data
🏆 UNIQUE ADVANTAGES
✅ **6 Simultaneous VWAPs**: Complete multi-timeframe vision
✅ **Dynamic color**: GREEN/RED for instant vision
✅ **3 Price levels**: Prev VWAP + Open + Prev Close
✅ **Standard deviation bands**: ±3σ for extreme zones
✅ **Customizable sessions**: Asia/London/NY adaptable
✅ **10 alerts**: All key crossovers
✅ **100% customizable**: Colors, styles, display
✅ **Automatic labels**: Real-time price display
✅ **Optimized code**: Light, fast, no lag
✅ **No repaint**: Reliable and stable signals
📊 RECOMMENDED CONFIGURATION
**For MNQ/ES Day Trading (15min):**
```
═══ VWAP Sessions ═══
Asia: ✅ ON (Yellow)
London: ✅ ON (Cyan)
NY: ✅ ON (Orange)
═══ VWAP Timeframes ═══
Daily: ✅ ON (Blue)
Weekly: ✅ ON (Purple)
Monthly: ❌ OFF (too long-term)
═══ Previous Day VWAP ═══
Show: ✅ ON
Dynamic Color: ✅ ON (CRITICAL!)
Color Above: Green
Color Below: Red
Width: 2-3
═══ Daily Price Levels ═══
Daily Open: ✅ ON (White dotted)
Prev Day Close: ✅ ON (Purple dotted)
═══ Bands ═══
Show Bands: ✅ ON
Timeframe: Daily
σ: 1.0 / 2.0 / 3.0
═══ Display ═══
Labels: ✅ ON
Size: Small
```
**For Scalping (1-5min):**
```
Sessions: Asia/London/NY by hour
Daily/Weekly: ON
Monthly: OFF
Prev Day VWAP: ON with Dynamic Color
Bands: Daily, ±2σ max
Labels: Small or Tiny
```
**For Swing Trading (4H-Daily):**
```
Sessions: OFF (not relevant)
Daily: ON
Weekly: ON
Monthly: ON
Prev Day VWAP: ON
Bands: Weekly, ±3σ
Labels: Normal or Large
```
🎓 QUICK USAGE GUIDE
**Simple Rules for Day Traders:**
1. **Prev VWAP Line Color = Day Direction**
→ GREEN = Trade LONG only
→ RED = Trade SHORT only
2. **Price above ALL VWAPs = Maximum bullish**
→ Look for LONG setups only
→ No SHORT counter-trend
3. **Price below ALL VWAPs = Maximum bearish**
→ Look for SHORT setups only
→ No LONG counter-trend
4. **Price between VWAPs = Neutral zone**
→ Wait for clear breakout
→ Range-bound, careful scalp
5. **±3σ bands = Extreme zones**
→ Take profits
→ Or wait for reversal
💪 TRADER PSYCHOLOGY
**What this indicator solves:**
❌ "I don't know if trend continues"
→ Check prev VWAP line color: GREEN = continues
❌ "I take profits too early from fear"
→ As long as line GREEN, hold LONG with confidence
❌ "I hold my losses too long"
→ Line turns RED? EXIT immediately!
❌ "I trade counter-trend"
→ 6 VWAPs visible = Impossible to mistake direction
❌ "I don't know where to put stop"
→ Stop below VWAP Daily for LONG, above for SHORT
**Result:**
✅ Increased confidence
✅ Reinforced discipline
✅ Maximized profits
✅ Trading with institutions
🔗 PERFECT COMPLEMENT
**Combine VWAP MTF Pro with:**
• **Order Flow Signals** → Institutional absorptions (💎▲🚀)
• **Order Flow CVD** → Real-time order flow
• **Fair Value Gaps** → Inefficiency zones
• **Market Profile** → POC/VPOC
**VWAP MTF Pro** = Institutional price levels
**Order Flow** = Flow confirmation
→ Complete trading system!
⚠️ DISCLAIMER
Technical indicators are decision support tools. No indicator guarantees profits. Always use:
• Appropriate risk management
• Stop loss on every trade
• Proper position sizing
• Demo account testing first
VWAP MTF Pro improves your analysis but doesn't replace a complete strategy with money management.
🚀 INSTALLATION
1. Copy the Pine Script code
2. Open Pine Editor in TradingView
3. Paste the code
4. Click "Add to Chart"
5. Indicator displays on chart (overlay)
6. Configure parameters to your preferences
7. Activate desired alerts
8. Trade with complete institutional vision!
💡 PRO TIP
**The Golden VWAP Rule:**
"NEVER trade against ALL aligned VWAPs"
If Monthly + Weekly + Daily ALL point down:
→ Bearish market on ALL timeframes
→ Trade SHORT only
→ No LONG = Suicide
If Monthly + Weekly + Daily ALL point up:
→ Bullish market on ALL timeframes
→ Trade LONG only
→ No SHORT = Lost money
This simple rule can **save your account**!
📞 CONTACT AND SUPPORT
Created by Alphaomega18
For questions, bugs or suggestions:
Find my other indicators:
• Order Flow Signals (institutional signals)
• Order Flow Dashboard (CVD oscillator)
• Order Flow CVD Simple (trend vision)
• Fair Value Gap Detector
• Volume & Volatility Crisis Detector

CVD Oscillator - Alphaomega18ORDER FLOW DASHBOARD OSCILLATOR - TRADINGVIEW PUBLICATION (ENGLISH)
Created by Alphaomega18
═══════════════════════════════════════════════════════════════════════════════
📌 PUBLICATION TITLE
═══════════════════════════════════════════════════════════════════════════════
Order Flow Dashboard - CVD Oscillator & Pressures - Alphaomega18
📝 COMPLETE DESCRIPTION
═══════════════════════════════════════════════════════════════════════════════
🎯 TRACK INSTITUTIONAL FLOW IN REAL-TIME
Order Flow Dashboard Oscillator is an advanced indicator that displays CVD (Cumulative Volume Delta) as a percentage oscillator, combined with real-time buy/sell pressures.
Unlike traditional CVD indicators where raw CVD reaches millions and crushes other data, this oscillator displays CVD deviation from its average in %, allowing clear reading on the SAME scale as pressures.
🔥 THE PROBLEM SOLVED
Classic CVD indicator problem:
✗ Raw CVD climbs to 1,000,000+ → Unreadable
✗ Pressures stay small (0-500) → Invisible
✗ Impossible to see both simultaneously
✗ Cluttered and confusing chart
Solution with CVD Oscillator:
✅ CVD displayed as % deviation (oscillates around 0)
✅ Pressures normalized on same scale
✅ EVERYTHING visible simultaneously
✅ Clear and intuitive reading
📊 INDICATOR COMPONENTS
🔷 CVD OSCILLATOR (Thick white line)
Traditional CVD accumulates infinitely:
→ Raw CVD = 50,000 ... 100,000 ... 500,000 ... 1,000,000+
→ Hard to interpret
CVD Oscillator shows DEVIATION:
→ CVD Oscillator = +5% ... +12% ... -3% ... -8%
→ Easy to interpret!
**How it works:**
• Calculates distance between CVD and its moving average (20 periods default)
• Converts to percentage
• Oscillates around 0 (gray center line)
**Interpretation:**
• **Above 0** → CVD > Average = BULLISH trend
• **Below 0** → CVD < Average = BEARISH trend
• **+10% zone** (green dotted line) → Buyer strength
• **-10% zone** (red dotted line) → Seller strength
🔷 BUY/SELL PRESSURES (Green/Red zones)
**Buy Pressure (Green zone)**
→ Calculated on bullish candles
→ Proportional to candle size
→ Normalized for optimal visibility
**Sell Pressure (Red zone)**
→ Calculated on bearish candles
→ Proportional to candle size
→ Normalized for optimal visibility
**Extreme Pressures** (Background)
→ 🟢 Light green background = EXTREME buy pressure (delta > 2x average)
→ 🔴 Light red background = EXTREME sell pressure (delta < -2x average)
🔷 REAL-TIME DASHBOARD (Top right corner)
Displays 6 key metrics:
1. **CVD Osc**: Oscillator value in %
2. **CVD Raw**: Raw CVD value (reference)
3. **Trend**: 🟢 Bullish or 🔴 Bearish
4. **Delta**: Current candle delta
5. **Volume**: HIGH (spike) or Normal
6. **Pressure**: 🚀 BUY / 💥 SELL / Neutral
🎯 HOW TO USE IT
📌 CASE 1: HOLD TRADES LONGER
**Classic problem:**
→ You're in a LONG
→ Price pulls back slightly, you panic
→ You exit... then price resumes up
→ Frustration: "I was right but exited too early!"
**Solution with CVD Oscillator:**
Example LONG trade:
1. You enter LONG on breakout
2. You watch CVD Oscillator
3. **As long as it stays ABOVE 0** → Keep the trade
4. Institutions continue accumulating
5. Trend remains intact
Exit:
→ CVD Oscillator **crosses below 0**
→ Signal: Institutions now selling
→ You exit or take profits
**Result:**
✅ You maximize your gains
✅ You exit at right time (when flow changes)
✅ You don't panic on small corrections
📌 CASE 2: CONFIRM TREND STRENGTH
**Setup:**
→ Price in uptrend
→ But is it real trend or just noise?
**Check CVD Oscillator:**
STRONG trend:
→ CVD Oscillator **stays positive** (+5%, +8%, +12%)
→ Dominant buy pressures (green zones)
→ Few or no red backgrounds
WEAK trend:
→ CVD Oscillator **oscillates around 0** (+2%, -1%, +3%)
→ Mixed pressures (green and red alternate)
→ Lack of conviction
**Action:**
✅ Strong trend → Trade with confidence
⚠️ Weak trend → Be cautious or avoid
📌 CASE 3: DETECT TREND CHANGE
**CVD Oscillator Divergence:**
Price makes higher highs BUT:
→ CVD Oscillator makes lower highs
→ +15% ... +12% ... +8% (progressive decline)
→ Sell pressures increasing
Signal: Distribution in progress
→ Institutions selling into rally
→ Reversal likely
→ Prepare SHORT or exit LONG
📌 CASE 4: OPTIMAL ENTRY TIMING
**Situation:**
→ Price consolidating
→ You wait for signal to enter
**LONG entry signal:**
→ CVD Oscillator **crosses above 0**
→ Green background (extreme buy pressure) appears
→ Dashboard: 🚀 BUY
Action: Enter LONG immediately
**SHORT entry signal:**
→ CVD Oscillator **crosses below 0**
→ Red background (extreme sell pressure) appears
→ Dashboard: 💥 SELL
Action: Enter SHORT immediately
⚙️ CUSTOMIZABLE PARAMETERS
🔧 **CVD Moving Average Length** (default: 20)
→ Moving average period for oscillator
→ Shorter (10-15) = More reactive, more signals
→ Longer (30-50) = Smoother, fewer false signals
👁️ **Show CVD Oscillator** (On/Off)
→ Show/hide CVD Oscillator line
👁️ **Show Buy/Sell Pressure** (On/Off)
→ Show/hide pressure zones
👁️ **Show Info Dashboard** (On/Off)
→ Show/hide information table
📊 RECOMMENDED CONFIGURATIONS
**For Day Trading (15min-1H):**
```
CVD MA Length: 20
Show CVD Oscillator: ✅ ON
Show Buy/Sell Pressure: ✅ ON
Show Info Dashboard: ✅ ON
```
**For Scalping (1-5min):**
```
CVD MA Length: 10 (more reactive)
Show CVD Oscillator: ✅ ON
Show Buy/Sell Pressure: ✅ ON
Show Info Dashboard: ✅ ON
```
**For Swing Trading (4H-Daily):**
```
CVD MA Length: 30 (smoother)
Show CVD Oscillator: ✅ ON
Show Buy/Sell Pressure: ✅ ON
Show Info Dashboard: ✅ ON
```
💡 MARKETS AND TIMEFRAMES
✅ **ALL markets compatible:**
• Futures (ES, NQ, YM, RTY, MNQ, MES, etc.)
• Forex (EUR/USD, GBP/USD, USD/JPY, etc.)
• Crypto (BTC, ETH, altcoins)
• Stocks (Tesla, Apple, Nvidia, etc.)
• Indices (S&P 500, Nasdaq, Dow Jones)
✅ **All timeframes:**
• Scalping: 1min, 5min
• Day Trading: 15min, 30min, 1H ⭐ (optimal!)
• Swing Trading: 4H, Daily
Note: More reliable with real volume data
→ TradingView Premium recommended
🏆 UNIQUE ADVANTAGES
✅ **CVD Oscillator**: % deviation instead of raw value
✅ **Same scale**: CVD and pressures visible together
✅ **Intuitive reading**: Above/below 0
✅ **Normalized pressures**: Always visible
✅ **Real-time dashboard**: 6 key metrics
✅ **Strength zones**: +10% and -10% marked
✅ **Background alerts**: Visual extreme pressures
✅ **Optimized code**: Light and fast
✅ **No repaint**: Reliable signals
🔗 PERFECT COMPLEMENT
Use with **Order Flow Signals** for complete system:
• **Order Flow Signals** (overlay=true) → Signals on chart
→ 💎 Absorptions, ▲ Divergences, 🚀 Pressures
• **Order Flow Dashboard** (overlay=false) → CVD and metrics
→ CVD Oscillator, Pressures, Live dashboard
**Complete system = 360° order flow vision!**
🎓 QUICK INTERPRETATION
**CVD Oscillator:**
• +5% to +10% = Moderate bullish
• +10% and above = STRONG bullish
• -5% to -10% = Moderate bearish
• -10% and below = STRONG bearish
• Near 0 = Neutral / Consolidation
**Pressures:**
• Large green zones = Dominant buying
• Large red zones = Dominant selling
• Balanced = Indecision
**Dashboard:**
• 🟢 Bullish + 🚀 BUY = Strong LONG signal
• 🔴 Bearish + 💥 SELL = Strong SHORT signal
• Massive positive delta = Bullish momentum
• Massive negative delta = Bearish momentum
⚠️ DISCLAIMER
Technical indicators are decision support tools. No indicator guarantees profits. Always use:
• Appropriate risk management
• Stop loss on every trade
• Proper position sizing
• Demo account testing first
Order Flow Dashboard improves your analysis but doesn't replace a complete strategy.
🚀 INSTALLATION
1. Copy the Pine Script code
2. Open Pine Editor in TradingView
3. Paste the code
4. Click "Add to Chart"
5. Indicator displays in separate pane (below)
6. Configure parameters to your preferences
7. Combine with Order Flow Signals for complete system!
💡 USAGE TIPS
**Golden Rule for Holding Trades:**
→ LONG: Keep as long as CVD Osc > 0
→ SHORT: Keep as long as CVD Osc < 0
**Strength Signals:**
→ CVD Osc > +10% = Very bullish
→ CVD Osc < -10% = Very bearish
**Trend Change:**
→ CVD Osc crosses 0 = Potential change
→ + Extreme background = Strong confirmation
📞 CONTACT AND SUPPORT
Created by Alphaomega18
For questions, bugs or suggestions:
Find my other indicators:
• Order Flow Signals (signals on chart)
• VWAP Multi-Timeframe Pro
• Fair Value Gap Detector
• Volume & Volatility Crisis Detector

MA Candle Color [TheScalpingAnt]MA Candle Color
OVERVIEW
MA Candle Color is a visual indicator that transforms your trading experience by providing instant, real-time feedback on price position relative to your chosen Moving Average.
What makes it unique?
• Real-time visual clarity: The current forming candle changes color dynamically based on its position relative to the MA
• Zero lag: Instant visual feedback as price moves
• Clean charts: Only the active candle is colored - no chart clutter
• Professional design: Sleek, minimalist approach that enhances decision-making
Perfect for:
• Day traders seeking instant trend confirmation
• Scalpers who need split-second decision support
• Swing traders monitoring trend alignment
• Any trader who values visual clarity and speed
CONCEPTS
The Power of Visual Trading
Traditional indicators require constant interpretation. MA Candle Color eliminates this cognitive load by providing instant visual feedback through intelligent candle coloring.
Core Principle
The indicator operates on a simple but powerful concept:
• Green Candle = Price is above the Moving Average (bullish territory)
• Red Candle = Price is below the Moving Average (bearish territory)
Why Only the Current Candle?
-Unlike other indicators that color all candles, MA Candle Color focuses exclusively on the NOW:
-Eliminates visual noise
-Keeps your focus on current market conditions
-Prevents analysis paralysis
-Maintains clean chart aesthetics
-The Moving Average Foundation
-Moving Averages are one of the most trusted tools in technical analysis. This indicator leverages reliability while adding a modern, intuitive visual layer.
FEATURES
Real-Time Dynamic Coloring
• Current candle changes color instantly as it forms
• Green when price crosses above MA
• Red when price crosses below MA
• Automatic color reset when candle closes
Precision Engineering
• Zero repainting - what you see is what you get
• Lightweight code - no performance impact
• Compatible with all timeframes and instruments
Full Color Customization
-Choose your own bullish color (default: vibrant green)
-Choose your own bearish color (default: professional red)
-Match your chart theme perfectly
-High visibility options for all screen types
-Clean Visual Design
-MA plotted as subtle gray line
-Works seamlessly with other indicators
CUSTOMIZATION
Complete Control Over Your Trading Experience
MA Length (Default: 8)
Adjust from 1 to any value
Shorter periods (5-20): Responsive, ideal for scalping/day trading
Medium periods (20-50): Balanced for swing trading
Longer periods (50-200): Trend following and position trading
MA Type (Default: EMA)
• SMA: Best for identifying major support/resistance levels, classic, smooth trend identification
• EMA: Ideal for fast-moving markets and quick trend changes, responsive to recent price action
• WMA: Great for balanced trend analysis, balanced approach with recent price emphasis
• VWMA: Perfect when volume analysis is crucial, incorporates volume for institutional insight
• HMA: Excellent for reducing noise in volatile markets, incorporates volume for institutional insight
Recommended Configurations
For Day Trading:
• MA Length: 8-13
• MA Type: EMA or HMA
• High contrast colors
For Swing Trading:
• MA Length: 21-50
• MA Type: EMA or SMA
• Professional, subtle colors
For Scalping:
• MA Length: 5-8
• MA Type: EMA or HMA
• Bright, high-visibility colors
USAGE
Getting Started (3 Simple Steps)
Step 1: Add to Chart
• Search "MA Candle Color" in TradingView indicators
• Click to add to your chart
• Indicator loads with optimized default settings
Step 2: Customize (Optional)
• Click the settings gear icon
• Adjust MA length to match your trading timeframe
• Select your preferred MA type
• Choose your custom colors
Step 3: Trade with Confidence
• Watch the current candle color in real-time
• Green = Bullish momentum (price above MA)
• Red = Bearish momentum (price below MA)
• Use as confirmation with your existing strategy
Trading Applications
Trend Confirmation
• Green candle confirms uptrend continuation
• Red candle confirms downtrend continuation
• Color changes signal potential trend shifts
Entry Timing
• Enter long when candle turns green with other confirmations
• Enter short when candle turns red with other confirmations
• Use as a filter to avoid counter-trend trades
Exit Signals
• Exit longs when candle turns red
• Exit shorts when candle turns green
• Protect profits by respecting color changes
Multi-Timeframe Analysis
• Use on higher timeframe for trend direction
• Use on lower timeframe for precise entries
• Align colors across timeframes for high-probability setups
Pro Tips
Combine with Support/Resistance: Use color changes at key levels for powerful signals
Volume Confirmation: Look for color changes with volume spikes for stronger moves
Multiple MAs: Add multiple instances with different lengths (e.g., 8 EMA, 21 EMA, 50 SMA)
Risk Management: Never trade on color alone - use proper stop losses and position sizing
CONCLUSION
Why MA Candle Color is Essential for Modern Traders?
In today's fast-paced markets, speed and clarity are everything. MA Candle Color delivers both by transforming complex Moving Average analysis into instant visual feedback.
Key Benefits Recap
-Faster Decision Making - No more mental calculations
-Reduced Errors - Visual clarity prevents mistakes
-Professional Appearance - Clean, distraction-free charts
-Universal Application - Works with any strategy or market
-Fully Customizable - Adapts to your exact needs
-Zero Repainting - Reliable, honest signals
-Lightweight - No performance impact
Who Benefits Most?
-Day Traders: Instant trend confirmation for quick entries/exits
-Scalpers: Split-second visual feedback for rapid trading
-Swing Traders: Clear trend alignment across timeframes
-Beginners: Simplified MA analysis without complexity
-Professionals: Clean visual layer for existing strategies
The Competitive Edge
While others are calculating price vs MA in their heads, you'll have instant visual confirmation. While they're second-guessing crossovers, you'll be executing with confidence. While their charts are cluttered with colored history, yours will be clean and focused on NOW.

RMI Valid FVG & IFVGRMI • Valid FVG & iFVG (Smart Money Concept)
RMI • Valid FVG & iFVG is a precision-focused Fair Value Gap indicator designed for traders who follow Smart Money Concepts (SMC) / ICT logic and want to filter out low-quality, random gaps.
This indicator does not plot every FVG.
It highlights only structurally relevant FVGs that form in the direction of the trend and have a high probability of being filled.
Core Features
Bullish & Bearish Fair Value Gaps
Inverse Fair Value Gaps (iFVG)
Trend-aligned FVG filtering
Automatic invalidation after mitigation
Clean background zones for clear visibility
Optimized for intraday trading
Adjustable settings for scalping, intraday & swing trading
Smart Filtering Logic
FVGs are validated using market structure context
Only FVGs that form within the active trend are displayed
Weak or low-probability gaps are ignored
Inverse FVGs appear after strong displacement and rejection
Zones are visually faded once mitigated
This helps reduce chart noise and keeps the focus on high-probability reaction zones.
Best Use Cases
Entry refinement after BOS / CHoCH
Confluence with liquidity grabs
Premium / discount zone trading
Intraday & session-based trading
Works well with ICT, SMC, price action & structure-based strategies
Recommended Timeframes
Scalping: M1 – M5
Intraday (default): M5 – M15
Swing Trading: M15 – H1
(Default settings are optimized for intraday trading.)
Important Notes
This is not a signal indicator
No repainting
No buy/sell arrows
Designed as a decision-support tool, not an automated system
Always combine with proper risk management and confirmation.
RMI • Precision over noise.
Trade structure, not randomness.

DR.SS.SMART BUY/SMARTSELL SCALPER1️⃣ BEST TIMEFRAME
Use this as a scalper / intraday trend tool
✅ Best
5 min
15 min
⚠️ Avoid
1 min (too noisy)
Daily (signals become late)
2️⃣ FIRST CHECK – MARKET CONDITION (Dashboard)
Before taking any trade, look at the Smart Panel (Dashboard):
✔ Trade ONLY when:
Market State = Trending
Volatility = Active
Trend Pressure = Bullish or Bearish
At least 3–4 MTF boxes are same color
❌ Avoid trades when:
Market State = No trend / Ranging
Purple candles (ADX sideways)
Remember:
T-V-T rule → Trend + Volatility + Timeframe agree
3️⃣ BUY SETUP (LONG TRADE)
✅ Conditions in your code:
Price crosses ABOVE Supertrend
Close ≥ SMA 13
Bar color turns BLUE
Price above EMA 200 → Smart Buy
ADX not sideways (no purple bars)
📍 Chart shows label:
“Buy” → normal buy
“Smart Buy” → high-probability trade (BEST)
🔵 HOW TO ENTER BUY
Enter at candle CLOSE where Buy / Smart Buy appears
Do NOT enter mid-candle
🛑 STOP LOSS (Auto from code)
SL = ATR-based stop
Shown as red SL line
👉 Safe rule:
Never widen SL
🎯 TARGETS (Auto plotted)
TP1 = 1:1
TP2 = 2:1
TP3 = 3:1
📌 Recommended management:
Book 50% at TP1
Move SL to Entry
Hold rest till TP2 / Trail
4️⃣ SELL SETUP (SHORT TRADE)
✅ Conditions:
Price crosses BELOW Supertrend
Close ≤ SMA 13
Bar color turns RED
Price below EMA 200 → Smart Sell
No sideways (ADX > 15)
📍 Label shown:
“Sell”
“Smart Sell” (BEST)
🔴 HOW TO ENTER SELL
Enter at close of signal candle
Follow same SL & TP rules
5️⃣ SUPPLY & DEMAND CONFIRMATION (POWER FILTER)
🔹 Best Buy:
Price near Demand Zone
Then Smart Buy appears
🔹 Best Sell:
Price near Supply Zone
Then Smart Sell appears
👉 These are institutional entries
6️⃣ WHEN NOT TO TRADE ❌
Avoid trades when:
Purple candles (Sideways)
Supertrend flipping repeatedly
MTF dashboard mixed colors
During low-volume sessions
7️⃣ SESSION WISE BEST PERFORMANCE
From your session logic:
✅ Best Scalping:
London
London + New York overlap
⚠️ Avoid:
Mid-Tokyo (low volatility)
8️⃣ PERFECT TRADE CHECKLIST (SAVE THIS)
Before clicking BUY/SELL, ask:
✔ Smart Buy / Smart Sell?
✔ Price above/below EMA 200?
✔ Dashboard trend agrees?
✔ No sideways candles?
✔ Volatility Active?
👉 If 4 out of 5 = YES → TAKE TRADE
9️⃣ SIMPLE ONE-LINE STRATEGY
Trade only Smart Buy/Sell in trending market, book partial at 1:1, trail rest with Smart Trail
✅ BEST TRADING SESSIONS (Use ONLY these)
🥇 LONDON SESSION (BEST & SAFE)
🕒 12:30 PM – 4:30 PM IST
Why best for your script
Clean trends
Good volatility
Less fake signals
Supertrend + EMA200 works perfectly
👉 This should be your PRIMARY session
🥈 LONDON → NEW YORK OVERLAP (MOST POWERFUL)
🕒 6:00 PM – 8:30 PM IST
Why
Institutional money enters
Strong breakouts
Smart Buy / Smart Sell accuracy highest
👉 Use only Smart signals in this session
🥉 NEW YORK SESSION (Early Part Only)
🕒 6:00 PM – 9:00 PM IST
Use when
Market State = Trending
Volatility = Active
MTF mostly same color
⚠️ Stop after 9:00 PM IST
❌ SESSIONS TO AVOID
🚫 TOKYO SESSION
🕒 5:30 AM – 10:30 AM IST
Low volatility
Sideways (purple candles)
Many fake reversals
🚫 SYDNEY SESSION
🕒 2:30 AM – 5:30 AM IST
Very low volume
Not suitable for scalping
🚫 INDIAN MIDDAY
🕒 11:00 AM – 12:15 PM IST
Choppy
Stop-hunting candles
📌 BEST DAILY ROUTINE (Follow This)
Time (IST) Action
9:15 – 10:30 ❌ Avoid (fake moves)
12:30 – 4:30 ✅ TRADE (Best zone)
6:00 – 8:30 ✅ TRADE (High accuracy)
After 9:00 ❌ Avoid
🧠 EASY MEMORY RULE (Your Style)
“LON → NY = MONEY” 💰
“ASIA = NO TRADE” ❌
🎯 FINAL RECOMMENDATION
If you want only ONE session:
👉 Trade ONLY: 12:30 PM – 4:30 PM IST
This will give:
Less stress
Higher win-rate
Cleaner Smart Buy/Sell signals
🇮🇳 BEST TRADING SESSIONS (INDIA – IST)
🥇 LONDON SESSION – BEST FOR INDIAN TRADERS
🕒 12:30 PM – 4:30 PM IST
✅ THIS IS THE BEST SESSION
Strong trend moves
High accuracy Smart Buy / Smart Sell
Less sideways (purple candles reduce)
Works perfectly with Supertrend + EMA 200
👉 Use this as your MAIN session
🥈 LONDON → NEW YORK OVERLAP (POWER SESSION)
🕒 6:00 PM – 8:30 PM IST
✅ Very strong moves
Institutional activity
Best breakouts
High RR trades (2:1 / 3:1)
⚠️ Trade only Smart Buy / Smart Sell
⚠️ Avoid over-trading
🥉 INDIAN MARKET OPEN (LIMITED USE)
🕒 9:20 AM – 10:15 AM IST
✔ Use only if:
Dashboard = Trending
Volatility = Active
Direction same as higher TF
❌ Avoid after 10:30 AM
❌ SESSIONS TO AVOID (INDIA)
Session Time (IST) Reason
Tokyo 5:30 – 10:30 AM Sideways / fake moves
Mid-day Chop 11:00 – 12:15 PM Low volume
Late NY After 9:00 PM Whipsaws
📌 BEST DAILY ROUTINE (INDIA)
Time What to Do
9:15 – 9:20 ❌ No trade
9:20 – 10:15 ⚠️ Only clean Smart signals
12:30 – 4:30 ✅ MAIN TRADING WINDOW
6:00 – 8:30 ✅ HIGH PROBABILITY
After 9:00 ❌ Stop trading
🧠 EASY MEMORY RULE
“INDIA → LONDON → MONEY” 💰
“ASIA MIDDAY → NO TRADE” ❌
🎯 FINAL ANSWER (ONE-LINE)
👉 For India (IST), trade ONLY between
12:30 PM – 4:30 PM and 6:00 PM – 8:30 PM

Trend Gazer: Unified ICT Trading System with Signals# Trend Gazer User Guide (English)
## 📖 Table of Contents
1. (#about-this-indicator)
2. (#quick-start-guide-3-steps)
3. (#detailed-usage)
4. (#settings-customization)
5. (#why-combine-multiple-features)
6. (#faq)
---
## About This Indicator
**Trend Gazer** is an integrated trading system designed to read institutional order flow like professional traders.
### 🎯 3 Problems This Indicator Solves
#### ❌ Problem 1: Too Many Indicators = Information Overload
```
Normal: RSI + MACD + Moving Average + Bollinger Bands... → Cluttered chart
Solution: All integrated into ONE indicator → Clean & Clear
```
#### ❌ Problem 2: Single Indicators Give False Signals
```
Normal: Enter based on RSI alone → Frequent stop-outs
Solution: Structure × Zone × Momentum multi-angle confirmation → Higher win rate
```
#### ❌ Problem 3: Unclear Entry Timing
```
Normal: Know the trend but don't know WHERE to enter
Solution: LS Bounce Signal shows EXACT entry points
```
---
## Quick Start Guide (3 Steps)
### 🚀 STEP 1: Confirm Trend Direction
**Look for CHoCH (Change of Character)**
```
📍 (1.CHoCH) label = Uptrend starting
📍 (a.CHoCH) label = Downtrend starting
```
**Important**: Wait for CHoCH! No direction without it.
---
### 🎯 STEP 2: Find Entry Points
**Wait for LS Bounce Signal (green/red labels)**
```
🟢 "Long@ HL only" label → LONG (buy) candidate
🔴 "Short@ LH only" label → SHORT (sell) candidate
```
**Label text color meaning**:
- **White text**: Clean trend (high confidence)
- **Yellow text**: Trend transition (moderate caution)
---
### 🛡️ STEP 3: Final Confirmation with Bar Color
**Bar color shows market state**
```
🔴 Red bar: BUY zone (buying is favored)
🟢 Green bar: SELL zone (selling is favored)
⚪ White bar: Neutral (wait and see)
```
---
## Detailed Usage
### 📊 Understanding the Chart
#### 1. Labels (Market Structure Changes)
```
(1.CHoCH) / (a.CHoCH) : Trend reversal
(2.SiMS) / (b.SiMS) : Momentum confirmation
(3.BoMS) / (c.BoMS) : Trend continuation
```
#### 2. Boxes (Institutional Order Zones)
```
📦 Blue boxes: Bullish OB (buy orders accumulated)
📦 Red boxes: Bearish OB (sell orders accumulated)
📦 Black transparent boxes: Liquidity Sweep
```
**How to use Order Blocks**:
- Function as support/resistance
- Signals within OB have higher reliability
- Use for stop-loss placement
#### 3. Lines (Trends and Support/Resistance)
```
━━━ Red lines: EMA20, EMA50, EMA100 (short to mid-term trends)
━━━ Blue lines: 60min NPR/BB bands (support/resistance)
```
#### 4. Bar Colors (Filter 6)
```
Bar color = Real-time market state
🔴 Red: Buying is favored
🟢 Green: Selling is favored
⚪ White: Neutral
```
---
### 🎯 Practical Trading Flow
#### 📍 Preparation Phase
```
1. Open chart (recommended: 5min or 15min)
2. Add Trend Gazer to chart
3. Start in observation mode (don't enter yet)
```
#### 📍 Entry Decision
```
✅ CHoCH confirms direction → Uptrend starting
✅ LS Bounce Signal "Long@ HL only" appears
→ Entry point candidate
✅ Bar turns red → Market supports buying
→ Entry decision 🎯
✅ Place stop below nearest Order Block (blue box)
```
#### 📍 Exit Decision
```
🔴 Opposite LS Bounce Signal "Short@ LH only" appears
→ Consider taking profit
🔴 Bar turns green
→ Potential trend reversal, review position
🔴 Stop loss hit
→ Exit with loss
```
---
### 💡 Tips for Higher Win Rate
#### ✅ DO's
```
1. Enter AFTER CHoCH appears
2. Prioritize white-text LS Bounce Signals
3. Check higher timeframe (1H or Daily) trend
4. Emphasize signals within Order Blocks
5. Use bar color as final confirmation
```
#### ❌ DON'Ts
```
1. Enter before CHoCH → No clear direction
2. Enter only on yellow text → Unstable transition period
3. Ignore bar color → Trading against market state
4. Don't check Order Blocks → Unclear support/resistance
5. Enter same direction consecutively → Overtrading
```
---
## Settings Customization
### 🔧 How to Open Settings
```
1. Right-click on indicator name on chart
2. Select "Settings..."
3. Settings panel opens
```
---
### 📋 Recommended Setting Profiles
#### 🔰 Beginner Settings (Simple)
**Goal**: Reduce noise, show only important signals
```
【FILTERS】
✅ Bonus Filter: ON
✅ Filter 6 (OB/BB/NPR Zone Filter): ON
❌ Direction Filter: OFF
❌ Liquidation Reversal Filter: OFF
❌ ICT Market Structure Filter: OFF
❌ EMA Trend Filter: OFF
❌ OB/FVG Filter 1: OFF
❌ OB/FVG Filter 2: OFF
【SIGNALS】
✅ Signal 0 (Bonus): ON
✅ Signal 1 (VWC Change): ON
✅ Signal 2 (Liq Rev): ON
❌ Signal 3 (LS): OFF (complex alone)
❌ Signal 4 (LS Break): OFF
❌ Signal 5 (OB+LS NPR): OFF
❌ Signal 6 (OB+LS EMA): OFF
【LS BOUNCE SIGNAL】
✅ Exclude EMA50 from touch detection: OFF
❌ Only show when EMA fills are mixed: OFF
```
**What happens with this setup**:
- Only Bonus (black background) signals display
- LS Bounce Signals clearly visible
- Noisy signals filtered out
---
#### 💪 Intermediate Settings (Balanced)
**Goal**: Enable key filters for better accuracy
```
【FILTERS】
✅ Bonus Filter: ON
✅ Filter 6 (OB/BB/NPR Zone Filter): ON
✅ ICT Market Structure Filter: ON
❌ Direction Filter: OFF
❌ Liquidation Reversal Filter: OFF
❌ EMA Trend Filter: OFF
❌ OB/FVG Filter 1: OFF
❌ OB/FVG Filter 2: OFF
【SIGNALS】
✅ Signal 0 (Bonus): ON
✅ Signal 1 (VWC Change): ON
✅ Signal 2 (Liq Rev): ON
✅ Signal 3 (LS): ON
❌ Signal 4 (LS Break): OFF
❌ Signal 5 (OB+LS NPR): OFF
❌ Signal 6 (OB+LS EMA): OFF
【LS BOUNCE SIGNAL】
✅ Exclude EMA50 from touch detection: OFF
❌ Only show when EMA fills are mixed: OFF
```
**What happens with this setup**:
- Signals only after CHoCH (trend confirmed)
- Filter 6 changes bar colors
- Liquidity Sweeps also displayed
---
#### 🚀 Advanced Settings (Full Utilization)
**Goal**: Master all features
```
【FILTERS】
✅ Bonus Filter: ON
✅ Filter 6 (OB/BB/NPR Zone Filter): ON
✅ ICT Market Structure Filter: ON
✅ Direction Filter: ON
✅ EMA Trend Filter: ON
❌ Liquidation Reversal Filter: OFF (optional)
✅ OB/FVG Filter 1: ON
✅ OB/FVG Filter 2: ON
【SIGNALS】
✅ All ON
【LS BOUNCE SIGNAL】
✅ Exclude EMA50 from touch detection: ON (reduce EMA50 noise)
✅ Only show when EMA fills are mixed: ON (show only transition zones)
```
**What happens with this setup**:
- Fewer signals (precision-focused)
- Multiple confirmations greatly reduce false signals
- Only signals confirmed by trend, momentum, and zones
---
### 🎨 Display Customization
#### Change Label Size
```
【BUY/SELL SIGNAL APPEARANCE】
→ "BUY/SELL Label Size"
→ Choose from: tiny / small / normal / large / huge
Recommended: small (default)
```
#### Order Block Display Settings
```
【ORDER BLOCK (OB) SETTINGS】
✅ Show Current TF OB: Current timeframe OB
✅ Show 1min OB: 1-minute OB
✅ Show 5min OB: 5-minute OB
✅ Show 15min OB: 15-minute OB
Recommended: Only 15min OB ON (simple)
```
#### Liquidity Sweep Display
```
【LIQUIDITY SWEEPS SETTINGS】
→ "Sweep Length": Sensitivity (small=frequent, large=selective)
→ "Sweep Option": Standard / Maximum
Recommended: Length=40, Option=Standard
```
#### NPR/BB Bands Display
```
【NPR (NON-REPAINT STDEV) SETTINGS】
✅ Display 60min NPR Bands: 60-minute support/resistance
❌ Display Current TF NPR Bands: Current timeframe (optional)
Recommended: Only 60min ON
```
---
### ⚙️ Advanced Settings
#### Fine-tune Filter 6
```
【FINAL FILTERS】
→ "Enable Filter 6 (OB/BB/NPR Zone Filter)"
When ON:
- Bars color-coded red/green/white
- Behavior at OB, NPR/BB touches controlled
```
#### LS Bounce Signal Adjustments
```
【LS BOUNCE SIGNAL】
→ "Exclude EMA50 from touch detection"
OFF: Detect NPR/BB/EMA50 (all 3)
ON: Detect NPR/BB only (exclude EMA50)
→ "Only show when EMA fills are mixed"
OFF: Show all LS Bounce Signals
ON: Show only transition zone signals (yellow text)
```
#### MTF (Multi-Timeframe) Control
```
【ORDER BLOCK (OB) SETTINGS】
→ "Disable MTF on 1hr+ Charts"
ON: Disable MTF on 1H+ (save memory)
OFF: MTF enabled on all timeframes
Recommended: ON (unnecessary on larger timeframes)
```
---
### 🎯 Purpose-Based Configuration Guide
#### 🔍 Goal 1: Reduce Signal Count
```
✅ Bonus Filter: ON
✅ ICT Market Structure Filter: ON
✅ Filter 6: ON
✅ All Signals OFF, only Signal 0 ON
```
#### 🔍 Goal 2: Get More Signals
```
❌ All Filters OFF
✅ All Signals ON
```
#### 🔍 Goal 3: Trend Following Only
```
✅ ICT Market Structure Filter: ON
✅ Direction Filter: ON
✅ EMA Trend Filter: ON
```
#### 🔍 Goal 4: Counter-Trend Trading
```
✅ LS Bounce Signal: ON
✅ Filter 6: ON
❌ ICT Market Structure Filter: OFF
```
#### 🔍 Goal 5: Day Trading (5-15min charts)
```
✅ Show 15min OB: ON
✅ Display 60min NPR Bands: ON
✅ LS Bounce Signal: ON
❌ Show 1min/5min OB: OFF
```
#### 🔍 Goal 6: Scalping (1-5min charts)
```
✅ Show 5min OB: ON
✅ Show 15min OB: ON
✅ Display 60min NPR Bands: ON
✅ All Signals: ON
```
---
### 💾 Saving and Loading Settings
#### Save Settings
```
1. Click "..." in top-right of Settings screen
2. Select "Save as default"
→ Same settings auto-applied next time
```
#### Reset Settings
```
1. Click "..." in top-right of Settings screen
2. Select "Reset settings"
→ Return to default settings
```
---
## Why Combine Multiple Features?
### 🎯 Problem: Single Indicator Limitations
Common trader problems:
```
❌ RSI alone → Trade against trend, lose
❌ Moving Average alone → Late entry timing
❌ Support/Resistance alone → Caught by false breakouts
```
**Markets are complex**. One angle isn't enough.
---
### 💡 Solution: Multi-Angle Integrated Approach
#### 1️⃣ Structure × Zone × Momentum
```
📐 Structure (ICT CHoCH)
→ "Which direction is likely?"
📦 Zone (OB/NPR/BB)
→ "Where will price react?"
💨 Momentum (EMA/VWC)
→ "Is there momentum now?"
```
**When all 3 align = Highest win-rate timing**
---
#### 2️⃣ Multi-Timeframe Analysis
```
Big picture: Confirm Daily direction
Medium-term: Check 1H Order Blocks
Short-term: Time entry on 5min
```
**Short-term entries aligned with higher timeframes = Better win rate**
---
#### 3️⃣ Understanding Liquidity
```
🎣 Institutional strategy:
1. Intentionally move price opposite to stop out retail
2. Then, move in real direction
💡 Liquidity Sweep = Visualize this "trap"
→ Read institutional order flow
```
---
### 🧠 Integration Examples
#### Case 1: RSI Alone vs Integrated System
**Scenario**: RSI at 30 (oversold)
```
❌ RSI-only decision:
→ "Buy!"
→ But downtrend continues, loss 😢
✅ Trend Gazer:
CHoCH check → Still downtrend ❌
Order Block → In Bearish OB ❌
LS Bounce → SHORT signal only ❌
→ Skip or SHORT
→ Avoid loss ✅
```
**Result**: Multiple filters block wrong entry
---
#### Case 2: LS Bounce Signal 2-Stage Logic
**Scenario**: Price touches 60min NPR lower band
```
🔍 Traditional method:
Touched → Buy!
→ But price continues down 😢
✅ Trend Gazer:
Stage 1: NPR touch + red bar → Flag ON
Stage 2: EMA20 crosses above EMA50 → Confirm bounce
→ Now "Long@ HL only" displays
→ Entry → Success ✅
```
**Result**: Not just "touch" but "touch + bounce confirmation" improves accuracy
---
### 🎓 Progressive Learning Design
This indicator is designed for **beginners to advanced**:
```
📖 Beginner (Month 1):
Use only CHoCH + LS Bounce Signal
→ Learn trend and entry points
📖 Intermediate (Months 2-3):
Add Order Block + Bar Color
→ Learn support/resistance and filtering
📖 Advanced (Month 6+):
Master all features
→ Read institutional order flow
```
**Ultimate goal**: Indicator becomes confirmation tool. Your market sense becomes primary.
---
### 🔬 Technical Advantages
#### 1. Non-Repaint STDEV (NPR)
```
Normal Bollinger Bands:
→ Past data changes (repaints)
→ Inaccurate backtesting
NPR:
→ Past data doesn't change (non-repaint)
→ Reliable verification possible
```
#### 2. 2-Stage Signal Logic
```
Traditional: Condition met → Immediate signal
→ Many false signals
Trend Gazer: Condition1 → Flag ON → Condition2 → Signal
→ Confirmation step improves accuracy
```
#### 3. Alternating Filter
```
Problem: Same-direction signals spam
→ Overtrading
Solution: LONG → SHORT → LONG alternating only
→ Prevent unnecessary entries
```
---
### 💎 Conclusion: Why Integration?
```
Single indicator = "Partial truth"
Integrated system = "3D market perspective"
```
**Markets are multifaceted**. One angle isn't enough.
Trend Gazer **integrates multiple screens pros watch simultaneously into ONE**,
allowing beginners to read charts with institutional perspective.
---
## FAQ
### ❓ Q1: Which timeframe is best?
**A**: Depends on trading style
```
Scalping: 1min ~ 5min
Day Trading: 5min ~ 15min
Swing: 1H ~ 4H
```
**Important**: LS Bounce Signal only works on 30min and below.
---
### ❓ Q2: Too many signals, confused
**A**: Enable filters
```
【Recommended Settings】
✅ Bonus Filter: ON
✅ Filter 6: ON
✅ ICT Market Structure Filter: ON
→ Show only Signal 0
```
This significantly reduces signal count.
---
### ❓ Q3: No CHoCH appearing, what to do?
**A**: Wait or check higher timeframe
```
Method 1: Wait for CHoCH (recommended)
Method 2: Check higher timeframe (e.g., Daily) for trend
Method 3: Disable ICT Filter (not recommended)
```
**When trend is unclear, sitting out is also strategy**.
---
### ❓ Q4: LS Bounce Signal not appearing
**A**: Checkpoints
```
1. Are you on 30min or below chart?
→ Doesn't show on 1H+
2. Are NPR/BB bands displayed?
→ Check Settings "Display 60min NPR Bands"
3. Is EMA50 excluded?
→ If "Exclude EMA50" is ON, EMA50 signals won't show
```
---
### ❓ Q5: Bar color not changing?
**A**: Check Filter 6
```
Settings → FINAL FILTERS
→ Confirm "Enable Filter 6 (OB/BB/NPR Zone Filter)" is ON
If ON but still not changing:
→ Current price may be outside OB/NPR/BB zones
```
---
### ❓ Q6: Too many Order Blocks, hard to see
**A**: Narrow down displayed OBs
```
Settings → ORDER BLOCK (OB) SETTINGS
Recommended:
❌ Show Current TF OB: OFF
❌ Show 1min OB: OFF
❌ Show 5min OB: OFF
✅ Show 15min OB: ON (only this)
```
---
### ❓ Q7: How to improve win rate?
**A**: Thorough multiple confirmations
```
Checklist:
✅ CHoCH appeared
✅ LS Bounce Signal (white text)
✅ Bar color matches (red bar=LONG, green bar=SHORT)
✅ Signal within Order Block
✅ Aligns with higher timeframe trend
Enter ONLY when all align
```
---
### ❓ Q8: Want to practice on demo
**A**: Recommended practice method
```
Week 1: Observation only
→ Watch signals and chart movement
→ Resist entering
Weeks 2-3: Keep records
→ Screenshot when signal appears
→ Record subsequent movement
Week 4+: Start demo trading
→ Start with small amounts
→ Continue keeping records
```
---
### ❓ Q9: Are there alert features?
**A**: Yes, multiple alerts available
```
Setup method:
1. Right-click indicator on chart
2. Select "Add Alert..."
3. Choose from:
- ANY ALERT: BUY/SELL Signals
- BUY ONLY ALERT
- SELL ONLY ALERT
- MS UP / MS DOWN
- BAR COLOR: RED / LIME
- LS BOUNCE: LONG / SHORT Signal
```
---
### ❓ Q10: Works on other markets?
**A**: Yes, works on all markets
```
✅ Cryptocurrency (BTC, ETH, etc.)
✅ Forex (EUR/USD, USD/JPY, etc.)
✅ Stocks (individual stocks, indices)
✅ Futures (oil, gold, etc.)
```
Works on any market with price and volume data.
---
## 📋 Disclaimer
### ⚠️ Important Notice
This indicator is for **educational and informational purposes only**.
```
❌ NOT investment advice
❌ Does NOT guarantee profits
❌ Past results do NOT guarantee future performance
```
### Risk Warning
```
⚠️ Trading involves substantial risk
⚠️ Only trade with funds you can afford to lose
⚠️ Practice extensively on demo account before live trading
⚠️ Make your own informed decisions and act at your own risk
```
---
## 📞 Support
### Feedback & Questions
Feel free to ask questions in TradingView comments section.
### Bug Reports
Please report with specific details (timeframe, symbol, screenshots).
---
**Author**: rasukaru666
**License**: Mozilla Public License 2.0
**Last Updated**: December 2025
**Version**: Latest
---
**Thank you for using Trend Gazer!**
**Happy Trading! 📈**
---------------

Adaptive SuperTrend - Multi-Method# 📊 Adaptive SuperTrend - Multi-Method with Advanced Analytics
## 🎯 Overview
The **Adaptive SuperTrend - Multi-Method** is a sophisticated trading indicator that enhances the traditional SuperTrend by dynamically adjusting its parameters based on market conditions. Unlike static SuperTrend indicators, this version adapts to volatility changes, providing more reliable signals across different market regimes.
## ✨ Key Features
### 🤖 7 Adaptive Methods
Choose from multiple adaptation strategies or use the powerful Hybrid mode that combines all methods:
1. **Percentile-Based Adaptation**
- Adjusts multiplier based on ATR percentile ranking
- Tightens during extreme volatility, widens during calm periods
- Lookback: 100 bars (customizable)
2. **Volatility Regime Classification**
- Categorizes market into Low/Normal/High volatility regimes
- Applies different multipliers for each regime
- Default: Low=4.0x, Normal=2.5x, High=1.5x
3. **Z-Score Normalization**
- Uses statistical Z-score to normalize ATR
- Adapts to volatility outliers intelligently
- Sensitivity: 0.3 (adjustable)
4. **Dynamic Period Adjustment**
- Blends short and long ATR periods based on volatility
- Responsive in volatile markets, stable in calm markets
- Period range: 7-20 bars
5. **Rate of Change Method**
- Adjusts based on ATR's rate of change
- Detects accelerating/decelerating volatility
- Lookback: 20 bars
6. **Multi-Timeframe Comparison**
- Compares current timeframe ATR with higher timeframe
- Provides macro-context awareness
- Default HTF: Daily
7. **Hybrid Approach** ⭐ RECOMMENDED
- Combines all 6 methods with equal weighting
- Smoothed with EMA for stability
- Best overall performance
### 📈 Professional Statistics Panel
A comprehensive performance tracking panel with ML Fusion-inspired color scheme:
**Features:**
- 💼 **Current Position**: Live LONG/SHORT status with entry price
- 📊 **Total Points**: Cumulative P&L for selected period (default: 60 days)
- 💰 **Current P&L**: Unrealized profit/loss with percentage
- 🟢 **Long Stats**: Separate tracking for long trades
- 🔴 **Short Stats**: Separate tracking for short trades
- 📈 **Averages**: Average points per trade (overall, long, short)
- 📅 **Date Range**: Start and end dates of tracking period
**Customizable Options:**
- Lookback period: 1-365 days (default: 60 days)
- Table position: Top Left/Right, Bottom Left/Right
- Toggle date range display on/off
### 🎨 Visual Features
- **Color-Coded Signals**: Clear buy (green) and sell (red) markers
- **Trend Background**: Subtle background coloring for trend direction
- **SuperTrend Line**: Dynamic color based on current trend
- **Price Fill**: Shaded area between price and SuperTrend
- **Vibrant Colors**: Professional Material Design color palette
### 📊 Information Panel
Real-time display of:
- Active adaptation method
- Current ATR value
- ATR percentile ranking
- Active multiplier vs base multiplier
- Volatility regime (Low/Normal/High)
- ATR Z-Score
- Current trend direction
## 🔧 How to Use
### Quick Start
1. Add indicator to your chart
2. Choose adaptation method (start with "Hybrid")
3. Monitor the statistics panel for performance
4. Use signals for entry/exit points
### Recommended Settings
**For Intraday Trading:**
- Method: Hybrid or Dynamic Period
- Base ATR Period: 10
- Base Multiplier: 2.5-3.0
- P&L Tracking: 30 days
**For Swing Trading:**
- Method: Hybrid or Multi-Timeframe
- Base ATR Period: 14
- Base Multiplier: 3.0-4.0
- P&L Tracking: 90 days
**For Scalping:**
- Method: Rate of Change or Z-Score
- Base ATR Period: 7
- Base Multiplier: 2.0-2.5
- P&L Tracking: 7-14 days
### Signal Interpretation
✅ **BUY Signal**: Triangle up below bar
- Enter long position
- Place stop loss below SuperTrend line
❌ **SELL Signal**: Triangle down above bar
- Exit long / Enter short position
- Place stop loss above SuperTrend line
## ⚙️ Input Parameters
### Basic Settings
- **Base ATR Period**: Default 10 (1-50)
- **Base Multiplier**: Default 3.0 (0.1-10.0)
### Method-Specific Settings
Each of the 7 methods has its own customizable parameters for fine-tuning.
### Display Settings
- **Show Volatility Regime**: Toggle regime display
- **Show ATR Info Panel**: Toggle information panel
- **Show Statistics Panel**: Toggle performance stats
- **Stats Table Position**: Choose corner placement
- **P&L Tracking Period**: 1-365 days (default: 60)
- **Show P&L Date Range**: Toggle date range display
- **Bullish Color**: Customize trend-up color
- **Bearish Color**: Customize trend-down color
## 📊 Statistics Tracking
The indicator automatically tracks:
- **Entry Points**: Recorded on every trend change
- **Exit Points**: Calculated on opposite signal
- **Points Gained/Lost**: Per trade and cumulative
- **Long vs Short Performance**: Separate analytics
- **Trade Count**: Total, long, and short trades
- **Average Performance**: Overall and per direction
- **Time-Based Filtering**: Only shows trades within lookback period
## 🎯 Advantages Over Standard SuperTrend
1. **Adaptive to Market Conditions**: No more whipsaws in ranging markets or missed trends in volatile markets
2. **Multiple Adaptation Strategies**: Choose the method that fits your market and timeframe
3. **Comprehensive Analytics**: Track your performance with detailed statistics
4. **Professional Presentation**: Clean, organized display with Material Design colors
5. **Flexible Configuration**: Highly customizable for any trading style
6. **Real-Time Monitoring**: Live P&L tracking and performance metrics
## 🔔 Alerts
Built-in alert conditions for:
- Buy Signal (trend change to bullish)
- Sell Signal (trend change to bearish)
- Trend Change (any direction change)
Set up TradingView alerts to get notified on your phone or email when signals occur.
## 💡 Pro Tips
1. **Combine with Volume**: Use with volume indicators for confirmation
2. **Multiple Timeframes**: Add on multiple timeframes for confluence
3. **Risk Management**: Always use stop losses at SuperTrend line
4. **Backtest First**: Test on historical data before live trading
5. **Monitor Statistics**: Track your win rate and average gains
6. **Adjust for Market**: Switch methods based on market conditions
7. **Use Hybrid Mode**: When unsure, Hybrid mode provides balanced adaptation
## 📝 Version Notes
**Version 1.0**
- 7 adaptive methods with Hybrid mode
- Professional statistics panel with P&L tracking
- Configurable lookback period (1-365 days)
- Date range display
- Material Design color scheme
- Real-time performance analytics
- Multiple table position options
## ⚠️ Disclaimer
This indicator is for educational and informational purposes only. It should not be considered as financial advice. Always do your own research and consider consulting with a financial advisor before making trading decisions. Past performance does not guarantee future results.
---
**Happy Trading! 🚀📈**
---
## 🏷️ Tags
#SuperTrend #Adaptive #Volatility #TrendFollowing #ATR #Statistics #Analytics #PnL #Trading #Technical #Indicators #MultiMethod #Swing #Intraday #Scalping #RiskManagement

Key Liquidity Advanced Multi-Timeframe Suite═══════════════════════════════════════
KEY LIQUIDITY ADVANCED MULTI-TIMEFRAME SUITE
═══════════════════════════════════════
A professional-grade indicator focused on identifying institutional liquidity levels across multiple timeframes, combined with order flow analysis and market structure tools.
───────────────────────────────────────
WHAT THIS INDICATOR DOES
───────────────────────────────────────
This tool specializes in multi-timeframe liquidity analysis with the following components:
- Multi-Timeframe Liquidity Levels - Track swing highs/lows on HTF (Higher Timeframe), LTF (Lower Timeframe), and CTF (Current Timeframe)
- Order Blocks - Identify institutional accumulation and distribution zones
- Premium/Discount Zones - Show price distribution relative to swing ranges
- Market Structure Breaks - Highlight significant trend changes
- Trading Sessions - Display major market session boundaries (Optional)
───────────────────────────────────────
HOW IT WORKS
───────────────────────────────────────
MULTI-TIMEFRAME LIQUIDITY SYSTEM:
The indicator uses a three-tier liquidity detection system:
1. HTF (Higher Timeframe) Liquidity:
- Default: 4H timeframe (configurable to Daily, Weekly)
- Identifies major institutional levels
- Uses pivot detection with adjustable left/right bar parameters
- Color-coded: Green for highs, Red for lows
2. LTF (Lower Timeframe) Liquidity:
- Default: 1H timeframe (configurable)
- Provides precision entry/exit levels
- Color-coded: Blue for highs, Orange for lows
3. CTF (Current Timeframe) Liquidity:
- Optional feature for chart timeframe levels
- Color-coded: Purple for highs, Pink for lows
Calculation Method:
- Uses standard pivot high/low detection algorithm
- Configurable sensitivity via left bars (lookback) and right bars (confirmation)
- Levels automatically removed when price sweeps through them (mitigation)
- Optional display of mitigated levels with reduced opacity
ORDER BLOCKS:
Detection Logic:
- Bullish OB: Last bearish candle before significant bullish move
- Bearish OB: Last bullish candle before significant bearish move
- Uses swing length parameter to identify structural breaks
- Strength visualization showing buying vs selling pressure
Visual Elements:
- Split-colored boxes showing institutional sentiment
- Upper half: Bullish strength (teal)
- Lower half: Bearish strength (red)
- Labels positioned at center with institutional markers
Violation Detection:
- Configurable: Wick-based or Close-based
- Automatically removes broken order blocks
- Optional overlap hiding to keep chart clean
PREMIUM/DISCOUNT ZONES:
Zone Structure:
- Premium Zone: Upper 5% of swing range (institutional selling area)
- Equilibrium: Middle 5% representing fair value
- Discount Zone: Lower 5% of swing range (institutional buying area)
The zones dynamically update based on trailing swing extremes and adapt to current market structure.
MARKET STRUCTURE BREAKS (MSB):
Identifies when price breaks through significant swing points:
- Bearish MSB: Price closes below swing low
- Bullish MSB: Price closes above swing high
- Labels appear only on trend direction changes
- Horizontal lines extend from break point
TRADING SESSIONS (Optional):
Displays time-based session boxes for:
- Asian Session (Tokyo + Sydney combined)
- London Session
- New York Session
Features:
- Customizable session times and time zones
- Session high/low tracking
- Overlap detection showing when multiple sessions are active
- Fully configurable colors and display options
───────────────────────────────────────
HOW TO USE
───────────────────────────────────────
MASTER TOGGLE CONTROLS:
Use these to enable/disable major features:
- Key Liquidity Levels (Main feature)
- Premium/Discount Zones
- Order Blocks
- Market Structure Breaks
- Trading Sessions
MULTI-TIMEFRAME LIQUIDITY STRATEGY:
Conservative Approach:
1. Wait for HTF liquidity sweep (4H or Daily level)
2. Look for LTF confirmation (1H level hold)
3. Enter when order block forms at discount (bullish) or premium (bearish)
Aggressive Approach:
1. Trade LTF liquidity sweeps in direction of HTF trend
2. Use order blocks for entry refinement
3. Target next LTF or HTF liquidity level
Range Trading:
1. Identify premium and discount zones
2. Buy at discount, sell at premium
3. Use equilibrium as profit target or re-entry
ORDER BLOCK TRADING:
Entry Method:
1. Wait for order block formation (after structure break)
2. Enter on first return to order block zone
3. Place stop beyond the order block
Strength Analysis:
- Wider bullish section = stronger institutional buying
- Wider bearish section = more selling pressure
- Use this to gauge conviction
Violation:
- Order block broken = setup invalidated
- Look for next order block in continuation
MARKET STRUCTURE TRADING:
MSB signals potential trend change:
- Bearish MSB + Bearish OB = short opportunity
- Bullish MSB + Bullish OB = long opportunity
- Wait for retest of broken level for confirmation
───────────────────────────────────────
CONFIGURATION GUIDE
───────────────────────────────────────
KEY LIQUIDITY SETTINGS:
Pivot Detection:
- Left Bars (Default: 15): Lookback period for pivot identification
- Right Bars (Default: 5): Confirmation period
- Higher values = fewer, more significant levels
- Lower values = more frequent, sensitive levels
Timeframe Selection:
- HTF: Recommended 4H, 1D, or 1W for swing trading
- LTF: Recommended 1H or 4H for day trading
- CTF: Use for scalping on current chart timeframe
Display Options:
- Display Limit: Maximum number of levels shown per timeframe
- Extension: Short/Current/Max - how far lines extend
- Line Width: Visual prominence (1-5)
- Text Size: Label size adjustment
Mitigation:
- Remove: Delete levels when swept (cleaner chart)
- Show: Keep swept levels visible with reduced opacity
ORDER BLOCKS SETTINGS:
Core Parameters:
- Swing Length (Default: 8): Sensitivity for structure detection
- Show Last X (Default: 4): Number of active blocks displayed
- Violation Check: Choose Wick or Close-based invalidation
- Hide Overlap: Remove overlapping blocks for clarity
PREMIUM/DISCOUNT ZONES:
- Swing Detection Length (Default: 50): Range calculation period
- Longer period = broader zones, more stable
- Shorter period = tighter zones, more reactive
TRADING SESSIONS:
Time Configuration:
- Adjust session times for your timezone
- Use IANA timezone database format recommended
- Days to Show: Historical session display (0-10)
Visualization:
- Session boxes with colored backgrounds
- Optional high/low lines within each session
- Optional open/close lines
- Overlap highlighting when sessions coincide
───────────────────────────────────────
ALERT SYSTEM
───────────────────────────────────────
Available Alerts:
- HTF High Liquidity Hit
- HTF Low Liquidity Hit
Alert Configuration:
1. Enable HTF Liquidity Alerts in settings
2. Select specific alert types (High/Low)
3. Create TradingView alert with "Any alert() function call"
4. Alerts fire once per bar when liquidity is swept
Alert Message Format:
- Event type and description
- Timeframe information
- Current price
- Timestamp
───────────────────────────────────────
RECOMMENDED TIMEFRAME COMBINATIONS
───────────────────────────────────────
Swing Trading:
- Chart: 4H or 1D
- HTF Liquidity: 1D or 1W
- LTF Liquidity: 4H or 1D
Day Trading:
- Chart: 15m or 1H
- HTF Liquidity: 4H or 1D
- LTF Liquidity: 1H or 4H
Scalping:
- Chart: 5m or 15m
- HTF Liquidity: 1H or 4H
- LTF Liquidity: 15m or 1H
- Enable CTF Liquidity
───────────────────────────────────────
PERFORMANCE NOTES
───────────────────────────────────────
This indicator is optimized for performance:
- Uses max_bars_back declarations to limit lookback
- Conditional execution based on toggle settings
- Efficient array management for drawing objects
- Recommended for intraday timeframes only
- Sessions feature requires intraday timeframes
───────────────────────────────────────
EDUCATIONAL DISCLAIMER
───────────────────────────────────────
This indicator identifies areas where institutional orders may be positioned based on historical price action. It uses standard technical analysis techniques:
- Pivot point detection for liquidity levels
- Swing analysis for market structure
- Volume-weighted order block strength
- Time-based session filtering
The indicator does not predict future price movements. Always combine with your own analysis, risk management, and trading plan.
───────────────────────────────────────
USAGE DISCLAIMER
───────────────────────────────────────
This tool is for educational and analytical purposes. Past performance does not guarantee future results. Trading involves substantial risk of loss. Always conduct your own due diligence and never risk more than you can afford to lose.
