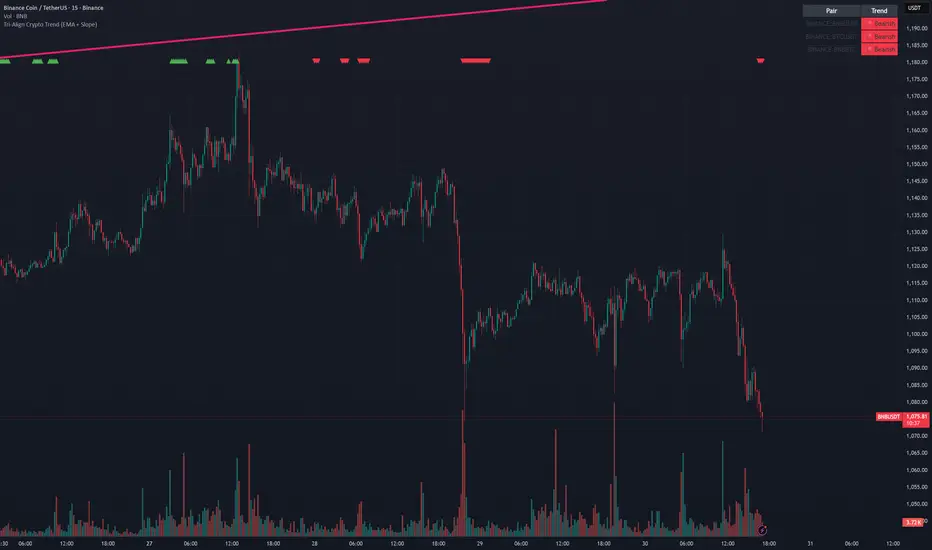
Tri-Align Crypto Trend (EMA + Slope)**Tri-Align Crypto Trend (EMA + Slope)**
Quickly see whether your coin is trending *with* Bitcoin. The indicator evaluates three pairs—**COIN/USDT**, **BTC/USDT**, and **COIN/BTC**—using a fast/slow EMA crossover plus the fast EMA’s slope. Each pair is tagged **Bullish / Bearish / Neutral** in a compact, color-coded table. Alerts fire when **all three** trends align (all bullish or all bearish).
**How to use**
1. Add the indicator to any crypto chart.
2. Set the three symbols (defaults: BNB/USDT, BTC/USDT, BNB/BTC) and optionally choose a signal timeframe.
3. Tune **Fast EMA**, **Slow EMA**, **Slope Lookback**, and **Min |Slope| %** to filter noise and require stronger momentum.
4. Create alerts: *Add alert →* choose the indicator and select **All Three Bullish**, **All Three Bearish**, or **All Three Aligned**.
**Logic**
* Bullish: `EMA_fast > EMA_slow` **and** fast EMA slope ≥ threshold
* Bearish: `EMA_fast < EMA_slow` **and** fast EMA slope ≤ −threshold
* Otherwise: Neutral
Tip: The **COIN/BTC** row reflects relative strength vs BTC—use it to avoid chasing coins that lag the benchmark. (For educational purposes; not financial advice.)
חפש סקריפטים עבור "trend"

Tri-Align Crypto Trend (EMA + Slope)**Tri-Align Crypto Trend (EMA + Slope)**
Quickly see whether your coin is trending *with* Bitcoin. The indicator evaluates three pairs—**COIN/USDT**, **BTC/USDT**, and **COIN/BTC**—using a fast/slow EMA crossover plus the fast EMA’s slope. Each pair is tagged **Bullish / Bearish / Neutral** in a compact, color-coded table. Alerts fire when **all three** trends align (all bullish or all bearish).
**How to use**
1. Add the indicator to any crypto chart.
2. Set the three symbols (defaults: BNB/USDT, BTC/USDT, BNB/BTC) and optionally choose a signal timeframe.
3. Tune **Fast EMA**, **Slow EMA**, **Slope Lookback**, and **Min |Slope| %** to filter noise and require stronger momentum.
4. Create alerts: *Add alert →* choose the indicator and select **All Three Bullish**, **All Three Bearish**, or **All Three Aligned**.
**Logic**
* Bullish: `EMA_fast > EMA_slow` **and** fast EMA slope ≥ threshold
* Bearish: `EMA_fast < EMA_slow` **and** fast EMA slope ≤ −threshold
* Otherwise: Neutral
Tip: The **COIN/BTC** row reflects relative strength vs BTC—use it to avoid chasing coins that lag the benchmark. (For educational purposes; not financial advice.)
EMA Trend ScreenerThe EMA Trend Screener is a multi-symbol dashboard that quickly shows the trend direction of up to 40 cryptocurrencies (or any selected assets) based on their relationship to a chosen Exponential Moving Average (EMA).
For each symbol, the script checks whether the current price is above or below the specified EMA (default 75).
• Green = Uptrend (price above EMA)
• Red = Downtrend (price below EMA)
All results are displayed in a compact on-chart table, updating in real time for your selected timeframe.
Main benefits:
• Instantly monitor trend direction across multiple coins or markets
• Fully customizable symbol list (up to 40 assets)
• Adjustable EMA length for different trading styles
• Works on any timeframe
• Lightweight and efficient visual summary
In short:
EMA Trend Screener gives traders a fast, clean overview of which markets are trending up or down — ideal for trend following, momentum filtering, or trade selection.
Сreated with vibecoding using ChatGPT and Claude.
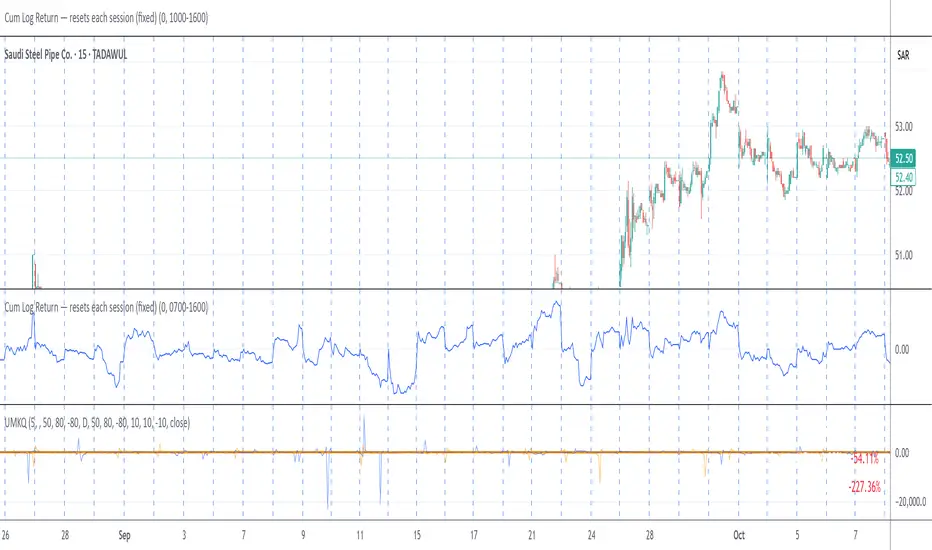
UMKQ – Trend finder this indicator is spoused to find trending stocks and spoused to be used in a scanner to find stock with persistence trend that is consistent and with minimal swing down . It give a score that range between 100 the perfect trend up to -100 the perfect trend down . It measure how persistence not the strength.
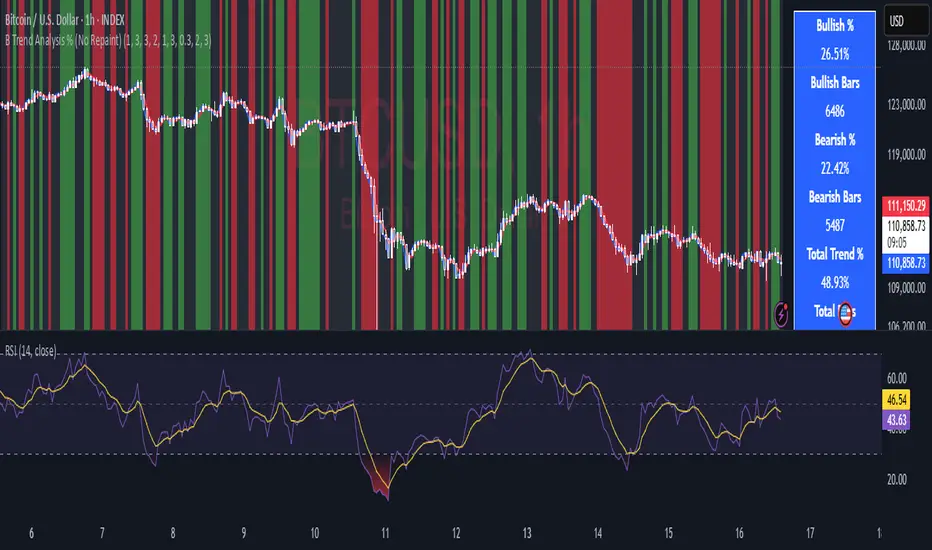
B Trend Analysis % (No Repaint)
Overview
B Trend Analysis % is a no-repaint indicator that identifies bullish, bearish, or mean-reverting market phases using confirmed (prior-bar) signals from SMA crossovers, ADX trend strength, Supertrend direction, and optional RSI filtering. It visualizes trends via background colors (green for bullish, red for bearish, gray for mean-reversion) and provides a stats table showing bullish/bearish percentages over the chart's history.
How It Works
-
SMA Crossover: Detects momentum shifts with short (default 1) vs. long (default 3) SMAs.
ADX Filter: Ensures strong trends (smoothed ADX > threshold, default 1).
Supertrend: Confirms direction using ATR-based bands (period 3, factor 0.3).
RSI (Optional): Filters extremes (oversold >30 for bull, overbought <70 for bear; period 2).
Trends require trendLookback (default 3) consecutive confirmed bars for reliability. Stats count only confirmed bars to avoid repainting.
Usage
- Apply to any timeframe/symbol for trend confirmation.
- Green background: Enter/hold longs; red: shorts; gray: Avoid trades (range-bound).
- Tune inputs: Shorten lengths for scalping; enable RSI for mean-reversion filters.
- Plots: Blue (short SMA), red (long SMA). Table shows % bullish/bearish and ADX strength.
- Best for volatile assets like crypto/forex; back test on clean price charts.
Key Features
- No repainting: Uses var state and prior-bar values ( ).
- Efficient: Lightweight calcs, no request .security() .
- Customizable: Advanced group for lookback (1-5 bars).
Protected Script Notice
This script is published as Protected to safeguard proprietary elements in the trend confirmation logic, including the custom consecutive-bar counter and smoothed ADX integration, which were developed through extensive back testing. While the core inputs and outputs are fully accessible for use, the exact implementation details are not viewable to prevent unauthorized replication. Users can still apply it to charts, customize visible parameters, and benefit from its no-repaint reliability. For collaboration or access requests, contact the author via Trading View messaging.
This is an original combination for clearer trend stats—fork and improve where possible!
Multi-Timeframe Trend Table - Fully Customizable EMA Analysis📊 Complete Control Over Your Multi-Timeframe Analysis
This advanced indicator displays real-time trend direction for ANY two timeframes of your choice in a clean, professional table format. Perfect for traders who want complete flexibility in monitoring higher timeframe trends while executing trades on lower timeframes.
🎯 Key Features
Fully Customizable Timeframes: Choose ANY two timeframes from dropdown menus (1m to 1M)
Adjustable EMA Periods: Customize both short and long EMA lengths to match your strategy
Smart Timeframe Display: Automatic formatting (60→1H, 240→4H) or show custom labels
EMA-Based Logic: Uses proven EMA crossover methodology for trend determination
Visual Clarity: Color-coded table with green (uptrend) and red (downtrend) indicators
Optional EMA Values: Toggle to display actual EMA values in the table
Flexible Positioning: Place table in any corner of your chart
Built-in Alerts: Get notified when trends align or diverge
Real-Time Updates: Automatically refreshes with each bar close
Pine Script v6: Latest version with enhanced performance
📈 How It Works
The indicator determines trend direction using a simple but effective rule:
UPTREND: Price is above both Short EMA AND Long EMA
DOWNTREND: Price is below either Short EMA OR Long EMA
🔧 Comprehensive Settings
Timeframe Settings:
First Timeframe: Select any timeframe (default: 1H)
Second Timeframe: Select any timeframe (default: 4H)
EMA Settings:
Short EMA Length: Customizable (default: 50)
Long EMA Length: Customizable (default: 100)
Display Options:
Show EMA Values: Display actual EMA numbers in table
Table Position: 4 corner positions available
Custom Timeframe Labels: Toggle between formatted (1H) or raw (60) labels
Plot Current EMAs: Optional EMA lines on your current chart
💡 Trading Applications
✅ Complete Flexibility: Monitor any timeframe combination (5m/15m, 1H/1D, etc.)
✅ Strategy Alignment: Adapt EMA periods to match your trading system
✅ Trend Confirmation: Ensure trades align with higher timeframe direction
✅ Risk Management: Avoid counter-trend trades in strong directional markets
✅ Entry Timing: Use lower timeframe for entries while respecting higher timeframe bias
✅ Scalping Enhancement: Perfect for any scalping timeframe with higher timeframe context
✅ Swing Trading: Monitor daily/weekly trends while trading on hourly charts
🚨 Smart Alerts
Both Timeframes Bullish: Get notified when both timeframes turn bullish
Both Timeframes Bearish: Alert when both timeframes turn bearish
Timeframes Diverging: Know when your timeframes disagree on direction
🎨 Professional Design
Clean, modern table layout
Intuitive color coding (Green = Up, Red = Down)
Compact size that doesn't obstruct chart analysis
Clear typography for instant trend recognition
Customizable positioning for optimal workflow
📋 Perfect For
Day traders and scalpers of all timeframes
Swing traders seeking trend confirmation
Multi-timeframe analysis enthusiasts
Traders using custom EMA strategies
Anyone wanting flexible trend monitoring
Algorithmic traders needing trend filters
🚀 Easy Setup
Add to any chart (works on all timeframes)
Select your preferred timeframes from dropdowns
Adjust EMA periods to match your strategy
Customize display options and table position
Set up alerts for trend changes
Start trading with complete timeframe awareness
No complex configurations needed - just customize and trade!
🔄 Use Cases
Scalpers: Monitor 15m/1H while trading on 1m/3m
Day Traders: Watch 1H/4H while trading on 5m/15m
Swing Traders: Track 4H/1D while trading on 1H
Position Traders: Monitor 1D/1W while trading on 4H
Custom Strategies: Any timeframe combination you prefer
This indicator is designed for educational and informational purposes. Always combine with proper risk management and your own analysis.
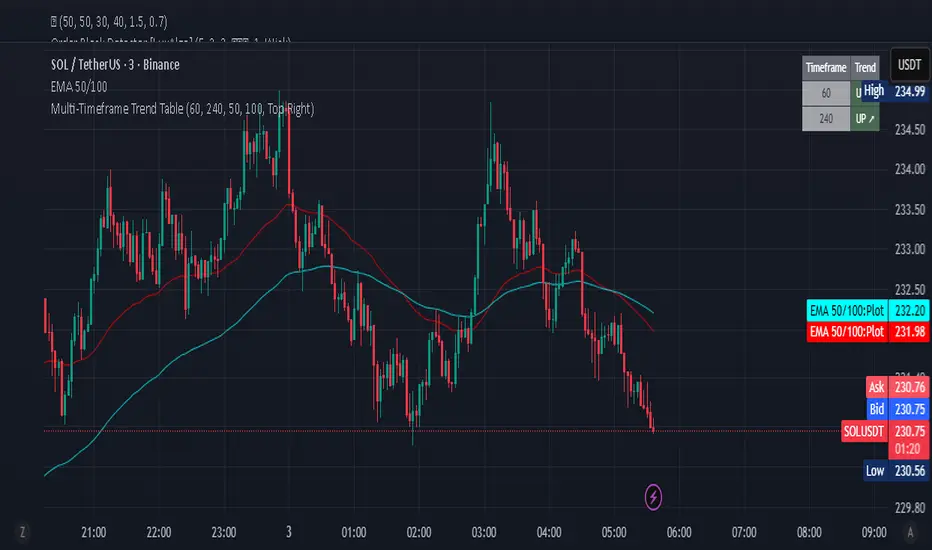
Multi-Timeframe Trend Table - EMA Based Trend Analysis📊 Stay Aligned with Higher Timeframe Trends While Scalping
This powerful indicator displays real-time trend direction for 1-hour and 4-hour timeframes in a clean, easy-to-read table format. Perfect for traders who want to align their short-term trades with higher timeframe momentum.
🎯 Key Features
Multi-Timeframe Analysis: Monitor 1H and 4H trends while trading on any timeframe (3min, 5min, 15min, etc.)
EMA-Based Logic: Uses proven EMA 50 and EMA 100 crossover methodology
Visual Clarity: Color-coded table with green (uptrend) and red (downtrend) indicators
Customizable Display: Toggle EMA values and adjust table position
Real-Time Updates: Automatically refreshes with each bar close
Lightweight: Minimal resource usage with efficient data requests
📈 How It Works
The indicator determines trend direction using a simple but effective rule:
UPTREND: Price is above both EMA 50 AND EMA 100
DOWNTREND: Price is below either EMA 50 OR EMA 100
🔧 Settings
Show EMA Values: Display actual EMA 50/100 values in the table
Table Position: Choose from 4 corner positions (Top Right, Top Left, Bottom Right, Bottom Left)
Plot Current EMAs: Optional display of EMA lines on your current chart
💡 Trading Applications
✅ Trend Confirmation: Ensure your trades align with higher timeframe direction
✅ Risk Management: Avoid counter-trend trades in strong directional markets
✅ Entry Timing: Use lower timeframe for entries while respecting higher timeframe bias
✅ Scalping Enhancement: Perfect for 1-5 minute scalping with higher timeframe context
🎨 Visual Design
Clean, professional table design
Intuitive color coding (Green = Up, Red = Down)
Compact size that doesn't obstruct your chart
Clear typography for quick reading
📋 Perfect For
Day traders and scalpers
Swing traders seeking trend confirmation
Multi-timeframe analysis enthusiasts
Traders who want simple, effective trend identification
🚀 Easy Setup
Add to any chart (works on all timeframes)
Customize table position and settings
Start trading with higher timeframe awareness
Watch the table update automatically
No complex configurations needed - just add and trade!
This indicator is designed for educational and informational purposes. Always combine with proper risk management and your own analysis.

Renko Trend Indicator with High/LowRenko Trend Indicator with High/Low
Version: 1.0
Pine Script Version: 5
Type: Indicator
Overlay: Yes
Description
The Renko Trend Indicator with High/Low provides a visual representation of market trends using Renko-style calculations based on either a fixed brick size or ATR (Average True Range). It helps traders identify trend direction, potential reversals, and key support/resistance levels.
The indicator plots Renko-based trend signals directly on your chart and provides a colored Renko close line, making trend analysis simpler and clearer.
Features
Customizable Renko Brick Size
Fixed brick size or dynamic ATR-based bricks.
Step input for precise control over brick size.
Trend Identification
Detects uptrend and downtrend based on Renko logic.
Plots visual signals for trend direction:
Green triangle below bars → Uptrend
Red triangle above bars → Downtrend
Renko Close Line
Shows the Renko-adjusted closing price as a line.
Line color changes with trend (green for uptrend, red for downtrend).
Inputs
Name Type Default Description
Brick Size float 50 Size of Renko bricks (price units)
Use ATR for Brick Size? bool false Enable ATR-based dynamic brick sizing
ATR Period int 14 Number of periods for ATR calculation if enabled
How It Works
The indicator calculates Renko bricks using either a fixed size or ATR.
It maintains internal variables:
renko_close → Current Renko price
renko_high → Highest point of the current trend
renko_low → Lowest point of the current trend
trend → Current trend direction (1 for uptrend, -1 for downtrend)
last_extreme → Last extreme point to detect trend reversal
When price moves above or below the Renko threshold, the trend is updated.
Trend signals are plotted on the chart for easy visualization.
Plots
Plot Name Description Color
Up Trend Triangle below bar when trend is up Green
Down Trend Triangle above bar when trend is down Red
Renko Close Line connecting Renko-adjusted close prices Green (up) / Red (down)
Usage
Add the indicator to any chart with your preferred timeframe.
Configure the brick size or enable ATR-based bricks for dynamic calculation.
Observe the trend triangles and Renko line to identify trend direction and potential reversals.
Can be used in combination with other indicators or strategies for trading decisions.
Notes
This indicator is for analysis purposes only and does not place trades automatically.
ATR-based bricks adapt to market volatility, while fixed bricks provide a static reference.
Works best on liquid markets with regular price movements.
Example Chart
Green triangles below bars signal a buying trend.
Red triangles above bars signal a selling trend.
The colored Renko line shows the trend progression visually.
Author
DB
Pine Script Version: 5
License: MIT

Range Trends Enhanced (eleven11)This indicator automatically draws your Range Trend lines based upon your timeframe. When you select a timeframe, in the options, those lines will be locked in, whenever you switch timeframes on the chart. This allows you to "lock in" a timeframe's trendlines and then view it on different timeframes. But if you want to view the current trendlines for a timeframe then you need to select that "lockdown" timeframe in the settings. The original code was created by eleven11

Gemini Trend Following SystemStrategy Description: The Gemini Trend Following System
Core Philosophy
This is a long-term trend-following system designed for a position trader or a patient swing trader, not a day trader. The fundamental goal is to capture the majority of a stock's major, multi-month or even multi-year uptrend.
The core principle is: "Buy weakness in a confirmed uptrend, and sell only when the uptrend's structure is fundamentally broken."
It operates on the belief that it's more profitable to ride a durable trend than to chase short-term breakouts or worry about daily price fluctuations. It prioritizes staying in a winning trade over frequent trading.
The Three Pillars of the Strategy
The script's logic is built on three distinct pillars, processed in order:
1. The Regime Filter: "Is This Stock in a Healthy Uptrend?"
Before even considering a trade, the script acts as a strict gatekeeper. It will only "watch" a stock if it meets all the criteria of a healthy, long-term uptrend. This is the most important part of the strategy as it filters out weak or speculative stocks.
A stock passes this filter if:
The 50-day Simple Moving Average (SMA) is above the 200-day SMA. This is the classic definition of a "Golden Cross" state, indicating the medium-term trend is stronger than the long-term trend—a hallmark of a bull market for the stock.
The stock's performance over the last year is positive. The Rate of Change (ROC) must be above a minimum threshold (e.g., 15%). This ensures we are only looking at stocks that have already demonstrated significant strength.
The 200-day SMA itself is rising. This is a crucial check to ensure the very foundation of the trend is solid and not flattening out or beginning to decline.
If a stock doesn't meet these conditions, the script ignores it completely.
2. The Entry Trigger: "When to Buy the Dip"
Once a stock is confirmed to be in a healthy uptrend, the script does not buy immediately. Instead, it patiently waits for a point of lower risk and higher potential reward—a pullback.
The entry trigger is a specific, two-step sequence:
The stock price first dips and closes below its 50-day SMA. This signifies a period of temporary weakness or profit-taking.
The price then recovers and closes back above the 50-day SMA within a short period (10 bars).
This sequence is a powerful signal. It suggests that institutional buyers view the 50-day SMA as a key support level and have stepped in to defend it, overpowering the sellers. The entry occurs at this point of confirmed support, marking the likely resumption of the uptrend. On the chart, this event is highlighted with a teal background.
3. The Exit Strategy: "When is the Trend Over?"
The exit logic is designed to keep you in the trade as long as possible and only sell when the trend's character has fundamentally changed. It uses a dual-exit system:
Primary Exit (Trend Failure): The main reason to sell is a "Death Cross"—when the 50-day SMA crosses below the 200-day SMA. This is a robust, albeit lagging, signal that the long-term uptrend is over and a bearish market structure is taking hold. This exit condition is designed to ignore normal market corrections and only trigger when the underlying trend has truly broken. On the chart, this is highlighted with a maroon background.
Safety-Net Exit (Catastrophic Stop-Loss): To protect against a sudden market crash or a company-specific disaster, a "safety-net" stop-loss is placed at the time of entry. This stop is set far below the entry price, typically underneath the 200-day SMA. It is a "just-in-case" measure that should only be triggered in a severe and rapid decline, protecting your capital from an unexpected black swan event.
Who is This Strategy For?
Position Traders: Investors who are comfortable holding a stock for many months to over a year.
Patient Swing Traders: Traders who want to capture large price swings over weeks and months, not days.
Investors using a Rules-Based Approach: Anyone looking to apply a disciplined, non-emotional system to their long-term portfolio.
Ideal Market Conditions
This strategy excels in markets with clear, durable trends. It performs best on strong, leading stocks during a sustained bull market. It will underperform significantly or generate losses in choppy, sideways, or range-bound markets, where the moving averages will frequently cross back and forth, leading to "whipsaw" trades.

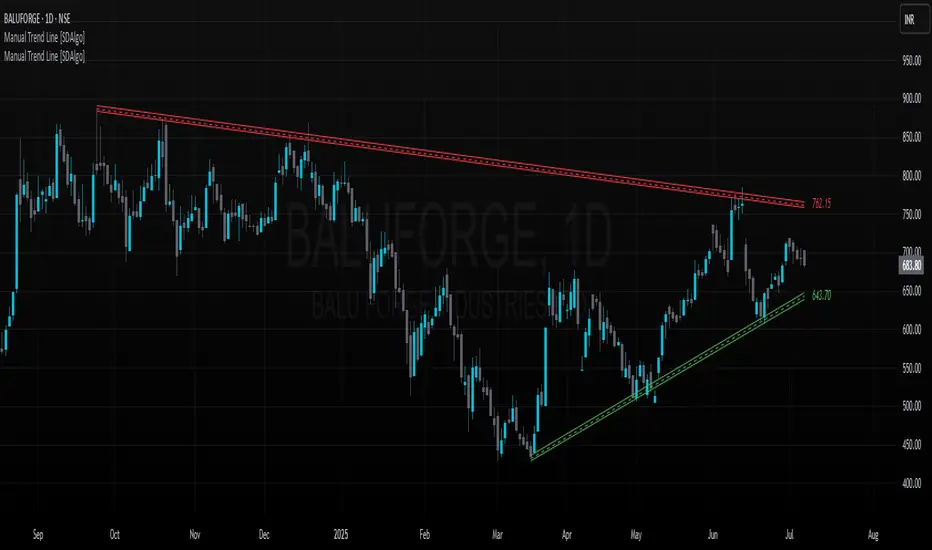
Manual Trend Line [SDAlgo]There is a a saying "Necessity is the Father of Invention."
Truly speaking, this indicator also took birth from the same necessity when using TradingView's built-in drawing tool was unable to do what I was looking for. It's "Trend Line". What this built-in drawing tool lacks:
1. It cannot be extended to the current bar.
2. It doesn't provide the the ability to get the price value of the Trend Line at the current bar when extended.
3. It can only be a line but not a channel kind of thing.
So, this manual Trend Line overcome all those mentioned above but being simple without much intricacies or complex calculations.
How does this indicator works:
The following screenshot appears when user first select this Indicator to apply on your chart, it asks user to choose the start time point of of the Trend Line (instead of Point in drawing tool). The default setting is Resistance Trend Line, so user may opt for the time point where the user finds a suitable high. However, as there is multiple confirmation in different stages, user may also opt for time point where the user intend to place the support line start.:
photos.google.com
Once user choose the start time point, it will ask the end time point as per the below screenshot:
photos.google.com
Once the second point is also chosen, then the following screen appears for user to confirm other parameters:
photos.google.com
User can choose:
1. Trend Line Type: Resistance or Support
2. Trend Line Touch Points: Either High/Low of the candle (when resistance, it will touch the highs, when support, it will touch the lows for the selected time point candles.) or candle body (in this case, the trendline will touch the high of the candle body when Resistance is selected else it will touch the low of the candle body when Support is selected.)
3. Trend Line Visibility: Single Line or Multiple Line. The default screenshot with this publication shows the multiple line where the center dashed line is the touch points and outer solid lines are indicating a narrow zone. This zone is to cover some other high (or low points) which didn't exactly touch the dashed line but the rejection came to very near to it.
Once you click apply, say with other default setting except the time point, the trendline will be visible like the below screenshot:
photos.google.com
By default the Trend Line is extended left but it stops at the current running or the last historical bar with a small value mentioned at the right of the Trend Line as the price value of it at the current bar.
Also by default the resistance selection colors the line as Red and Green when selected support.
User can go into the settings and fiddle with it for other settings. If the line visibility is changed to Multiple Line, the Trend Line in the just previous picture will become multiple line as is below:
photos.google.com
Other parameter are:
1. Line Thickness: For single line type, the thickness can be made from 1 to 10.
2. The label size can be made from 8 to 16 for the Price Value of the Trend Line at current bar.
Draggability:
Unlike Built-in Trendline, this doesn't have the efficiency of dragging the start or endpoints but it has the another ability to drag the start and end time of the Trend Line. In that case, you just select the Trend Line and two vertical lines will appear on your chart on the start and end point of the Trend Line. User can drag the vertical time points to whichever bar user want to place to.
In this way, the semiautomatic "Manual Trend Line" can be drawn on the chart but with some additional features as mentioned earlier.
This Indicator is free for all but I'm hiding the source code for some unforeseen reasons. If Both the Upper Trend Line and Lower Trend Lines are required on a single chart, then the indicator should be added two times on the chart, that's it.
If user faces any issues during placement of the Indicator on the chart, I may be contacted over TradingView direct message and can help the user for any clarifications, overcoming any issues.
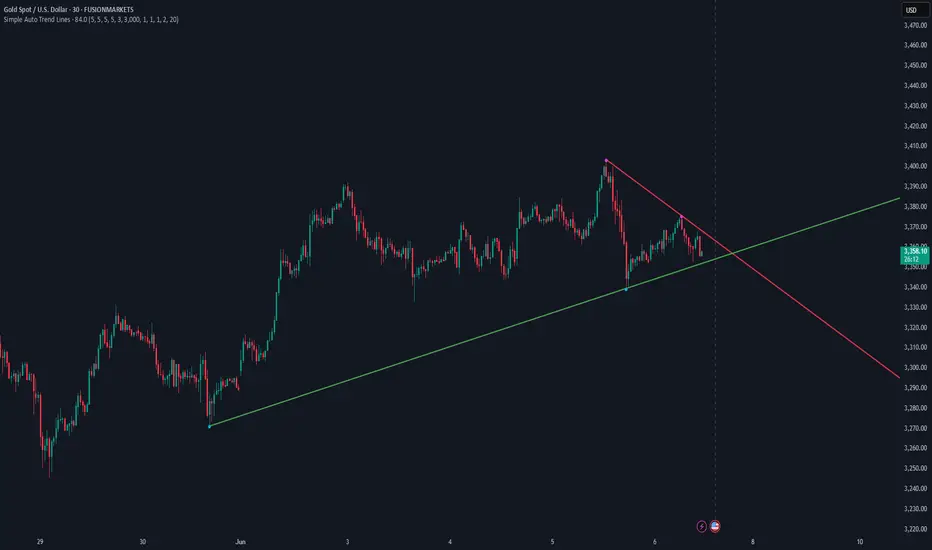
Simple Auto Trend LinesOpinionated way of drawing automatic trend lines. It draws automatically trend lines based on specified top/bottom strengths with multiple sets in order to keep track of multiple levels of interest.
Has the ability to hide invalidated trendlines if price moves away from it.
Donchian Channel Trend Tracker by KellyLikesCrypto### Overview
This indicator is written in Pine Script® (version 6) and is designed to overlay on a price chart. It combines the classic Donchian Channel—a tool popular among trend-following traders—with additional trend-tracking features. By identifying when the channel’s highs and lows are making new extreme values, the indicator helps signal potential trend shifts. It is especially suited for scalpers using 1-hour charts, as it provides clear, actionable signals for rapid entry and exit decisions.
---
### Key Components & Inputs
1. **User Inputs:**
- **Length:** The period over which the indicator calculates the highest high and the lowest low (default is 27 bars). This value can be adjusted to smooth or tighten the channel based on the trader’s preference.
- **Offset:** A parameter allowing the plotted lines to be shifted left or right on the chart, providing flexibility in aligning the indicator with price action.
2. **Donchian Channel Calculations:**
- **Lower Bound (`lower`):** Calculated using `ta.lowest(length)`, it identifies the lowest low over the defined period.
- **Upper Bound (`upper`):** Determined by `ta.highest(length)`, capturing the highest high during the same period.
- **Basis:** The midline of the channel, computed as the average of the upper and lower bounds. This line can serve as an equilibrium or reference point in the trend analysis.
---
### Visual Representation
- **Plotting the Channels:**
- The **basis** is plotted in a standout orange color (#FF6D00) to make the central trend reference easily visible.
- The **upper** and **lower** bounds are plotted in blue (#2962FF), creating clear boundaries for the price action.
- The area between these two lines is filled with a semi-transparent blue, enhancing the visual context of the channel and helping traders quickly assess whether price is near an extreme or within a normal range.
---
### Trend Identification Logic
Beyond plotting the basic Donchian Channel, the indicator introduces additional logic to track short-term trend changes:
1. **Higher Highs and Higher Lows:**
- **Higher High (`higherHigh`):** This condition checks if the current upper bound is greater than the previous bar’s upper bound, signaling a potential upward push.
- **Higher Low (`higherLow`):** Similarly, it checks if the current lower bound exceeds the previous bar’s lower bound, reinforcing an upward trend if the support level is rising.
2. **Lower Highs and Lower Lows:**
- **Lower High (`lowerHigh`):** This evaluates if the current upper bound is less than that of the previous bar, indicating a possible downward shift.
- **Lower Low (`lowerLow`):** It verifies if the current lower bound is lower than the previous bar’s, further confirming a bearish tendency.
The use of the `nz()` function ensures that on the very first bar—where no previous data exists—the code handles the values gracefully without causing errors.
---
### Visual Markers for Trend Signals
To make trend signals immediately apparent:
- **Markers are Plotted on the Chart:**
- **Green Labels ("HH" and "HL"):** These are placed on the chart when the indicator detects higher highs or higher lows, suggesting bullish momentum.
- **Red Labels ("LH" and "LL"):** These markers are shown when lower highs or lower lows are detected, indicating bearish pressure.
Each label is plotted either above or below the corresponding bar, ensuring that the chart remains uncluttered and that the trend signals are clear.
---
### Scalping Strategy on 1-Hour Charts
This indicator is specifically tailored for scalping strategies on 1-hour charts. Scalping involves capturing small, rapid profits from short-term price movements, and the clear trend signals provided by this tool can help traders pinpoint optimal entry and exit points. Here’s how it integrates into a scalping strategy:
- **Quick Trend Identification:** The green markers (HH and HL) suggest bullish conditions ideal for quick long entries, while the red markers (LH and LL) signal bearish conditions suitable for short entries.
- **Timing and Precision:** On a 1-hour chart, the indicator’s sensitivity to higher highs and lower lows allows traders to make rapid decisions aligned with the prevailing trend.
- **Complementary Analysis:** While the indicator provides fast signals, it is recommended to use it alongside additional tools (like oscillators or volume analysis) and strict risk management practices, ensuring that scalpers can confirm entries and exits efficiently.
By leveraging the indicator’s visual cues within a broader scalping framework, traders can enhance their ability to capture quick moves, thus optimizing their overall strategy on 1-hour timeframes.
---
### Conclusion
The “Donchian Channel Trend Tracker by KellyLikesCrypto” is a powerful tool for visualizing price extremes and trend direction. By combining the classical Donchian Channel with additional trend-tracking markers, it offers traders a clear and immediate way to assess whether the market is gaining bullish momentum or beginning to turn bearish. Its customizable parameters and clear visual signals make it particularly effective for a scalping strategy on 1-hour charts, where rapid decision-making is crucial.
This detailed breakdown should provide a comprehensive understanding of how each component of the indicator works together and how it can be effectively integrated into a short-term scalping strategy.

Future Trend Indicator (FTI) with Heiken AshiDescription: Future Trend Indicator (FTI)
The Future Trend Indicator (FTI) is a versatile and innovative tool designed to analyze market trends, smooth out noise, and provide a forward-looking forecast of potential price movements. Built with advanced features such as polynomial regression, EMA smoothing, confidence bands, and cross-validation metrics, this indicator offers a comprehensive approach for traders to gain insights into future price trends while maintaining realistic error margins.
Key Features:
Exponential Moving Average (EMA) Integration
The FTI incorporates a user-configurable EMA to smooth out short-term price fluctuations and highlight the overall market trend. This provides a stable and reliable reference for assessing price action.
Noise Reduction via Median Filter
To improve signal clarity, the source data is processed using a Median Filter, effectively reducing the impact of outliers and market noise. This ensures that the forecast focuses on meaningful price movements.
Polynomial Regression Forecast
A polynomial regression model is used to project future price movements based on historical data. This advanced statistical approach models potential non-linear trends, offering a sophisticated and adaptive forecast for the next specified period.
Confidence Bands for Forecast Accuracy
Upper and lower confidence bands are calculated using standard deviation, visually representing the potential error margin around the forecast. This feature provides traders with an understanding of the forecast's reliability and the expected price range.
Dynamic Visualization
The indicator uses visually appealing and intuitive plotting techniques:
A forecast line dynamically shifts based on polynomial regression and historical data.
Confidence bands are displayed with semi-transparent green (upper) and red (lower) shading for quick visual interpretation.
The EMA is displayed as a blue line for smooth trend observation.
Cross-Validation with RMSE (Root Mean Square Error)
The indicator includes an error metric to measure the accuracy of its forecast against actual future price movements. The RMSE is displayed as a yellow label on the chart, helping traders evaluate the forecast's historical precision.
Flexible Data Source
By default, the FTI uses hlc3 (the average of high, low, and close prices) as its source, providing a balanced view of market activity. Traders can easily customize this input to suit their preferences.
Forecast Customization
Users can configure the length of the forecast, moving average, and EMA to tailor the indicator to different trading styles and timeframes.
Short-Term Traders (Scalping/Day Trading)
EMA Length: 10
Moving Average Length: 5 to 10
Forecast Length: 50
Source: hlc3 (default)
Adjust noise filter (src_filtered) only if necessary.
Medium-Term Traders (Swing Trading)
EMA Length: 20
Moving Average Length: 10 to 20
Forecast Length: 100
Source: hlc3 (default)
Confidence bands can help manage risk for swing trades.
Long-Term Traders (Position Trading)
EMA Length: 50 to 200
Moving Average Length: 20 to 50
Forecast Length: 200
Source: hlc3 or ohlc4 for smoothing.
General Adjustments for Specific Markets:
Crypto (Highly Volatile)
EMA Length: 10 to 20
Moving Average Length: 10
Forecast Length: 50 to 100
Median filter length: 5
Forex (Moderately Volatile)
EMA Length: 20 to 50
Moving Average Length: 20
Forecast Length: 100
Median filter length: 5
Stocks/Indices (Less Volatile)
EMA Length: 50
Moving Average Length: 20
Forecast Length: 100 to 200
Median filter length: 5

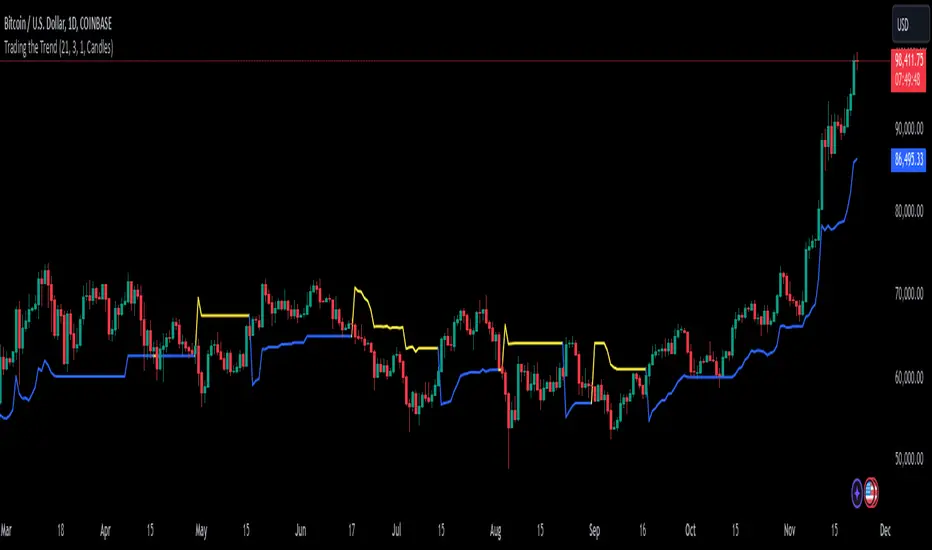
Trading the TrendTrading the Trend Indicator by Andrew Abraham (TASC, 1998)
The Trading the Trend indicator, developed by Andrew Abraham, combines volatility and trend-following principles to identify market direction. It uses a 21-period weighted average of the True Range (ATR) to measure volatility and define uptrends and downtrends.
Calculation: The True Range (highest high minus lowest low) is smoothed using a 21-period weighted moving average. This forms the basis for the trend filter, setting dynamic thresholds for trend identification.
Uptrend: Higher highs are confirmed when price stays above the upper threshold, signaling long opportunities.
Downtrend: Lower lows are identified when price stays below the lower threshold, favoring short positions.
This system emphasizes trading only in the direction of the prevailing trend, filtering out market noise and focusing on sustained price movements.
The trendline changes her color. When there is an uptrend the trendline is blue and when the trend is downward the trendline is yellow.
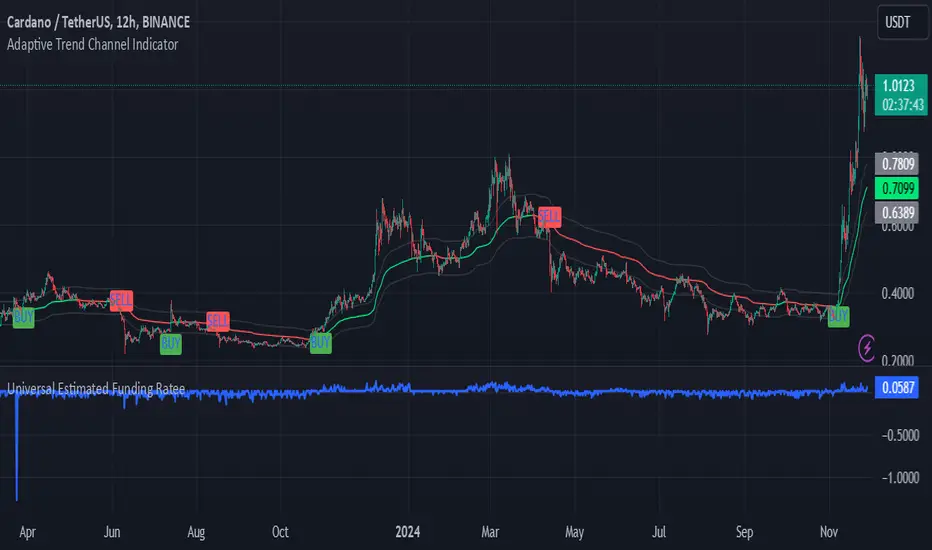
Adaptive Trend Channel IndicatorThe Adaptive Trend Channel Indicator is a trend-following tool designed to help traders identify buy and sell opportunities by analyzing price action in relation to a dynamic basis line with a customizable buffer zone. This indicator leverages an adaptive moving average to create a responsive trend line, providing insight into market direction and trend strength.
How It Works:
Dynamic Basis Calculation: Using a modified Kaufman’s Adaptive Moving Average (KAMA), the indicator calculates a basis line that adapts to price volatility. The basis line turns green during bullish trends and red during bearish trends, helping to visualize market sentiment.
Buffer Zone for Entry Signals: A buffer zone is calculated around the basis line to filter out false signals in low-volatility or sideways markets. Buy and sell signals are generated only when the price moves beyond this buffer zone, enhancing signal accuracy and reducing noise.
Non-Consecutive Signal Logic: To avoid over-trading, the indicator is programmed to prevent consecutive buy or sell signals in the same direction. This ensures that a new buy signal is only issued after a sell signal, and vice versa, for improved control in trending conditions.
Real-Time Alerts: The indicator issues real-time "Buy" and "Sell" alerts as soon as conditions are met, without waiting for the candle to close. This feature is particularly beneficial for intraday and scalping strategies, where timely entries are crucial.
How to Use:
Buy Signal: A buy signal appears when the basis line is green, and the price moves above the upper buffer zone, indicating a potential uptrend.
Sell Signal: A sell signal appears when the basis line is red, and the price falls below the lower buffer zone, signaling a potential downtrend.
The buffer zone’s sensitivity can be adjusted to adapt the indicator to different trading environments and personal risk tolerance.
Disclaimer: This indicator is designed to support your trading decisions and is best used in combination with other technical analysis tools. It is not intended as standalone financial advice.
Coins Trend Tracker HTThe Coins Trend Tracker HT script provides a powerful tool for monitoring and comparing the trend signals of multiple cryptocurrencies based on their Exponential Moving Averages (EMAs). This script is particularly useful for traders who want to keep track of multiple coins across different timeframes and identify potential trading opportunities based on EMA crossovers.
Features:
Customizable Coin Selection: Users can select up to four different cryptocurrencies to monitor.
Flexible Timeframes: Users can choose two different timeframes for EMA calculations to suit their trading strategies.
Visual Trend Indicators: The script displays trend indicators (🚀 for bullish and 💀 for bearish) based on the EMA crossover status for each coin and timeframe.
Conditional Cell Coloring: Table cells are color-coded based on the EMA crossover conditions, helping users quickly identify bullish or bearish trends.
Opacity Control: Users can adjust the opacity of the table cell colors for better visualization on the chart.
How It Works:
Coin Selection: Users can select up to four different cryptocurrencies to monitor by entering their ticker symbols.
Timeframe Selection: Users can select two different timeframes for the EMA calculations. The script calculates the 5-period and 20-period EMAs for each coin and timeframe.
EMA Crossovers: The script checks for EMA crossovers (EMA 5 crossing above or below EMA 20) and updates the trend indicators and cell colors accordingly.
Table Display: The script displays a table with the selected coins, their current prices, and trend indicators for the chosen timeframes. The background color of the table cells changes based on the EMA crossover status.
Script Logic:
The get_price function retrieves the latest price of the selected coin for the specified timeframe.
The get_ema_cross function calculates the 5-period and 20-period EMAs and checks for crossover conditions.
The fill_row function populates the table with the coin data, trend indicators, and conditionally colored cells.
The table header and data rows are updated based on the user-selected coins, timeframes, and EMA crossover conditions.
Usage:
Add the script to your TradingView chart.
Customize the coin selection, timeframes, text color, default cell color, bullish and bearish cross colors, and cell opacity through the input settings.
The script will display a table with the selected coins, their current prices, and trend indicators based on the EMA crossovers for the chosen timeframes.

[TradersPost] Simple Trend LinesThis script is designed to identify and visualize trends based on pivot highs and pivot lows over a user-defined timeframe on trading charts. It enhances trading strategy by dynamically plotting trend lines and adjusting to price changes, providing traders with real-time insights into potential breakout or breakdown points. This utility is crucial for those looking to refine entry and exit strategies based on technical trend analysis.
FEATURES
Dynamic Trend Lines: Automatically draws and updates trend lines based on pivot highs and pivot lows, helping traders to visualize current trends and potential reversal points.
Customizable Parameters: Offers extensive input options for users to define the number of bars to the left and right of pivots, the number of trends to track, and the sensitivity of the trend detection.
Trend Confirmation and Deletion: Includes features to confirm trends through multiple touchpoints and optionally remove broken trends from the display, keeping the chart uncluttered and focused on relevant information.
Design Flexibility: Users can customize the color and style of trend lines and labels, adapting the visual aspects of the script to their preferences or chart themes.
Performance Optimization: Utilizes efficient data structures and algorithms to manage memory and processing demands, ensuring that the script remains responsive even with extensive data.
DISCLAIMER
This script is provided for informational purposes only and does not guarantee profitability. It is still in the experimental phase and should be used as part of a comprehensive trading strategy that includes risk management and due diligence. Users should trade based on their own analysis and risk tolerance.

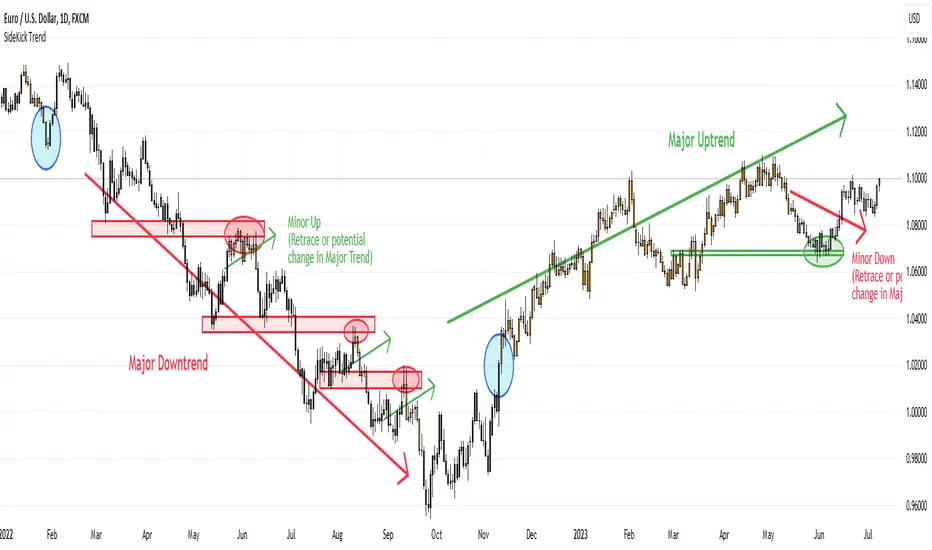
SideKick Trend
Pivot point based indicator using candlestick colors on the daily time frame to indicate potential trends.
The major trend corresponds to the breakout of a major pivot point, while the minor trend corresponds to the breakout of a minor pivot point.
Colors:
# Orange: Indicates major uptrend (important pivot high has been surpassed)
# Black: Indicates major downtrend (important pivot low has been broken)
Additional:
# Orange (50% opacity): Indicates minor uptrend (break of a minor pivot high) while a major downtrend persists
# Black (50% opacity): Indicates minor downtrend (break of a minor pivot low) while a major uptrend persists.
The minor trends serve as potential indicators of a shift in the major trend or a temporary retrace which may provide opportunities for strategic entry points depending on your strategy.
All scripts and content provided are for informational and educational purposes only! Past performance does not guarantee future results! The information and publications are not meant to be, and do not constitute, financial, investment, trading, or other types of advice or recommendations supplied or endorsed by nakedforexalgo.
Aleem Trend Supertrend EMA Title: "Supertrend and 200 EMA Crossover Strategy"
Description:
This script is designed to provide traders with a robust and original trading strategy by combining the Supertrend indicator with a 200-period Exponential Moving Average (EMA). The core concept is to utilize the strengths of both indicators to determine optimal entry and exit points.
The Supertrend indicator is well-regarded for its precision in signaling trend reversals by considering the volatility of the market, as measured by the Average True Range (ATR). It is particularly useful for identifying ongoing trends and potential reversals.
The 200 EMA is a widely-used indicator that many traders look to as a determinant of the long-term trend. When the price is above the 200 EMA, the overall market sentiment is considered bullish, and when below, bearish.
By combining these two, the script generates a Buy signal under the following conditions:
When the Supertrend turns bullish (color changes from red to green) with the closing price above the 200 EMA, or
When the price crosses above the 200 EMA while the Supertrend is already green.
A Sell signal is generated when:
The Supertrend turns bearish (color changes from green to red) with the closing price below the 200 EMA, or
The price crosses below the 200 EMA while the Supertrend is already red.
To avoid repetitive signals and to maintain clarity, the script has been enhanced with a feature to prevent multiple consecutive Buy or Sell signals. Once a Buy or Sell signal is generated, the script will not produce another identical signal until an opposing signal or an exit condition is met.
Exit signals for both Buy and Sell positions are provided to indicate when the trend is weakening or reversing, based on the Supertrend's color change in relation to the 200 EMA.
This strategy is flexible and can be utilized across various time frames and asset classes. It aims to aid traders in making more informed decisions by highlighting potential reversals and continuations in the market trend.
Usage:
To use this script, traders should observe the Buy and Sell signals as potential entry points. Exit signals should be taken as prompts to close positions or to protect profits with stop-loss adjustments. As with all strategies, it's recommended to use this in conjunction with other analysis methods and to backtest thoroughly before live implementation.
Multi-Timeframe Trend TableThis is the first publication of an indicator to show trend on the higher timeframes and is an English version of the "Mtf Supertrend Table" coded by FxTraderProAsistan. Credit goes to him for the genesis of this work. I updated the original code to Pinescript V.5 and modified it to suit my needs. Please enjoy.
This trend table indicator has the following features:
1. Trend Mode : Option to select the method of determining trend, using the Pinescript built-in ta.supertrend function or finding trend based on the cross of 20 and 50 EMA
2. 6 trend timeframes of your choosing, with show/hide
3. Optional feature to include the DXY (US dollar) trends, for the timeframes chosen. Useful for instruments that react to changes in the US dollar
4. ATR settings to adjust the Supertrend parameters. Default values are an ATR length of 10 and a Factor of 3

Pivot TrendLine with typeIntro
The simplest version of the indicator automatically draws trendLine on your charts, with newest Type syntax.
Type is some thing like type or interface in typescript or Structure in Clang.
with type key word you can write more clear code in pinescript.
Usage
You can change the looking back length settings to get more proper lines you want.
There is also a switch to turn off the historical trendlines .
You can use this to build more advanced indicators or strategies.
MXV trend BistroIt is so difficult for me to detect trend, maybe you.
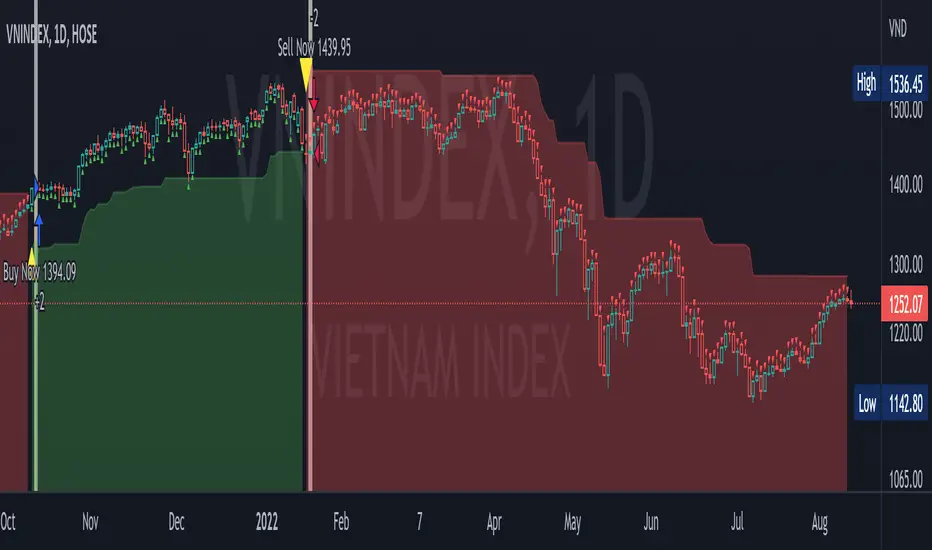
So I need a simple trend indicator to resolve the matter
This is a trend-following indicator which condenses two simple ranges: Recommended Buy range shown with green color zone and Sell range with red color zone. To make it easy for newbies, the indicator is decorated with arrow, vertical highligted ray, buy sell signals printed on chart. When in Buy zone, do not sell. In Sell zone, do not buy
1/ When to entry and how long keeping the position?
By default, this indicator suggests that the market is trending up or down. You should make a Buy entry (up arrow) then hold long time until pivots appear, then Sell (down arrow) to exit.
2/ Which price range to entry or exit?
You should make a buy/ sell entry close to the value of recommended entry price
3/ The most appropriate time frame for this easy-to-use script is Daily
P/S
Use it for trend detect
It is very easy to use