Chirped Sine Wave GeneratorINTRODUCTION:
The title pretty much sums up what this tool is, but not what it's for. It's NOT an indicator, just a chirped sine wave generator intended as a developer tool. Basically it sweeps from a very high frequency near the "Nyquist frequency" by chosen starting, step, and repetition rates to an ever decreasing lower frequency. This is typically viewed best on ALL, 5Y, or 1Y charts starting at bar_index==0 onward. Also, with the chart interval being intraday, you may use (ALT + SHIFT + ◀) keyboard shortcuts to jump back to barstate.isfirst. I will say, to witness a much broader scope of the sweep, having 4K is better for viewing it with the highest detailed resolution when making comparisons.
VISUAL AIDS:
When a frequency steps to another frequency a label displays the cycle period of the new frequency. This may be disabled to remove it's obstruction of view when overlaying indicators on top of it. I also included RMS levels that may be enabled.
USAGE:
As you can see above, I sourced TV built-in indicators to the "cSine Wave" plot, having varying results across the varying frequencies generated. Oscillating indicators and filters (ema, sma, etc...) of all sorts can be applied to it to inspect lag, amplitudes, or anomalies that render across the flux on the sweeping sine wave. Keep in mind market data has near infinite frequencies existing at any given time that can pop up or disappear instantly, so performance in theory on this swept synthetic waveform does not equate to performance on ANY ticker. It's gives you "ONE" totally different perspective to evaluate novel indicators.
OBSERVATIONS:
Witnessing the antiquated RSI on higher short frequencies, you will see it has a few issues, hmm. The amplitude is clamped near 50 at the Nyquist frequency growing with increasing amplitude in a funnel like shape. That doesn't imply it's a bad indicator, only there could be room for improvements... potentially. Wilder was calculating the RSI on paper basically, and the calculations were made as simple as possible in late 1970's. With advances in modern computing, many exotic permutations of RSI now exist attempting to improve upon it's original characteristics. EMA sourced to this tool appears in similar fashion to the RSI with it's own peculiarities. I suspect this occurs because EMA and RSI both use an IIR filter. CCI has a better representation across the spectral flux in this case, but that doesn't imply it's a perfect indicator on market data either. CCI could be improved as well...
REVELATIONS:
The chirped sine wave is only revealing a partial story about RSI's, EMA's, and CCI's attributes. In conclusion, how various frequencies affect our indicators, can be a bit more visually obvious using this tool, but it doesn't reveal all. For example, a 3D-RSI tells a different story when viewed in that perspective. Using a chirped sine wave, observations of ringing, weird frequency excitations, or no plot (na) may elude to more serious issues with an algorithm. In many cases, I often move the testing indicator pane to overlay the chirped sine wave pane for a more direct and precise inspection on 4K. I hope that gives you a better idea of this developer tool's intention and it's potentially limited but profound usage. I will be employing this upon nearly indicator fit for evaluation that I can utilize, upgrade, or invent in the future...
חפש סקריפטים עבור "wave"

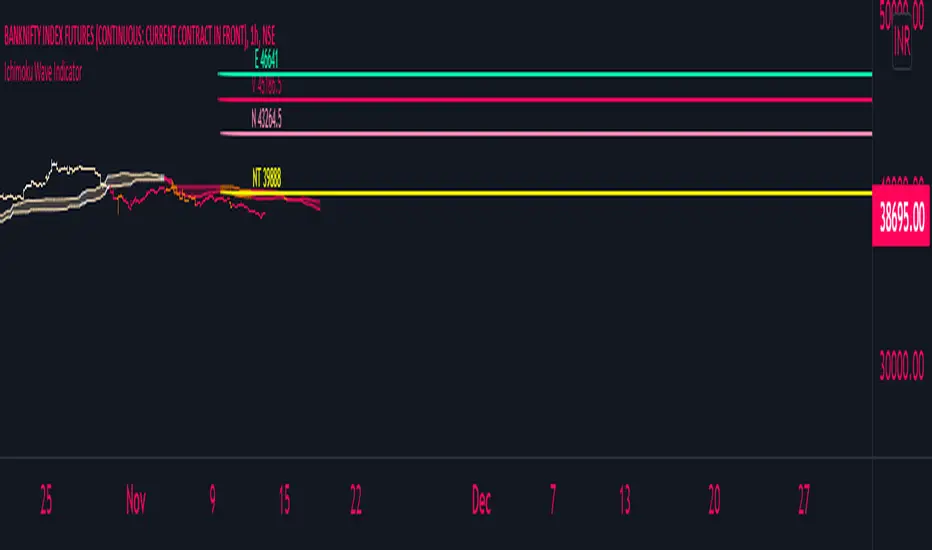
Ichimoku with Waves Created in 1940's by Goichi Hosoda withe the help of University students in Japan.
Ichimoku is one of the best trend following indicators that works nearly perfect in all markets and time frames.
Fill price in setup of indicator and you will find potential target zone of the wave
Volume Pump WaveThis indicator displays volume as a pump wave. Can be useful for chart analysis and easy detection of anomalies/trends.

Technical Ratings Pro - Pump WaveThis script uses the built in Technical Ratings indicator but interprets the data visually. It plots the results for "total", "MA" and "other" as pump waves. It uses MA to plot a trend line (can be turned off in settings) . Candles are colored to the rating strength and a percentage number was added to the results. For more informations on the Technical Ratings indicator please refer to official documentation.

Function Square WaveThis is a script to draw a square wave on the chart, with an indicator for current price.
Markets undergoing Dow Jones or Wyckoff Accumulation/Distribution cycles tend to move in such waves, and if the period of the cycles are detected, a signal for accumulation/distribution phases can be created as an early warning.
Useful inputs:
- Average True Range as the wave height.
- Assumed Wave period as the wave duration.
I divided the current price wave by 2 to make the indicator more visually friendly.
GLHF
- DPT

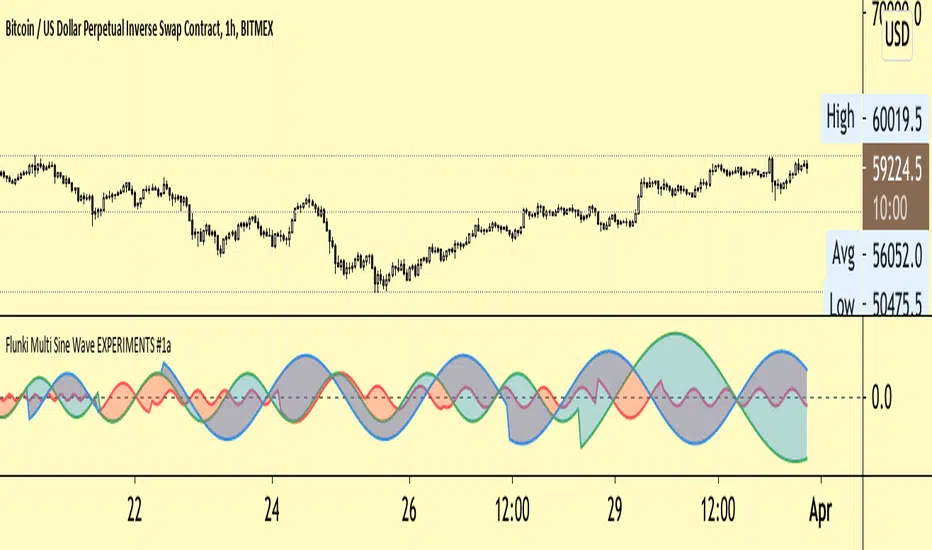
Flunki Multi Sine Wave EXPERIMENTS #1a** EXPERIMENTAL **
Herewith further sine wave experiments..
So you have 3 sine waves modulated by pivot points with look back / forward ranges
You can globally modulate the amplitude by the period, more fun than it sounds
You can flip phase individually
You can adjust offset individually
There is a global offset and a global period multiplier
See what you want to see !
Enjoy
ps. published this at xmas but it got kicked back by the mods for reasons
Dual Weis Wave VolumeIt took but left, a Weis wave volume that shows the main wave and the fractal wave, thinking of everyone who wants to save space with indicators, you can adjust 2 indicators within 1, it is the dual indicator.
This indicator calculates the volume waves, being created initially by David Weis, largely behind the wyckoff method that unfortunately died, being very useful in reading flow, replacing even Times in Trades in Tape Reading, since he makes the information more accurate visually.
The novelty is the addition of a fractal flow, that is, if the main one misses an information, the fractal will show, in addition to saving space to add another indicator and not the same with other values.

cRSI + Waves Strategy with VWMA overlayStrategy based on my cRSI with motive/corrective wave indicator. Please note that it is far from perfect. I use it mostly to help me identify good entry and exit points when combined with my other technical analysis. It misses some obvious points, but on average it does pretty well. The challenge often is indicating when you have sufficient change in the cRSI to know that the trend has changed, that means sometimes it can be a little early or late. It definitely helps take a lot of the guess work out of things. It works better on some equities than others and better on some time frames than others. You just have to play with it. At the minimum, it is a good template to learn how to write your own.

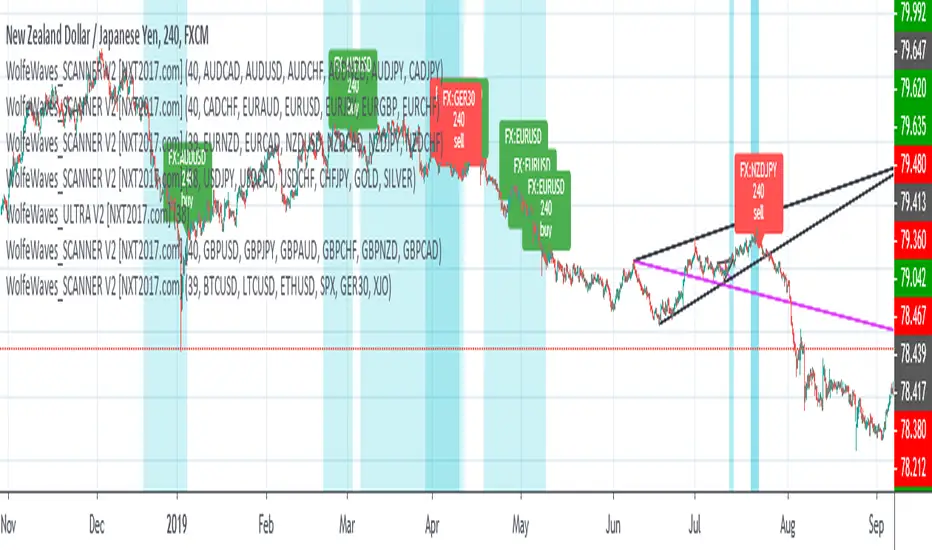
WolfeWaves SCANNER V2 - Market Scanner for Wolfe Wave Pattern
HI BIG PLAYERS AROUND THE WORLD,
this script allow to find Wolfe Wave Pattern in any market at the same time. One indicator can scan 6 markets/symbols - what ever you choose. For more markets you have to take the indicator more then once in your chart (look on my posting chart above).
Parallel the indicator gives signals as soon as Wolfe Waves are near finish pattern on point 5. In the default settings, the signals are displayed with a blue background on the chart. The markets with Wolfe Waves can you then read on the label in your chart.
The timeframe you currently has open is also the timeframe where the market scanner analyze the other markets / symbols in the background.
WolfeWaves SCANNER V2 is offered for sale. More information can be found below in the signature.
However, anyone can test this indicator for once without any registration in a 3 day trial. You can request access with a simple message to me.
Another trial of 7 days is included in the offer on my website - before the first payment will done.
When testing, please check whether your system requirements are sufficient. The many labels require a lot of memory from your computer.
For more great indicators everyone is invited to follow me on TradingView.
Kind regards
NXT2017
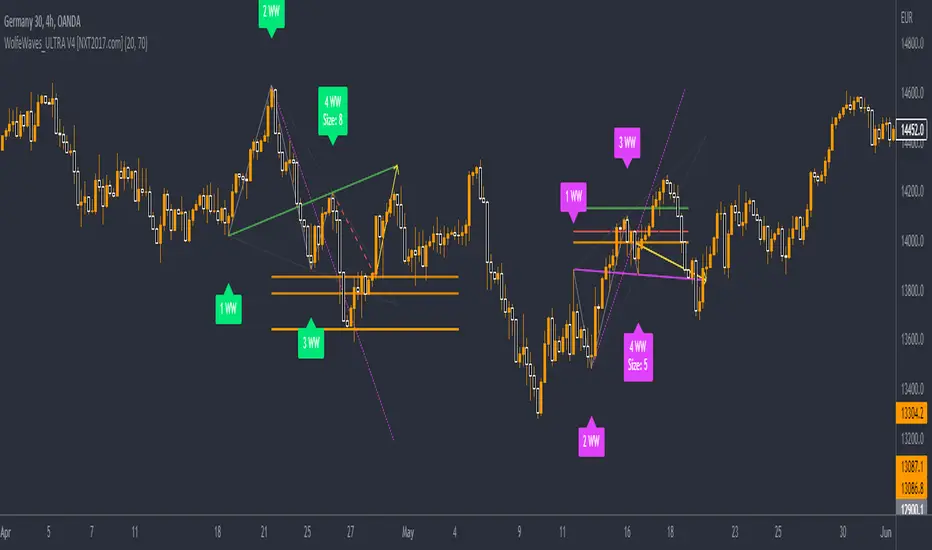
WolfeWaves_ULTRA V2 - Wolfe Wave auto lines drawing incl. SignalHI BIG PLAYERS AROUND THE WORLD,
this script allow to draw automatically lines of Wolfe Wave pattern.
Parallel to the automatic drawing, the indicator can give signals as soon as the 5 point of the Wolfe wave is immediately reached or has been reached. This allows the indicator WolfeWaves_ULTRA V2 to give early signals. In the default settings, the signals are displayed with a blue background on the chart.
WolfeWaves_ULTRA V2 is offered for sale. More information can be found below in the signature.
However, anyone can test this indicator for once without any registration in a 3 day trial. You can request access with a simple message to me.
Another trial of 7 days is included in the offer on my website - before the first payment will done.
In the settings it is possible to change the degree of details. This is sometimes necessary because TradingView limited only 55 lines per indicator in Pinescript Version 4.
In extreme cases it is therefore possible to change the settings that the Wolfe Wave pattern represent waves only from 3 lines. This allows the indicator to detect far more wolf waves on the same chart.
For more great indicators everyone is invited to follow me on TradingView.
Kind regards
NXT2017

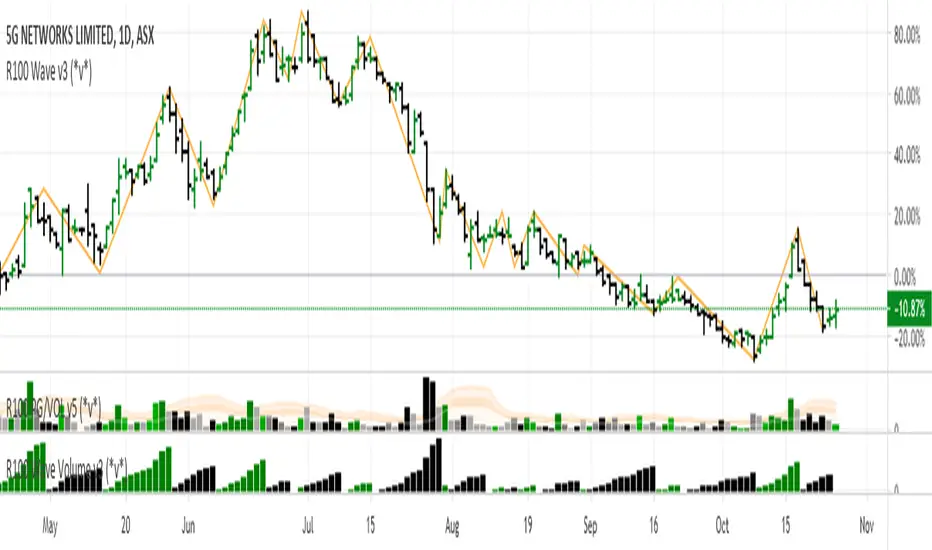
R100 Wave Volume v2 (*v*)This indicator is similar to the Weis Wave Volume indicator in that it shows cumulative volume for each up and down price wave. However it is calculated differently, using the Jurik moving average to determine turning points. Use this in conjunction with the R100 Wave indicator to determine the best fit Jurik length and power settings.
A great indicator to help analyse the strength of pullbacks, continuation moves and changes in behaviour.
I hope you get some value out of it. Only conditions of use are that if you improve it, let me know and if you publish something that uses it, don't hide the code! Enjoy!
Code pinched and modified from Zero Lag ZigZag by Duyck - thankyou
Jurik Moving Average (for turning points) by Everget - thankyou
and Weis Wave by Modhelius - thankyou
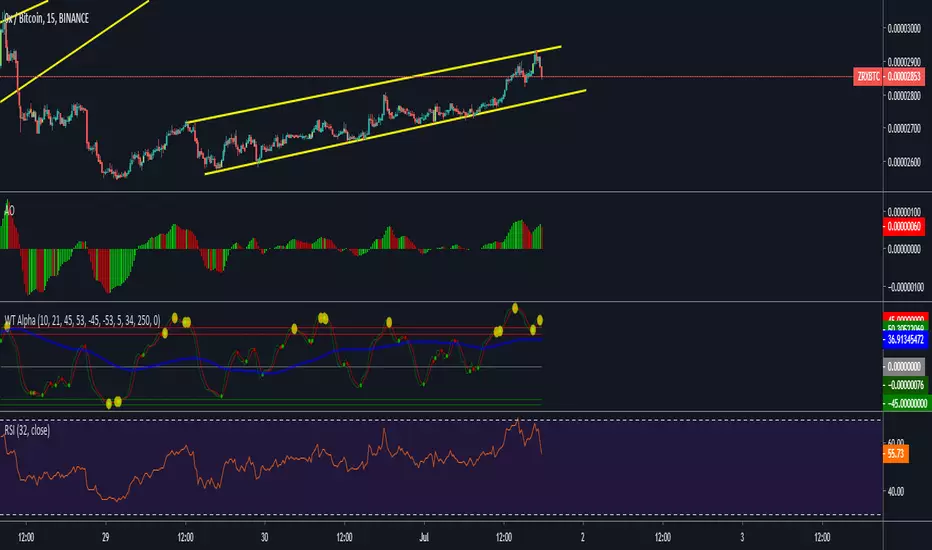
WaveTrend + Alert + LSMA + CrossWaveTrend inspired by LazyBear's WT indicator with addition of crossing dots, crossing alert and LSMA


Wave Volume OverlayWaves of price action are created based on periods of sustained direction volume. This indicator allows you to see the rating of volume in each of these waves relative to others.

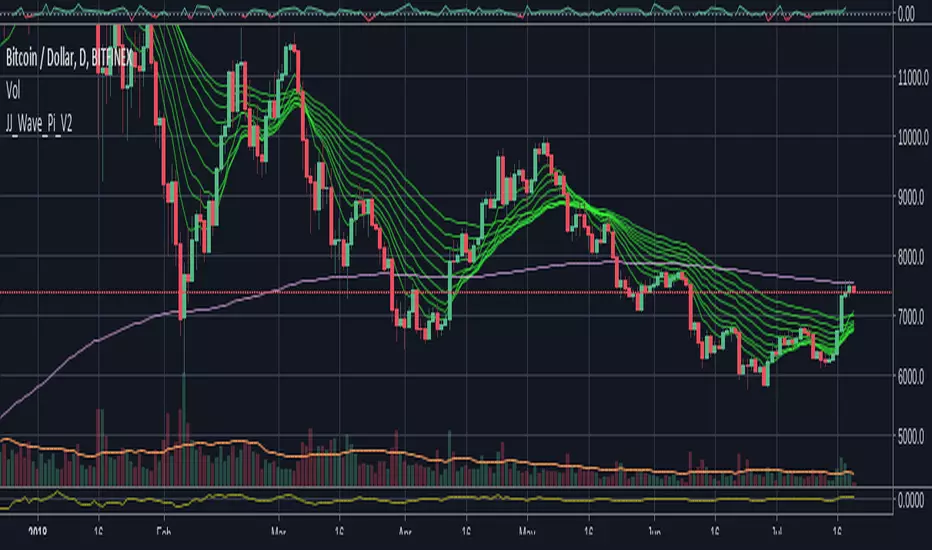
Jason Jenkins Wave plus Pi [Ver. 2] EMA & brighter colors.The Moving Average Wave and Pi Line. A little boredom led me to brighten the colors a bit and try out EMA instead of SMA, which I think produces a better wave. Enjoy
Fibonacci WavesFirst of all, ignore all other lines in the example chart except the four FAT lines. The four fat lines are the ones that define the fibonacci price leves. The lines have different extension offset to the right. The shortest one is the end of the second wave ( or leg B ), the next one is the end of C, the one following that is the end of D and the final one is the end of the final leg E.
The two input parameters is the start of A and the end of A.
If the start of A is larger than then end of A, the calculated series is a downward trend, else it is an upward trend.
Calculation based on old EWT simple wave expansion by fibonacci sequence.
0.618, 1.618, 0.382
Based on this source:
www.ino.com
Best Regards,
/Hull, 2015.05.20.15:50 ( placera.se )

Momentogram - WaveThis is another way you can plot the Momentum Histograms. This can be manipulated to Wave A, B, C from trade the market.
TTM WAVES - if you can manipulate the settings, this will work. 100%
List of All my Indicators - www.tradingview.com

Rule-Based Elliott Wave Strategy by xitaxutaStrategy Description
This is a rule-based Elliott Wave–inspired trading strategy designed for lower timeframes (e.g., 1-minute).
The strategy converts Elliott Wave concepts into objective, testable rules using swing pivots, Fibonacci retracements, and momentum confirmation.
The core idea is to trade Wave-3 continuation moves after a valid Wave-1 impulse and Wave-2 corrective pullback have been identified.
How it works
Wave 1 Detection
Identifies an impulsive move using pivot structure and a minimum ATR size filter to avoid noise.
Wave 2 Validation
Waits for a corrective structure (A–B–C–like behavior) and validates it using Fibonacci retracement rules (default ~38%–78%).
Entry Logic
Trades are triggered only on confirmation, not anticipation:
Longs: break above corrective resistance (Wave B)
Shorts: break below corrective support (Wave B)
Risk Management
Stops are placed at the true Wave-2 extreme, invalidating the Elliott count if hit.
Position sizing is based on a fixed percentage of account risk.
Targets
Partial profits are taken at R-based levels, with optional continuation targets using Wave-3 Fibonacci extensions.
Momentum Filter
RSI is used as a confirmation filter to align momentum with the expected Wave-3 direction.
Design Philosophy
No subjective wave drawing
No prediction of tops or bottoms
Structure → confirmation → execution
Focused on high-momentum continuation, not reversals
This strategy is best suited for active intraday trading and performs optimally in markets with sufficient volatility.
Important Notes
Elliott Wave concepts are approximated using objective rules.
The strategy waits for confirmation and may appear “late” by design.
Results depend on market conditions, timeframe, and parameter selection.

Fib Green zone / Red zone + Elliott Wave 3═══════════════════════════════════════════
🎯 FIB GREEN ZONE / RED ZONE + ELLIOTT WAVE 3
═══════════════════════════════════════════
OVERVIEW
--------
A comprehensive technical analysis tool combining Fibonacci retracement levels
with Elliott Wave theory to identify high-probability trading opportunities.
KEY FEATURES
------------
✅ Dynamic Fibonacci Levels (0%, 23.6%, 38.2%, 50%, 61.8%, 78.6%, 100%)
✅ Color-Coded Trading Zones:
• Green Zone (0-23.6%): Strong support area
• Golden Zone (50-61.8%): High-probability reversal zone
• Red Zone (78.6-100%): Potential resistance area
✅ Elliott Wave 3 Detection:
• Automatic Wave 1 & 2 identification
• Wave 3 entry signals
• Golden Pocket setups (highest probability)
• Customizable retracement parameters
✅ Fully Customizable:
• Toggle individual levels on/off
• Customize all colors and line styles
• Adjust Elliott Wave sensitivity
• Show/hide labels and zones
IDEAL FOR
---------
- Day traders and swing traders
- Fibonacci-based trading strategies
- Elliott Wave practitioners
- Support/resistance trading
ALERT SYSTEM
------------
Built-in alerts for:
- Price crossing key Fibonacci levels
- Wave 3 entry signals
- Golden Pocket setups
HOW TO USE
----------
1. Apply to any timeframe (works best on 1min-1hr for intraday)
2. Watch for price action in zones
3. Wave 3 signals appear when setup criteria are met
4. Use with other confirmations (volume, price action, etc.)
IMPORTANT DISCLAIMER
-------------------
This indicator is for educational purposes only. It does not guarantee
profitable trades. Past performance does not indicate future results.
Always use proper risk management and conduct your own analysis.
═══════════════════════════════════════════
📧 For access requests or questions, please message me directly.

Dynamic Elliott Wave By Lucky-CBTIndicator overview
Dynamic Elliott Wave v5 detects and visually labels single-degree Elliott impulse (1–5) and corrective (A–B–C) structures using robust pivot detection and optional Fibonacci validation. It’s designed as a mechanical, configurable helper to identify clear wave structures across timeframes and instruments — useful as a structural guide for analysis and strategy development.
Key features
Mechanical pivot detection (zigzag-style) evaluated on confirmed bars for stability
Automatic detection and persistent drawing of 1–5 impulse and A–B–C corrective structures
Optional Fibonacci-based validation for Wave 2 / Wave 4 retracements with tolerance control
Configurable pivot lookback and minimum move threshold to reduce noise on different timeframes
Visuals: colored lines and labels for impulses (1–5) and corrections (A–B–C)
Lightweight memory use with bounded pivot storage and safe redraw logic
How it works (short)
Detects pivot highs/lows using ta.highestbars / ta.lowestbars over a user-set lookback
Builds candidate 5-pivot sequences and validates alternation, magnitude, and optional Fibonacci relationships
When a valid impulse is found the script stores and draws the 1–5 chain; if a following 3-pivot corrective is found it stores and draws A–B–C
Visuals persist until a new validated structure replaces them so charts remain readable
Inputs and recommended settings
Pivot lookback (bars): controls sensitivity. Lower for faster markets / lower TF (e.g., 3–7), higher for slow markets / higher TF (e.g., 10–30).
Min move size (%): filters tiny swings. Start ~0.5% for volatile symbols, 0.1–0.3% for large-cap equities on daily.
Use Fibonacci checks: on/off. Turn on to enforce common retrace rules; turn off if you prefer looser mechanical counts.
Fibonacci tolerance: widen for noisy markets, tighten for strict validation.
Show lines / Show labels: toggle visuals to reduce clutter.
Practical notes and limitations
Elliott Wave counting remains partly subjective; this script provides a consistent mechanical count, but it will not match every manual analysis. Use as a guide, not a final trading signal.
The script detects single-degree structures only. For nested multi-degree analysis, consider adding recursive detection layers or complementing with manual degree assignment.
Requires sufficient chart history (max_bars_back) to retain older pivots when reviewing long-term structures. Increase max_bars_back if needed.
Test and tune pivot_len and min_move_pct for your instrument and timeframe before relying on counts in live trading.
Change log (high level)
v1.0 — Initial release: mechanical pivot detection, impulse 1–5 and corrective A–B–C detection, persistent visuals, Fibonacci validation.
Future: planned options for ATR-based pivots, multi-degree nesting, manual clear/aging controls, and degree coloring.
Disclaimer
This indicator is provided for educational and analytical purposes only. It does not provide financial, investment, or trading advice. Always combine structural analysis with risk management and validate any strategy on historical data before trading live.
If you want, I can produce: (1) a shorter “one-sentence” blurb for the publish header, (2) example default settings for specific markets (BTC, Nifty, Forex), or (3) release notes formatted for TradingView — tell me which.
