Freelancer30169656This indicator is make for educational purpose.
This Indicator actually try to identify a price action. It uses 30 W moving average for Trend analysis.
The moment it crosses above the 30 W moving average,
up trend starts. But the start should be Good. The moment it crosses 30 W moving average ,
that particular candle should have high volume than average and
the RSI should be also above or equal to 50.
The preferred Time frame is to be used is Weekly.
1-> When price crosses above 30 weeks moving average,
2-> the volume should be Three times the 50 volume average.
3-> The RSI (14) should be above 50.
In this indicator neither plots moving average nor volume average nor RSI. It only plots a single Green arrow below the that
satisfy all 3 conditions.
That green arrow indicates BUY signal.
No exit criteria is defined here.
חפש סקריפטים עבור "weekly"

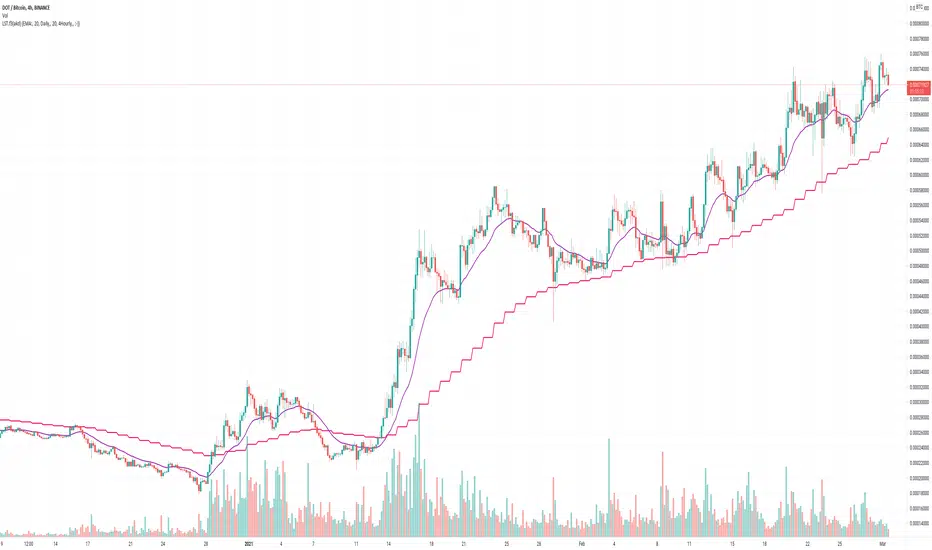
LedgerStatusToolbox fork3: EMA/SMA that stays on a specific timeMy (akd) radically cut down fork#3 of the "Ledger Status Toolbox"
which had included many more options that I don't need
but was missing the 4hourly, and hourly = which I added here
and yes, I kicked out the weekly. Hardly ever looking at that anyways. Shall I reintroduce it for fork4 ?
The huge advantage of this approach, over other SMA/EMA indicators:
It stays on the chosen (e.g. daily) data, and calculates the moving averages for that data. Even if you switch the chart to different time candles (like hours or weeks).
So whatever time resolution candles you look at, these indicator lines stay in the same place.
Thanks to krogsgard. Check out his "Ledger Status Toolbox" it also has Bollinger bands (but those are always on "current" I think?). A very powerful tool, just too powerful for most times for me newb. So I cut it down to this mini version. Enjoy!
coates moving averages (cma)This indicator uses three moving averages:
2 period low simple ma
2 period high simple ma
9 period least squares ma
The trend is determined by the angle of the moving averages, current close relative the the 9 least squares ma (lsm) and the current close relative to the prior two periods high and low.
When there are consecutive closes inside the prior two candles high and low then a range is signaled:
In ranges the buy zone is between the lowest low and the lowest close of the current range. The sell zone is between the highest high and the highest close. The zones are adjusted as long as the new close is within the prior two candles range:
When price closes above the 2 high ma and the 9 lsm then a bull trend is signaled if all moving averages are angled upward (as seen at #4 in the chart above and #1 the chart below ). If the 9 lsm and / or the 2 low ma continue to angle downward, following a close above the 2 high ma and 9 lsm, then a prolonged range or reversal is expected (#2 in the chart below):
During a bull trend the buy zone is between the 2 low ma and the 9 lsm. The profit target is the 2 high ma:
During dip buying opportunities price should resist closing below the 9 lsm. If there is one close below the 9 lsm then it is a canary in the coalmine that tells us to proceed with caution. This will often signal a range, based on the conditions outlined above. To avoid a prolonged range, or reversal, price needs to immediately react in the direction of the prevailing trend:
If the moving averages are angled down and the most recent close is below the 2 low ma and 9 lsm then trend is fully bearish:
During a bear trend the short zone is between the 2 high ma and 9 lsm. The profit target is the 2 low ma:
When the 2 high ma angles down and the 2 low ma angles up while price closes inside both mas then it indicates a cma squeeze:
Volatility is expected in the direction of the breakout following the squeeze. In this situation traps / shakeouts are common. If there is a wick outside the cma, with a close inside, then it indicates a trap / shakeout. If there is a close outside the 2 high / low ma then it signals a breakout.
A trend is considered balanced when the 9 lsm is roughly equidistant from the 2 low and 2 high mas. If the 9 lsm crosses the 2 high or 2 low ma then it signals exhaustion / imbalance.
For a stop loss I use the prior three periods low, for bull trends, and the prior three periods high for bear trends. I would expect other reliable stops, such as the parabolic sar or bill williams fractal, to be effective as well. The default moving averages should be very effective on all timeframes and assets classes, however this indicator was developed for bitcoin with a focus on higher timeframes such as the 4h, daily and weekly.
As with any other technical indicator there will be bad signals. Proceed with caution and never risk more than you are willing to lose.

MA200W buy sell BTC ColoredA script to help you plan your entrances and exits with beautiful colors for BTC. It just helps to better highlight the gap between the start of the week and the end.
It only work on Weekly.
Info :
Blue ... you can wait, enjoy your life
Green is when you buy
Yellow when you enter bull market
Orange is when you begin to take care of next week
Red when you begin to sell low part
White, if while a week you see white you can sell bigs bags, if it end with White you can close majors positions
Warning White may not appear, if second week after first Red week is not White you can sell large position
Good luck and take a breath

Valuation Bands - Customized Bollinger BandsValuation Bands are supposed to be used for taking INVESTMENT decisions. Hence best time frames to use these bands are Daily & Weekly.
These bands are an attempt to represent a stock's valuation in terms of its pricing. Obviously, there is no relation between actual valuation determined through Fundamental Analysis.
The bands have been created by modifying Bollinger band settings. There are 3 bands Over-Valuation Band, Average Valuation Band & Under Valuation Band.
OVER VALUATION BAND
- Do not create fresh positions near or above this band
- If the price is trading above the band; hold onto your investment unless there is closing below this band.
- If the price closes below this band; wait for a reversal sign to create a fresh entry.
AVERAGE VALUATION BAND
- Create a new or keep adding more to your existing positions as the price approaches this band.
- It is recommended to exit if this band is broken & wait for fresh entry.
UNDER VALUATION BAND
- Look for a fresh investment opportunity after there is closing above this band
- Do not create fresh positions unless there are clear reversal signs.
You can use this indicator along with REKAB & RECAT to confirm entry points.

Indices Sector SigmaSpikes█ OVERVIEW
“The benchmark Dow Jones Industrial Average is off nearly 300 points as of midday today...”
“So what? Is that a lot or a little? Should we care?”
-Adam H Grimes-
This screener aims to provide Bird-Eye view across sector indices, to find which sector is having significant or 'out-of-norm' move in either direction.
The significance of the move is measured based on Sigma Spikes, a method proposed by Adam H. Grimes, where Standard Deviation of returns used as a baseline.
*You can google his blog or read his book, got some gold in there, especially on how he use indicators for trading
█ Understanding Sigma Spikes
As described by Grimes, moves in markets are only meaningful when we consider what “normal” is for that market.
Without that baseline, the daily change number, and even the percent change on the day doesn’t really mean much.
To overcome that problem, Sigma Spikes, as a measure of volatility, attempt to put todays change in price (aka return) in context of the standard deviation of 20 days daily's return.
Refer chart below:
1. The blue bars refer to each days return
2. The orange line is 1 time standard deviation of past 20days daily's return (today not included)
3. The red line is 2 time standard deviation of past 20days daily's return (today not included)
Using the ratio of today's return over the Std Deviation, determining your threshold (1,2,3,etc) will be the key that tells if today's move is significant or not.
*Threshold referring to times standard deviation, and different market may require different threshold.
*20 Days period are based on the Lookback Period, adjustable from user input window.
█ Features
- Scan up to 13 symbols at a time (Bursa (MYX) indices are defaulted, but you may change to any symbols/index from the user input setting)
█ Limitation
- Due to multiple use of security() function required to call other symbols, expect the screener to be slow at certain times
- Custom Timeframe currently accept only Daily and Weekly. I'll try to include lower timeframe in the next update
█ Disclaimer
Past performance is not an indicator of future results.
My opinions and research are my own and do not constitute financial advice in any way whatsoever.
Nothing published by me constitutes an investment recommendation, nor should any data or Content published by me be relied upon for any investment/trading activities.
I strongly recommends that you perform your own independent research and/or speak with a qualified investment professional before making any financial decisions.
Any ideas to further improve this indicator are welcome :)

Rain On Me IndicatorFinally, we made it :D
Rain On Me Indicator, As the name suggests this indicator will make money rain on you. More seriously, this indicator contains :
This indicator contains:
-Bullish and bearish RSI divergences showing on chart with alerts.
-Parabolic SAR with Labels on chart with buying or selling alerts.
-3 Moving Average (MA 1 : 7, MA 2 : 21 MA 3 HIDDEN : 50 (Cross alerts for Pullback)
-Customizable Bollinger band
-Fibonacci on 10 levels with the level 0 to the middle. This Fibonacci help a lot since it can let you find easily entry/exit point, trend and even where to place your Take Profit and Stop Loss. It have alerts for most important levels (0.382, 0.§, 0.618) for Crossunder and Crossover in Bullish or Bearish trend.
-Fully Customizable Ichimoku Cloud.
-Trend Buy/Sell Labels on chart with buying or selling signal alerts.
-Trend color visible on candles.
If an alert trigger of Buy/Sell Signal with the same alert based on PSAR, so you can be confident to enter in position. Alway checking fibs level that is the key thing with this indicator. the script has been set to have the best possible results on as many market as possible. But.best result for zfter backtesting is on
Forex : EUR/USD, USDJPY, USDCAD.
Indice : S&P500, NASDAQ, DOWJONES
Commodities : OIL, WTI
Everything work on following timeframe :
15MN, 1H, 4H, DAILY, WEEKLY.
So that you can avoid having to set it again, whether it be in minutes, hours, days, months.
So you can easily trade in the mode that suits you best. It works well on everything from indices to forex to commodities etc. I thank all those who allowed me to carry out this project. IF you feelt free to give your ideas, suggestions, for improve it by sending me messages.
This is really a first version sp it may contain bugs / errors that will be fixed over time.
A BIG THANK YOU TO QUANTNOMAD WHO GIVE ME HIS PERMISSION TO USE, MODIFY AND REPUBLISH HIS "Ultimate Pivot Points Alerts" Script Indicator :
Good trade to all !

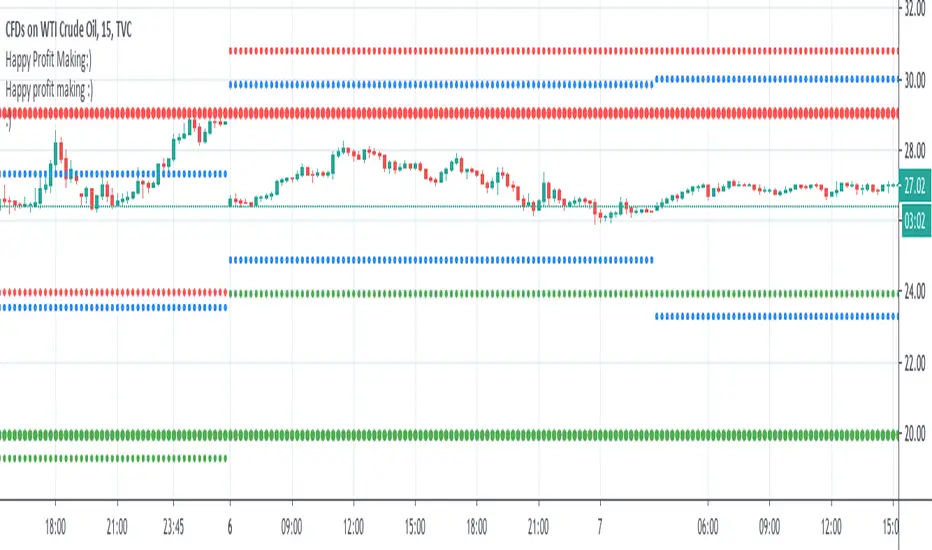
mtf b zonesThese zones helps to do intraday, short term & long term. The blue lines are for intraday. The small green and red dotted lines are for weekly. The large green and red dotted lines are for monthly. use this along with price action trading. Best wishes. Thank you....
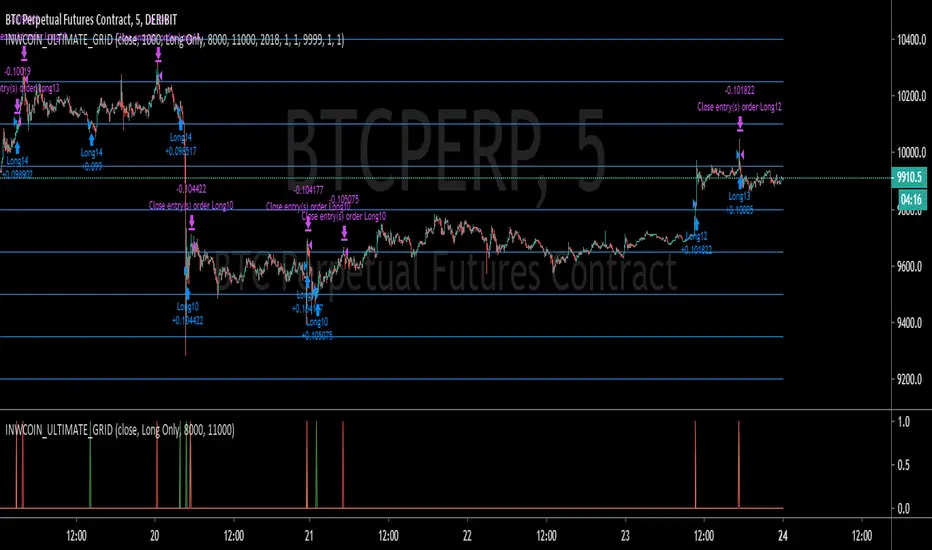
inwCoin Ultimate Grid StrategyinwCoin Ultimate Grid Strategy is the proof of concept of infamous grid trading strategy.
IDEA :
- The idea is to put the price level as a grids on the chart and when price cross up or cross down it will enter position.
- If the price move to next level it will take profit the last level and enter new position.
Caution :
- If market is trending into one direction, it's not wise to run this strategy counter trend. eg. run short grid when trend is up or run long grid when trend is down.
- So make sure you have something to define the big trend like Moving Average (18) TF weekly.
- I still can't try in range market ( sideway ) because this strategy using 5 min TF to work and tradingview don't provide data back that far.
How to use
1) Find out which start value of your asset that you want to use. Eg. BTC is 8000 for this time ( 22/2/2020 )
2) Define the spread of each grid as percent. ( eg. 2% for BTC ). You can choose small percent like 0.2% or 0.01 in asset like currency or altcoin/btc
3) The default grid level is 20 grids, so you can try and try again until you happy with the result.
4) This strategy is fix position size so it can easily calculate.
5) Don't forget to check "Properties" tab to try changing capital size and fee rate to match your criteria
6) This strategy is not perfect, it just some proof of concept to see if the strategy is working in real trade.
Extra :
If you want to access to alert for this strategy you can inbox me for detail.
Chingas MTF SMASuper simple Multi Time Frame Simple Moving Average.
This is hard coded to auto select the 200 SMA from multiple timeframes such as the 30m, 1H, 4H, Daily and Weekly.
I am hopeful in another version to be able to get the 12H available in a drop down but at the present moment, it is not an option.
This script will give the convenience of seeing where a Moving Average on another timeframe sits, no matter what timeframe you are currently displaying.

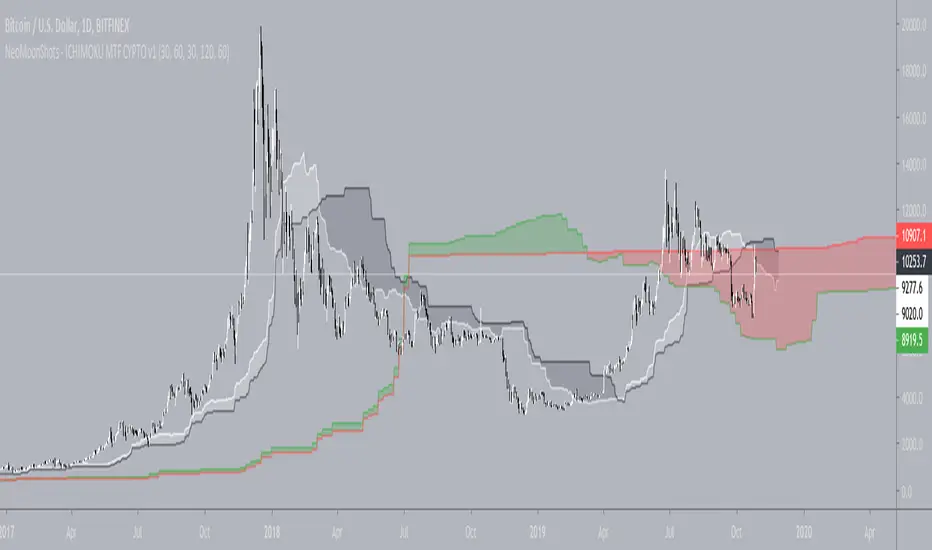
NeoMoonShots - ICHIMOKU MTF CYPTO V1Ichimoku cloud study to support multiple time frame (TF) at any given TF.
Supported TFs are:
1. 1 Hour
2. 4 Hour
3. Daily
4. 2Days
5. 3Days
6. Weekly.
Infopanel to show SenkouSpan A and B levels.
Multi TF - RSIRSI with 5 timeframes, you can change the TF it in the configs.
This one has 1h, 2h, 4h, Daily and Weekly.

Golden Cross by -Westy-Quick Guide
- Yellow cross and green MA on top = Potential uptrend
- Yellow cross and red MA on top = Potential downtrend
A simple golden cross indicator of the green 50 and red 200 SMA with a yellow cross for ease of visibility and backtesting.
Generally, longer time frames more powerful signals but are less frequent. I typically use it on the 4 hour, daily and weekly.


Multiple MAs & EMAsMultiple MA & EMA for swing and scalp trading. Good for every timeframe with specific MA's for weekly.
Suited for Bitcoin. Change the MA periods if you want to use it on other assets.
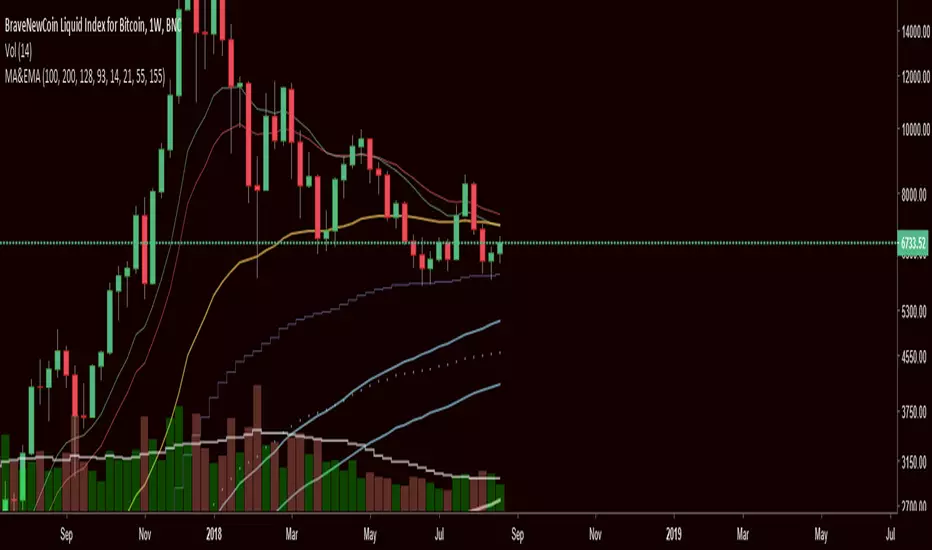
6 SMA's (fit to BTC) 9,20,30,50,128,200 (exponential optional)I've been using these for a while trading Bitcoin and I've found them to be the most useful to me. I replaced the 7 you may have seen in the first set with the 9 as I'm seeing it tested across many time frames quite frequently. The least used of the six is the 30 period, but it does have some influence I've found on the large time frames, mainly the weekly.

StochRSI and RSI StrategyThis is a strategy that is based around using the general value of the RSI to determine the trend and then using the Stoch RSI to pick and entry point.
It also uses the RSI to determine a profit taking point or exit point from the trade.
This version doesn't have a stop loss other than the signal to trade the opposing direction. Therefore it is more effective in higher trading time frames like Daily and Weekly.
I have also added the function of selecting the time frame for which the strategy is applied to.

'OPEXXINQ' Market CapsMarket Caps for the following:
OMGUSD
PARTUSD
EOSUSD
XLMUSD
XMRUSD
IOTUSD
NEOUSD
QTUMUSD
Supplies refreshed weekly.

'PLINEOX' DominanceCustom index of dominance for the following:
PARTUSD
LTCUSD
IOTUSD
NEOUSD
EOSUSD
OMGUSD
XMRUSD
Supply refreshed weekly. PM me if you want a custom index.


Quantitative Qualitative Estimation (QQE)The indicator QQE, is an interesting tool based on a Relative Strength Index (RSI). While the original RSI is often used as a pointer for overbought or oversold market phases, the QQE provides additional information. Use the QQE to display trend direction and trend strength .
For me this is one of the most important indicator for Trend Following.
##This QQE indicator is an improved version made by 'mladen' for Metatrader 4.
The histogram does not differ from the original QQE! The developer has adapted the scaling so that the central horizontal level is zero. It has no effect to the result, but is much more convenient to analyze the trend.
Main Signals
Background changes when the black line crosses the grey line.
Identify the trend direction
Singal turns green while the main QQE trendline is above the zero line and red while it is below.
This works best in the major timeframes like Daily or Weekly.
You can activate this signal in the settings.
NYSE:THO
Identify the trend strength
_Histogram Colors_
Green (above 10): bullish
Red (below -10): bearish
Yellow: flat
It is not a buy or sell signal when the color of the histogram changes. It only says that one side could gained the advantage.
If you use a large timeframe like Monthly, you can reduce the number of false signal by setting the SF (Slow Factor) from 5 (default) to 1.
S&P 500, Monthly
Please always remember, there is no holy grail indicator!
...but this one defines trends quite accurately.

Madrid Upper OHLCThis study displays the candlesticks of the upper timeframe, this provides a glance of the bigger picture in the current time frame by quickly and easily identifying the main OHLC levels.
In this example I am using the indicator twice on the 15 min chart, the first implementation displays the candles of the Daily timeframe and the second displays those of the weekly.

Yacine EMA Bands V2Version 2, because of popular demand.
Default values are weekly.
Feel free to try other configurations.
