Simple Moving Average Double HelixThis one is a mix of colour-coded moving averages and Ichimoku. It features two pairs of SMAs--default values of 9/20 and 50/200. Each SMA will be green when it rises and red when it falls. The spaces between each pair will fill with green or red depending on which line is on top. 9 over 20 or 50 over 200 makes a green cloud; if 9 or 50 falls below, the cloud will switch to green.
There's also the Ichimoku lagging span and a 35-period SMA (grey) that can be used as a trailing stop loss guideline.
Ideal long setup:
9, 20, 50, and 200 SMA are all green
both clouds are green
lagging span is above historic price action
Ideal short setup:
9, 20, 50, and 200 SMA are all red
both clouds are red
lagging span is below historic price action
חפש סקריפטים עבור "香港市場主線股票市值小於200億"

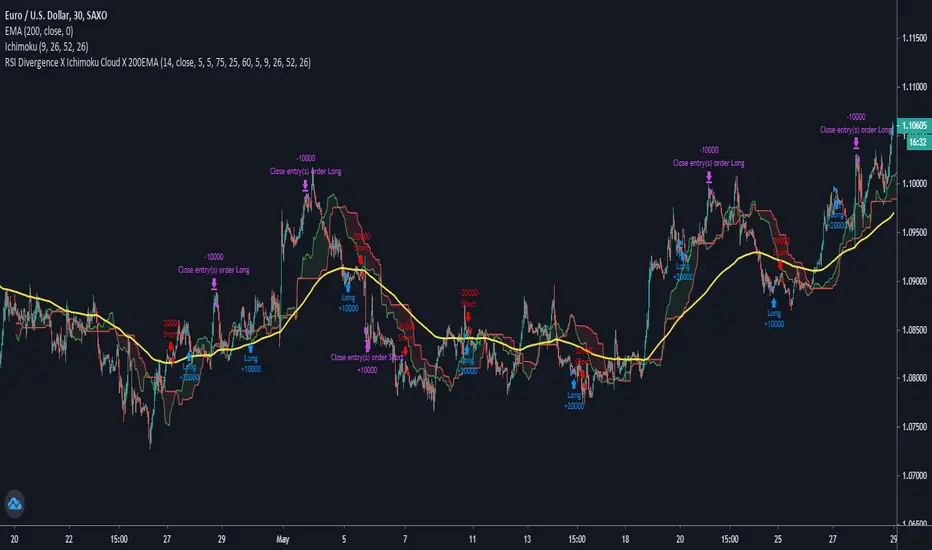
RSI Divergence X Ichimoku Cloud X 200EMAHi all,
This script is a combination of the RSI Divergence Strategy combined with Ichimoku Cloud and 200 EMA .
A long position is entered only when the RSI identifies a bullish divergence (either regular or hidden), and that the Ichimoku Cloud is above the 200 EMA . This is to ensure that there is a confirmation of a bullish trend before an entry.
Similarly, a short position is entered only when the RSI identified a bearish divergence (either regular or hidden), and that the Ichimoku Cloud is below the 200 EMA . This is to ensure that there is a confirmation of a bearish trend before an entry.
I find that this script works best on Intraday charts.
This is just a simple script I built on my third attempt of backtesting strategies on TradingView. Do give it a go and let me know if you guys have any feedback or comments about it. Happy trading!
Ivan_Long_Term_Cloud_BandThis is a combination of the 200 300 400 and 500 long terms weighted moving average.
The color code reflected the current uptrend or downtrend that the market is in by showing light green when 200 WMA is above the 300 WMA as well as showing darker green when 400 WMA is above the 500 WMA. On the other hand, when the 200 WMA is below the 300 WMA and the 400 beneath the 500, the band would be color-coded as light and deep red respectively to reflect the current level of support and resistance level.

BTC and ETH Long strategy - version 1I will start with a small introduction about myself. I'm now trading cryto currencies manually for almost 2 years. I decided to start after watching a documentary on the TV showing people who made big money during the Bitcoin pump which happened at the end of 2017.
The next day, I asked myself "Why should I not give it a try and learn how to trade".
This was in February 2018 and the price of Bitcoin was around 11500USD.
I didn't know how to trade. In fact, I didn't know the trading industry at all.
So, my first step into trading was to open an account with a broken. Then I directly bought 200$ worst of BTC . At that time, I saw the graph and thought "This can only go back in the upward direction!" :)
I didn't know anything about Stop loss, Take profit and Risk management.
Today, almost 2 years after, I think that I know how to trade and can also confirm that I still hold this bag of 200$ of bitcoin from 2018 :)
I did spend the 2 last years to learn technical analysis , risk management and leverage trading.
Today (14/05/2020), I know what I'm doing and I'm happy to see that the 2 last years have been positive in terms of gains. Of course, I did not make crazy money with my saving but at least I made more than if I would have kept it in my bank account.
Even if I like trading, I have a full time job which requires my full energy and lots of focus, so, the biggest problem I had is that I didn't have enough time to look at the charts.
Also, I realized that sometimes, neither technical analysis , nor fundamentals worked with crypto currency (at least for short time trading). So, as I have a developer background I decided to try to have a look at algo trading.
The goal for me was neither to make complex algos nor to beat the market but just to automate my trading with simple bot catching the big waves.
I then started to take a look at TV pine script and played with it.
I did my first LONG script in February 2020 to Long the BTC Market. It has some limitations but works well enough for me for the time being. Even if the real trades will bring me half of what the back testing shows, this will still be a lot more than what I was used to win during the last 2 years with my manual trading.
So, here we are! Below you will find some details about my first LONG script. I'm happy to share it with you.
Feel free to play with it, give your comments and bring improvements to it.
But please note that it only works fine with the candle size and crypto pair that I have mentioned below. If you use other settings this algo might loose money!
- Crypto pairs : XBTUSD and ETHXBT
- Candle size: 2 Hours
- Indicator used: Volatility , MACD (12, 26, 7), SMA (100), SMA (200), EMA (20)
- Default StopLoss: -1.5%
- Entry in position if: Volatility < 2%
AND MACD moving up
AND AME (20) moving up
AND SMA (100) moving up
AND SMA (200) moving up
AND EMA (20) > SAM (100)
AND SMA (100) > SMA (200)
- Exit the postion if: Stoploss is reached
OR EMA (20) crossUnder SMA (100)
Here is a summary of the results for this script:
XBTUSD : 01/01/2019 --> 14/05/2020 = +107%
ETHXBT : 01/01/2019 --> 14/05/2020 = +39%
ETHUSD : 01/01/2019 --> 14/05/2020 = +112%
It is far away from being perfect. There are still plenty of things which can be done to improve it but I just wanted to share it :) .
Enjoy playing with it....

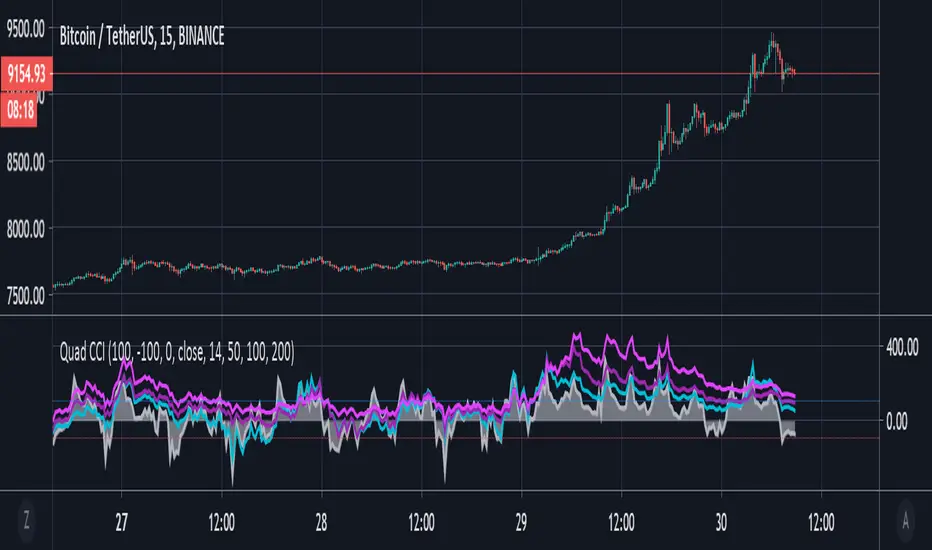
Quad CCI ContainmentThe Quad CCI is a trend identification indicator described by Mark Whistler in his book 'Volatility Illuminated'. The reason for using four separate CCI channels is so that we can:
Prevent ourselves from taking positions against momentum.
Time our trades with short-term 'wrist-rocket' thrust from the larger market momentum.
Clearly determine whether the trend is up, down, or sideways.
In his book, Whistler refers to four CCI channels as 'The Four Horsemen'. The 100 and 200 are like big burly swordsmen, which are hard to budge without significant force. The 50-period CCI is more like the guy who's fast on his feet, but still tough enough to take on the big dudes. And the 14-period is similar to the scout of the party. The fastest of the bunch, but also the first to turn-tail at any sign of danger.
Basically, this means that when we see the 100 and 200-CCI stay above the 0 line, we can infer there really isn't any reason for them to move out of their range. The 50-period CCI will sometimes venture over the 0-line, before the hefty battlers. However, the 14-period will often venture (quickly) way out into the yonder, and he will always return to tell his pals what he's found. Crossing back over the 100-line, traders can take 'rocket trend reentry' positions (usually on the median); however, we still want to keep an eye on the flighty 14-period CCI character. If he crosses back over the +100 or -100 level he was just scouting, it means the larger weighted CCI lines could soon to follow too, as the whole bunch runs from larger momentum on the way.
Traders seeking to take a position 'with the trend' can attempt to purchase pullbacks on the mean if:
Longer-term CCI (at least the 200 and 100) are above zero.
The 50-period CCI is not below -100.
The 14-period travels back up from underneath the -100 area.
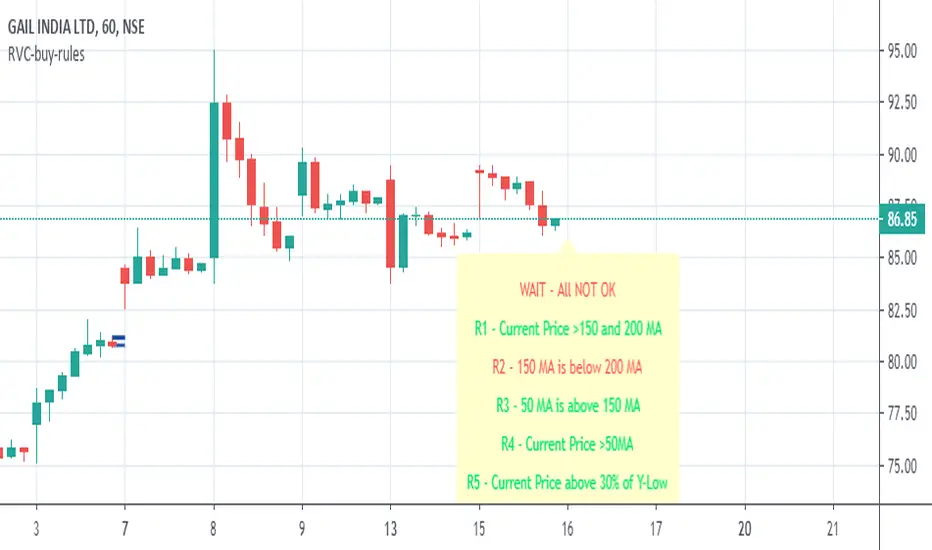
RVC-Buy-rulesTrend Template for short/medium/long term trading. Kindly use this along with other indicators.
Concept is simple "Buy the strength i.e. winners, sell the weakness i.e. losers"
//1. Current Price is above 150 and 200 day avg
//2. 150 day moving avg is more than 200 day avg
//3. 50-day moving avg is above 150-day and 200-day moving average
//4. current price is above 50 day moving average
//5. Current stock price is at-least 30% above 52-week low.
//6. Current stock price is with in 25% of 52-week high
//7. RSI is >60
Kindly modify and use it according to your need.
Incase if this script is found useful, please click on follow/like :)
McGinley Dynamic VWAP/MVWAP [Dayasagar]Mcginley Dynamics and Volume weighted moving average
Timeframe: 1 hour
Use 200 MA
Buy: If the price is above 200 MA, take only the buy signal.
Sell: If the price is below 200 MA, take only the sell signal.

7EMA_5MA (G/D + Bias + 12/26 Signal)This script alow you to survey multiple crossing signals as Golden/Death cross (MA50/200), Institutional Bias (EMA9/18), or EMA 12/26 crossing. You can show/hide all EMAs/MAs and show/hide all signals. Default config displays EMA 50/100/200 and MA 20. Full script includes display of EMA 9/18/12/26/50/100/200 and MA 20/21/50/100/200.

Sequentially Filtered Moving AverageThe previously proposed sequential filter aimed to filter variations lower than a certain period, this allowed to remove noisy variations and retain only the closing price values that occurred after a consecutive up/down, however because of the noisy nature of the closing price large filtering was impossible, in order to tackle to this problem the same indicator using a simple moving average as input is proposed, this allow for smoother results.
We will see that the proposed indicator can provide an alternative moving average that could be used as slow moving average in crossover systems.
The Indicator
The length parameter as the same function as the one described in the sequential filter post, however here length also control the period of the moving average used input, in short larger values of length will return a smoother but less reactive output.
In blue the moving average with length = 200, and in red the moving average with length = 50.
It is interesting to see how the moving average remain flat during ranging/flat market periods
Unfortunately like the sequential filter the sequentially filtered moving average (SFMA) is not affected by large short term variations such as gaps or short term volatile events. This is because of the nature of the sequential filter to ignore movements amplitude and only focus on the variation period.
Moving Average Crossover System
The SFMA is equal to a simple moving average of period length when a consecutive up/down sequence of size length has occurred, else the SFMA is equal to its precedent value, therefore we could expect less crosses between a fast moving average and the SFMA as slow moving average.
We can see on the figure above that the fast moving average of period 50 (in green) cross more with the slow moving average of period 200 (in red) than with the SFMA of period 200 (in blue).
Crosses can occur at the same time as with the classical slow moving average (in red) or a bit later.
Conclusion
A new moving average based on the recently proposed sequential filter has been proposed, it can be seen that under a moving average crossover system the proposed moving average seems to be more effective at producing less crosses without necessarily doing it with an excessive lag, in fact the moving average has either lag (length-1)/2 or lag length .
In the future it could be interesting to provide an hybrid alternative that take into account volatility as well as variations period.
Thanks for reading !

Multicolor Bollinger Bands - Market PhasesHi everyone
Hope you're all doing well 😘
Today I feel gracious and decided to give to the community. And giving not only an indicator but also a trading method
This trading method shows how a convergence based on moving averages is tremendous
Multicolour Bollinger Bands indicator that indicates market phases.
It plots on the price chart, thanks to different color zones between the bands, a breakdown of the different phases that the price operates during a trend.
The different zones are identified as follows:
- red color zone: trend is bearish, price is below the 200 periods moving average
- orange color zone: price operate a technical rebound below the 200 periods moving average
- yellow color zone: (phase 1 which indicate a new bearish cycle)
- light green zone: (phase 2 which indicate a new bullish cycle)
- dark green zone: trend is bullish, price is above the 200 periods moving average
- grey color zone: calm phase of price
- dark blue color zone: price is consolidating in either bullish or bearish trend
- light blue zones: price will revert to a new opposite trend (either long or short new trend)
By identifying clearly the different market phases with the multicolor Bollinger bands, the market entries by either a the beginning of a new trend or just after a rebound or a consolidating phase is easier to spot on.
Trade well and trade safe
Dave

EMA - Baby WhaleThis script will show you the 8, 13, 21, 55, 100 and 200 EMA .
You can change the colors yourself if you want.
You can use the EMA to define the trend.
A good strategy that traders use is a 55 EMA crossover.
This means that when the 8, 13 and 21 all cross the 55 EMA you place a buy or sell order.
You close your position when the same thing happens on the other side.
Another great way that traders use these EMA's is to spot a Golden or Death cross.
When the 55 and 200 EMA cross and the 200 becomes support it means we're in a uptrend and vice versa.
If you want access, just send a message please.
Much love from Baby Whale!!
🙏❤️🐳

BTC 1D Alerts V1This script contains a variety of key indicator for bitcoin all-in-one and they can be activated individually in the menu. These are meant to be used on the 1D chart for Bitcoin.
1457 Day Moving Average: the bottom of the bitcoin price and arguably the rock bottom price target.
Ichimoku Cloud: a common useful indicator for bitcoin support and resistance.
350ma fibs (21 8 5 3 2 and 1.6) : Signify the tops of each logarthmic rise in bitcoin price. They are generally curving higher over the long term. For halvening #3, the predicted market crash would be after hitting the 350ma x3 fib. Also the 350 ma / 111 ma cross signifies bull market top within about 3 days as well. Using the combination of the 350ma fibs and the 350/111 crosses, reasonably identify when market top is about to occur.
50,120,200 ma: Common moving averages that bitcoin retests during bull market runs. Also, the 50/200 golden and death crosses.
1D EMA Superguppy Ribbons: green = bull market, gray is indeterminate, red = bear market. Very high specificity indicator of bull runs, especially for bitcoin. You can change to 3D candle for even more specificity for a bull market start. Use the 1W for even more specificity. 1D Superguppy is recommended for decisionmaking.
1W EMA21: a very good moving average programmed to be shown on both the daily and weekly candle time. Bitcoin commonly corrects to this repeatedly during past bull runs. Acts as support during bull run and resistance during a bear market.
Steps to identifying a bull market:
1. 50/200 golden cross
2. 1D EMA superguppy green
3. 3D EMA superguppy green (if you prefer more certainty than step 2).
4. Hitting the 1W EMA21 and bouncing off during the bull run signifies corrections.
Once a bull market is identified,
Additional recommended buying and selling techniques:
Indicators:
- Fiblines - to determine retracements from peaks (such as all time high or recent highs)
- Stochastic RSI - 1d, 3d, and 1W SRSI are great time to buy, especially the 1W SRSI which comes much less frequently.
- volumen consolidado - for multi exchange volumes compiled into a single line. I prefer buying on the lowest volume days which generally coincide with dips.
- MACD - somewhat dubious utility but many algorithms are programmed to buy or sell based on this.
Check out the Alerts for golden crosses and 350ma Fib crosses which are invaluable for long term buying planning.
I left this open source so that all the formulas can be understood and verified. Much of it hacked together from other sources but all indicators that are fundamental to bitcoin. I apologize in advance for not attributing all the articles and references... but then again I am making no money off of this anyway.

Ultimate Moving Average Package (17 MA's)Included is the:
VWAP
Current time frame 10 EMA
Current time frame 20 EMA
Current time frame 50 EMA
Current time frame 10 SMA
Current time frame 20 SMA
Current time frame 50 SMA
Daily 10 EMA
Daily 20 EMA
Daily 50 EMA
Daily 50 SMA
Daily 100 SMA
Daily 200 SMA
Weekly 100 SMA
Weekly 200 SMA
Monthly 100 SMA
Monthly 200 SMA
All Daily/Weekly/Monthly MA's can be seen on intraday charts. Current time frame MA's change depending on your time frame. Obviously you dont need all 17 on your chart but you can pick the ones you like and disable the rest.

Fischy Bands (multiple periods)Just a quick way to have multiple periods. Coded at (14,50,100,200,400,600,800). Feel free to tweak it. Default is all on, obviously not as usable! Try just using 14, and 50.
This was generated with javascript for easy templating.
Source:
```
const periods = ;
const generate = (period) => {
const template = `
= bandFor(${period})
plot(b${period}, color=colorFor(${period}, b${period}), linewidth=${periods.indexOf(period)+1}, title="BB ${period} Basis", transp=show${period}TransparencyLine)
pb${period}Upper = plot(b${period}Upper, color=colorFor(${period}, b${period}), linewidth=${periods.indexOf(period)+1}, title="BB ${period} Upper", transp=show${period}TransparencyLine)
pb${period}Lower = plot(b${period}Lower, color=colorFor(${period}, b${period}), linewidth=${periods.indexOf(period)+1}, title="BB ${period} Lower", transp=show${period}TransparencyLine)
fill(pb${period}Upper, pb${period}Lower, color=colorFor(${period}, b${period}), transp=show${period}TransparencyFill)`
console.log(template);
}
console.log(`//@version=4
study(shorttitle="Fischy BB", title="Fischy Bands", overlay=true)
stdm = input(1.25, title="stdev")
bandFor(length) =>
src = hlc3
mult = stdm
basis = sma(src, length)
dev = mult * stdev(src, length)
upper = basis + dev
lower = basis - dev
`);
periods.forEach(e => console.log(`show${e} = input(title="Show ${e}?", type=input.bool, defval=true)`));
periods.forEach(e => console.log(`show${e}TransparencyLine = show${e} ? 20 : 100`));
periods.forEach(e => console.log(`show${e}TransparencyFill = show${e} ? 80 : 100`));
console.log('\n');
console.log(`colorFor(period, series) =>
c = period == 14 ? color.white :
period == 50 ? color.aqua :
period == 100 ? color.orange :
period == 200 ? color.purple :
period == 400 ? color.lime :
period == 600 ? color.yellow :
period == 800 ? color.orange :
color.black
c
`);
periods.forEach(e => generate(e))
```

MACD/EMA Long StrategyThis incredibly simple strategy uses a combination of the 20 EMA and bullish/bearish MACD crosses as a low risk method of getting in and out of markets.
Depending on whether the market is above or below the 200 SMA, the script determines if the market is in bullish or bearish territory. Above the 200 SMA, the script will ignore the 20 EMA as a buy condition and buy solely on the confirmation of a bullish MACD cross upon the close of a candle. In this bullish market, the script will only enable the sell condition if both the MACD is bearish AND a close below the 20 EMA occurs. This is to reduce the chances of the script selling prematurely in the event of a bearish MACD cross, if the market is still in overall bullish territory.
When the market is below the 200 SMA, the confirmation occurs in the opposite direction. The buy condition will only be met if both the MACD is bullish AND a close above the 20 EMA occurs. However, the sell condition ignores the 20 EMA and will sell solely on the confirmation of a bearish MACD cross upon the close of the candle.
This strategy can be used in both bullish and bearish markets. This conservative strategy will slightly underperform in a bull market, with the sell condition occasionally being met and then potentially buying back higher. However, it will successfully get you out of a turning market and automatically switch into a more 'risk-off' mentality during a bear market. This strategy is not recommended for sideways markets, as trading around the 20 EMA coupled with a relatively flat MACD profile can cause the strategy to buy the peaks and sell troughs easily.

market phases - JDThis indicator shows the relation of price against different period ma's.
When put in daily Timeframe it gives the 1400 Day (= 200 Weekly) and the 200 ,100 an 50 Daily.
The lines show the 200,100 and 50 ma in relation to the 1400 ma.
JD.
#NotTradingAdvice #DYOR

Trend Lines and MoreMulti-Indicator consisting of several useful indicators in a single package.
TREND LINES
-By default the 20 SMA and 50 SMA are shown.
-Use "MOVING AVERAGE TYPE" to select SMA, EMA, Double-EMA, Triple-EMA, or Hull.
-Use "50 MA TREND COLOR" to have the 50 turn green/red for uptrend/downtrend.
-Use "DAILY SOURCE ONLY" to always show daily averages regardless of timeframe.
-Use "SHOW LONG MA" to also include 100, 150, and 200 moving averages.
-Use "SHOW MARKERS" to show a small colored marker identifying which line is which.
OTHER INDICATORS
-You can show Bollinger Bands and Parabolic SAR.
-You can highlight key reversal times (9:50-10:10 and 14:40-15:00).
-You can show price offset markers, where was the price "n" periods ago.
That last one is useful to show the level of prices which are about to "fall off" the moving average
and be replaced with current price. So for example, if current price is significantly below the
200-days-ago price, you can gauge the difficulty for the 200 MA to start climbing again.

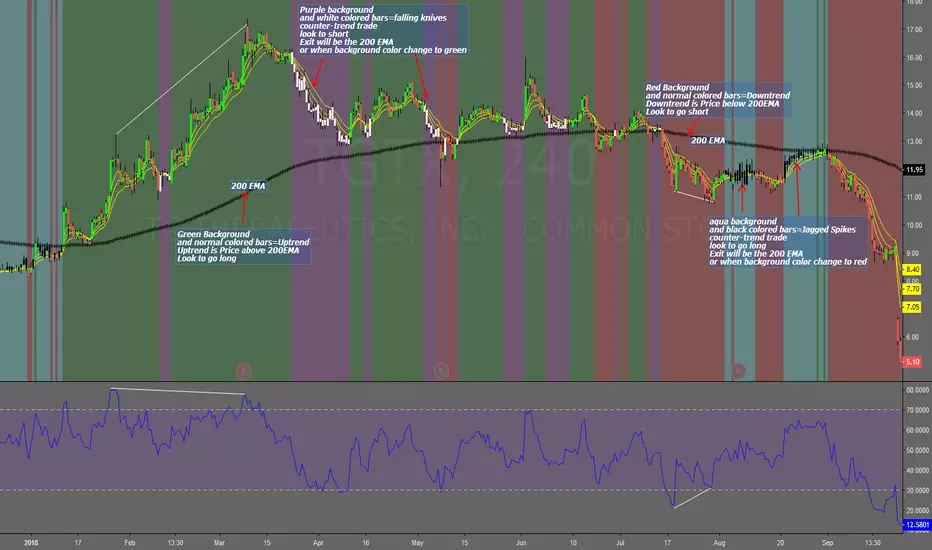
Falling Knives Jagged SpikesThe purpose of this script is to trade with the trend, trade trend continuation, and counter-trend trades.
Uptrend is price above 200 ema: Background is green and the bar colors are normal
Downtrend is price below 200 ema: Background is red and the bar colors are normal
Counter-trend to uptrend--Bar colors are white and the background is purple
counter-trend to downtrend--Bar colors are black and the background is aqua.
How to use:
Uptrend (green background): Only go long
Downtrend (red background): only go short
Counter-trend to uptrend/downtrend (white bars/black bars): Take counter-trend trade when price is a substantial distance from the 200 EMA. Best if there was a divergence with an oscillator. A lot of times these are just deep pullbacks or rallies.
trend continuation: In uptrend, after falling knives, and trend continues up (background turns to green) look to buy, you are getting a great price on the asset. Same for downtrend.
Keep in mind that nothing is perfect, and to of-course test everything.
Best of luck in all you do. Get money.
3 EMAS strategy to define trendsBasic script that allows you to have 3 scripts all in one EMA (exponential moving averages). They are useful to know the general trends of your chart: current long-term trend, short-term (or immediately) and general.
1 ° EMA 36 serves to define or mark action of the market trend price.
At the moment of crossing EMA 36 with EMA 200 upwards it indicates continuation to level 2 ...
2 ° EMA 200 serves as support or resistance according to the case, confirms continuation of trend in medium or long term when crossing with EMA 500, upward trend probability level 3 confirmed. As the case may be, cross up or down.
3 ° EMA 500 serves as support or resistance of the price action.
EMAS 200 and 500 give you a probability of Starting Area ...
Confirming with support or resistance.
Complementation with Stochastics ..
MACD
Note: Remember that "exponential" means that these indicators give more weight to the most recent data, making them more reactive to price changes (react faster to changes in recent prices than simple moving averages)
GROWINGS CRYPTOTRADERS

Mayer Multiple @ Current PriceThough this script is by me, the original idea comes from a podcast I heard where Trace Mayer talks about how he does crypto valuation. It is based on current price against the 200 day moving average. This indicator script will simply plot that value as a label overlayed on your trading view chart. Best long term results occur when acquiring BTC when the multiple is 2.4 or less. For more info, google "mayer multiple" This script/indicator is strictly for educational purposes. It is not exclusive to bitcoin.
To get the best look out of your charts I make the following changes.
1.Apply the indicator to your chart.
2. In the tools palette of trading view, when looking at a chart, click "Show Objects Tree" the icon displayed above the trash can.
In the objects tree panel, click the preferences icon for "Mayer Multiple @ Current Price"
Switch "scale" to "scale Left"
3. Then for your chart preferences (right click on chart background and select "Properties", and be sure the following are checked on the "Scales" tab
Left Axis
Right Axis
Indicator Last Value
Indicator Labels
Screenshots are not allowed in this view, so I can't post screenshots, but the view above is what it should look like when you are done.
For anyone who wants to see the code, here is the code of the script:
Use at will, and at your own risk.
//@version=3
// Created By Timothy Luce, inspired by Trace Mayer's 200 Day SMA cryptocurrency valuation method
study("Mayer Multiple @ Current Price", overlay=true)
currentPrice = close
currentDay = security(tickerid, "D", sma(close, 200))
mayerMultiple = currentPrice/currentDay
plot(mayerMultiple, color=#00ffaa, transp=100)
If you want to change the color, change this line: #00ffaa

Multiple Moving AveragesThis is really simple. But useful for me as I don't have a paid account. No-pro users can only use 3 indicators at once and because I rely heavily on simple moving averages it can be a real pain.
This one indicator features:
20 MA
50 MA
100 MA
200 MA
which I find are the most useful overall. The 20 and 50 over all time frame but in particular < 1 day, the 100 and 200 at > 4 hr time frames. In general I don't use the 100 MA that much. The daily 200 MA is a critical support for many assets like stocks and cryptos. I'm by no means a pro and if you are learning I recommend becoming familiar with moving averages right at the beginning.
If you want to deactivate some of the lines, you can do it via the indicator's settings icon.

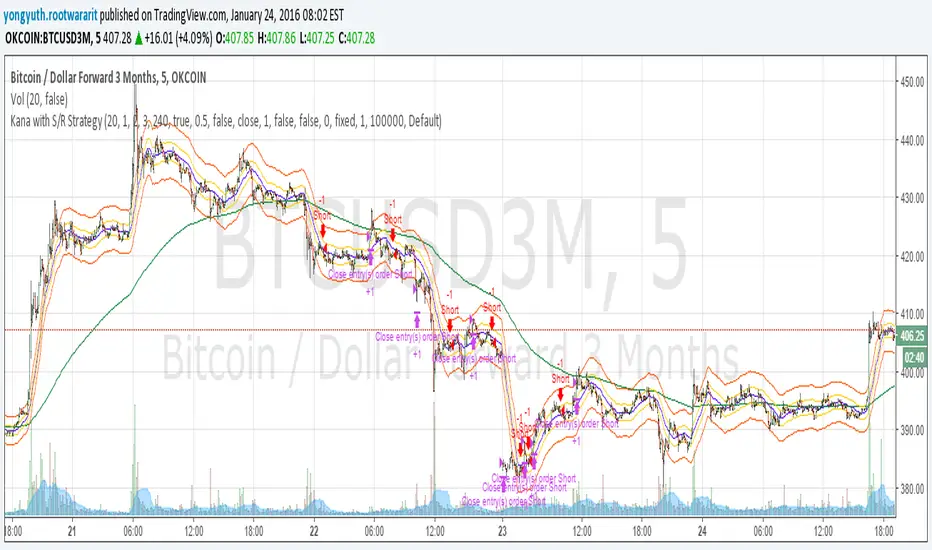
Yuthavithi Kana with S/R StrategyI have got the idea from this page iwongsakorn.com and wrote my own kana scalper. This strategy draws 3 200 ATR level along side with the sma. It uses 200 ema as trend. Once the price approaches the 20 ema. it will place orders according to trend and take profit and stop loss quickly using the 200 ATR lines.
This is a quick scalper strategy with winrate over 50%
HermesHERMES STRATEGY - TRADINGVIEW DESCRIPTION
OVERVIEW
Hermes is an adaptive trend-following strategy that uses dual ALMA (Arnaud Legoux Moving Average) filters to identify high-quality entry and exit points. It's designed for swing and position traders who want smooth, low-lag signals with minimal whipsaws.
Unlike traditional moving averages that operate on price, Hermes analyzes price returns (percentage changes) to create signals that work consistently across any asset class and price range.
HOW IT WORKS
DUAL ALMA SYSTEM
The strategy uses two ALMA lines applied to price returns:
• Fast ALMA (Blue Line): Short-term trend signal (default: 80 periods)
• Slow ALMA (Black Line): Long-term baseline trend (default: 250 periods)
ALMA is superior to simple or exponential moving averages because it provides:
• Smoother curves with less noise
• Significantly reduced lag
• Natural resistance to outliers and flash crashes
TRADING LOGIC
BUY SIGNAL:
• Fast ALMA crosses above Slow ALMA (bullish regime)
• Price makes new N-bar high (momentum confirmation)
• Optional: Price above 200 EMA (macro trend filter)
• Optional: ALMA lines sufficiently separated (strength filter)
SELL SIGNAL:
• Fast ALMA crosses below Slow ALMA (bearish regime)
• Optional: Price makes new N-bar low (momentum confirmation)
The strategy stays in position during the entire bullish regime, allowing you to ride trends for weeks or months.
VISUAL INDICATORS
LINES:
• Blue Line: Fast ALMA (short-term signal)
• Black Line: Slow ALMA (long-term baseline)
TRADE MARKERS:
• Green Triangle Up: Buy executed
• Red Triangle Down: Sell executed
• Orange "M": Buy blocked by momentum filter
• Purple "W": Buy blocked by weak crossover strength
KEY PARAMETERS
ALMA SETTINGS:
• Short Period (default: 30) - Fast signal responsiveness
• Long Period (default: 250) - Baseline stability
• ALMA Offset (default: 0.90) - Balance between lag and smoothness
• ALMA Sigma (default: 7.5) - Gaussian curve width
ENTRY/EXIT FILTERS:
• Buy Lookback (default: 7) - Bars for momentum confirmation (required)
• Sell Lookback (default: 0) - Exit momentum bars (0 = disabled for faster exits)
• Min Crossover Strength (default: 0.0) - Required ALMA separation (0 = disabled)
• Use Macro Filter (default: true) - Only enter above 200 EMA
BEST PRACTICES
RECOMMENDED ASSETS - Works well on:
• Cryptocurrencies (Bitcoin, Ethereum, etc.)
• Major indices (S&P 500, Nasdaq)
• Large-cap stocks
• Commodities (Gold, Oil)
RECOMMENDED TIMEFRAMES:
• Daily: Primary timeframe for swing trading
• 4-Hour: More active trading (increase trade frequency)
• Weekly: Long-term position trading
PARAMETER TUNING:
• More trades: Lower Short Period (60-80)
• Fewer trades: Raise Short Period (100-120)
• Faster exits: Set Sell Lookback = 0
• Safer entries: Enable Macro Filter (Use Macro Filter = true)
STRATEGY ADVANTAGES
1. Low Lag - ALMA provides faster signals than traditional moving averages
2. Smooth Signals - Minimal whipsaws compared to crossover strategies
3. Asset Agnostic - Same parameters work across different markets
4. Trend Capture - Stays positioned during entire bullish regimes
5. Risk Management - Multiple filters prevent poor entries
6. Visual Clarity - Easy to interpret regime and filter states
WHEN TO USE HERMES
BEST FOR:
• Trending markets (crypto bull runs, equity uptrends)
• Swing trading (hold days to weeks)
• Position trading (hold weeks to months)
• Clear trend identification
• Risk-managed exposure
NOT SUITABLE FOR:
• Ranging/sideways markets
• Scalping or day trading
• High-frequency trading
• Mean reversion strategies
RISK DISCLAIMER
This indicator is for educational purposes only. Past performance does not guarantee future results. Always use proper position sizing and risk management. Test thoroughly on historical data before live trading.
CREDITS
Inspired by Giovanni Santostasi's Power Law Volatility Indicator, generalized for universal application across all assets using adaptive ALMA filtering.
Strategy by Hermes Trading Systems
QUICK START
1. Add indicator to chart
2. Use on daily timeframe for best results
3. Look for green buy signals when blue line crosses above black line
4. Exit on red sell signals when blue line crosses below black line
5. Adjust parameters based on your trading style:
• Conservative: Enable Macro Filter, increase Buy Lookback to 10
• Aggressive: Disable Macro Filter, lower Short Period to 60
• Default settings work well for most assets
