ZenAlgo - Aggregated DeltaZenAlgo - Aggregated Delta is an advanced market analysis tool designed to provide traders with a holistic view of market sentiment by leveraging multi-exchange volume aggregation, cumulative delta analysis, and divergence detection. Unlike traditional indicators that rely on a single data source, this tool aggregates order flow data from multiple exchanges, reducing the impact of exchange-specific anomalies and liquidity disparities.
This indicator is ideal for traders looking to enhance their understanding of market dynamics, trend confirmations, and order flow patterns. By intelligently combining multiple analytical components, it eliminates the need for manually interpreting separate indicators and offers traders a streamlined approach to market analysis.
This indicator was inspired by aggregated volume analysis techniques. Independently developed with a focus on cumulative delta and divergence detection.
Key Features & Their Interaction
Multi-Exchange Volume Aggregation: Aggregates buy and sell volumes from up to nine major exchanges, including Binance, Bybit, Coinbase, and Kraken. Unlike traditional single-source indicators, this ensures a robust, diversified measure of market sentiment and smooths out exchange-specific volume fluctuations.
Cumulative Delta Analysis: Tracks the net difference between buy and sell volumes across all aggregated exchanges, helping traders identify true buying/selling pressure rather than misleading short-term volume spikes.
Advanced Divergence Detection: Unlike basic divergence indicators, this tool detects divergences not only between price and cumulative delta but also across multiple analytical layers, including moving averages and temperature zones, offering deeper confirmation signals.
Dynamic Market Temperature Zones: Unlike fixed overbought/oversold indicators, this feature applies adaptive standard deviation-based filtering to classify market conditions dynamically as "Extreme Hot," "Hot," "Neutral," "Cold," and "Extreme Cold."
Intelligent Market State Classification: Determines whether the market is in a Full Bull, Bearish, or Neutral state by analyzing multi-exchange volume flow, cumulative delta positioning, and market-wide liquidity trends.
Real-Time Alerts & Adaptive Visualization: Provides fully configurable real-time alerts for trend shifts, divergences, and market conditions, allowing traders to act immediately on high-confidence signals.
What Makes ZenAlgo - Aggregated Delta Unique?
Unlike free or open-source alternatives, ZenAlgo - Aggregated Delta applies a multi-layered data processing approach to smooth inconsistencies and improve signal reliability. Instead of using raw exchange feeds, the system incorporates adaptive volume aggregation and standard deviation-based market classification to ensure accuracy and reduce noise. These enhancements lead to more precise trend signals and a clearer representation of market sentiment.
Multi-Exchange Order Flow Validation: Unlike single-source indicators that rely on individual exchange feeds, this tool ensures cross-market consistency by aggregating volume data dynamically.
Fractal-Based Divergence Detection: Detects divergences using fractal logic rather than contextual volume trends, reducing false-positive divergence signals while maintaining accuracy.
Automated Sentiment Analysis: Classifies market sentiment into structured phases (Full Bull, Bearish, etc.), reducing the manual effort needed to interpret order flow trends.
How It Works (Technical Breakdown)
Multi-Exchange Volume Aggregation: The system fetches and validates buy/sell volume data from multiple exchanges, applying volume aggregation techniques to smooth out inconsistencies. It ensures that data from low-liquidity exchanges does not disproportionately influence the analysis.
Cumulative Delta Computation: Cumulative delta is computed as the net difference between buy and sell volumes over a given period. By summing up these values across multiple exchanges, traders can identify real accumulation or distribution zones, reducing false signals from isolated exchange anomalies.
Divergence Detection Methodology: The tool uses a fractal-based logic approach to detect high-confidence divergences across price, volume, and delta trends. This allows for a more structured detection process compared to simple peak/trough analysis, reducing noise in the signals.
Temperature Zones Filtering: Market conditions are dynamically classified using a rolling standard deviation model, ensuring that hot/cold states adjust automatically based on recent volatility levels. This means that instead of using arbitrary fixed thresholds, the tool adapts based on historical data behavior.
Market Sentiment State Calculation: The tool evaluates liquidity conditions, volume trends, and cumulative delta flow, categorizing the market into predefined states (Bullish, Bearish, Neutral). This helps traders assess the broader context of price movements rather than reacting to isolated signals.
Real-Time Adaptive Alerts: The system provides fully configurable alerts that notify traders about key trend shifts, high-confidence divergences, and changes in market conditions as they occur. This ensures that traders can make timely and well-informed decisions.
Why This Approach Works
By aggregating data from multiple exchanges, it reduces the impact of exchange-specific liquidity disparities and anomalies, leading to a more holistic view of order flow.
The cumulative delta analysis ensures that price movements are validated by actual buying/selling pressure, filtering out misleading short-term spikes.
Dynamic market classification adapts to current conditions rather than using outdated fixed thresholds, making it more relevant in different market regimes.
Fractal-based divergence detection avoids common pitfalls of traditional divergence analysis, reducing false signals while maintaining accuracy.
Combining real-time adaptive alerts with well-structured classification improves traders’ ability to respond to market shifts efficiently.
Practical Use Cases
Identifying High-Probability Trend Reversals: If cumulative delta shows bullish divergence while the market is in an Extreme Cold zone, it signals a strong potential for reversal.
Confirming Trend Continuation: When bullish moving average crossovers align with a rising cumulative delta, traders can enter positions with higher confidence.
Detecting Exhaustion in Market Moves: If price enters an "Extreme Hot" zone but cumulative delta starts declining, this suggests trend exhaustion and a possible reversal.
Filtering False Breakouts: If price breaks a resistance level but aggregated buy volume fails to increase, this invalidates the breakout, helping traders avoid bad trades.
Cross-Exchange Sentiment Confirmation: If cumulative delta on aggregated exchanges contradicts price action on an individual exchange, traders can identify localized exchange-based distortions.
Customization & Settings Overview
Exchange Selection: Traders can fine-tune exchange sources for aggregation, allowing for custom market-specific insights.
Adaptive Divergence Settings: Configure detection thresholds, lookback periods, and divergence filtering options to reduce noise and focus on high-confidence signals.
Moving Average Adjustments: Select custom MA types, lengths, and visualization preferences to match different trading styles.
Market Temperature Thresholds: Adjust hot/cold sensitivity to align with preferred risk levels and volatility expectations.
Configurable Alerts & Theme Customization: Full control over notification triggers, color themes, and label formatting to enhance user experience.
Important Considerations
Market Context Dependency: This tool provides order flow analysis, which should be used in conjunction with broader market context and risk management.
Data Source Variability: While multi-exchange aggregation improves reliability, some exchanges may report inaccurate or delayed data.
Extreme Volatility Handling: Large price swings can temporarily distort delta readings, so traders should always validate with additional context.
Liquidity Limitations: In low-liquidity conditions, order flow signals may be less reliable due to fragmented market participation.
Signals

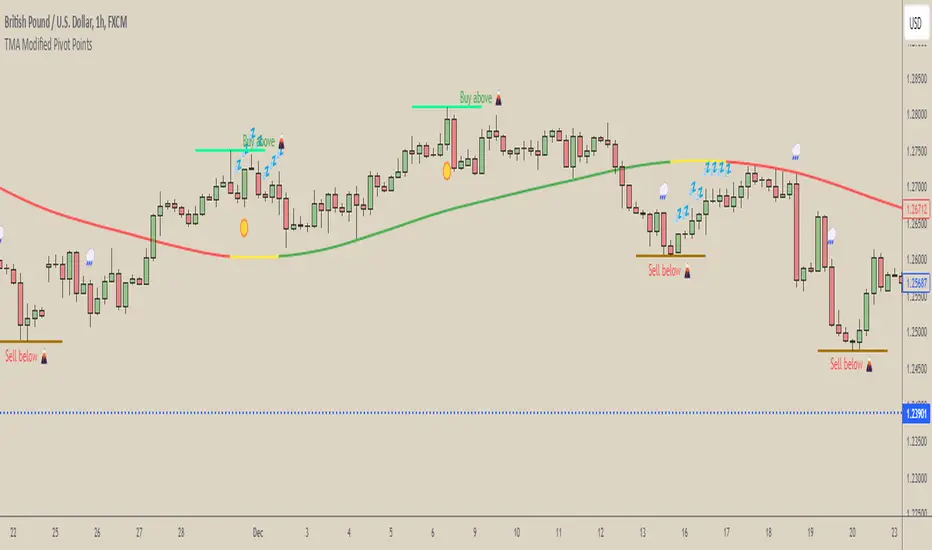
[COG] WeatherForecaster🌤️ Just like a weather forecast that adjusts as new data emerges, this TMA Pivot Points Forecaster adapts to evolving market conditions!
Description:
This indicator combines the power of a Triple Moving Average (TMA) with pivot point analysis to identify potential market turning points and trend directions. Like a meteorologist using various atmospheric data to predict weather patterns, this tool analyzes price action through multiple lenses to forecast potential market movements.
Key Features:
- Dynamic TMA Line: Acts as our "atmospheric pressure system," showing the underlying market direction
- Adaptive Pivot Points: Like weather stations, these pivots identify key market levels where the "climate" might change
- Smart Entry Signals: ☀️ and 🌧️ icons appear when conditions align for potential trades
- Timeframe-Adaptive: Automatically adjusts sensitivity across different timeframes
- Customizable Visuals: Adjust colors and styles to match your trading environment
Settings Include:
✓ TMA Length and Slope Sensitivity
✓ Pivot Point Parameters
✓ Visual Customization Options
✓ Toggle Entry Signals
✓ Toggle Pivot Lines
Note: Like weather forecasts that update with new data, this indicator recalculates as market conditions evolve. Past signals may adjust as more price action develops. Always use proper risk management and combine with other analysis tools.
Usage Guide:
The indicator works best when used as part of a complete trading system. Here's how to interpret the signals:
📈 Bullish Conditions:
- TMA Line turns green: Indicates upward momentum
- "Buy above 🌋" level appears: Potential resistance turned support level
- ☀️ Signal: Indicates favorable buying conditions
📉 Bearish Conditions:
- TMA Line turns red: Indicates downward momentum
- "Sell below 🌋" level appears: Potential support turned resistance level
- 🌧️ Signal: Indicates favorable selling conditions
⏺️ Ranging Conditions:
- TMA Line turns yellow: Market in consolidation
- 💤 Signal: Suggests waiting for clearer direction
Best Practices:
1. Higher timeframes (4H, Daily) tend to produce more reliable signals
2. Use the pivot lines as potential entry/exit reference points
3. Adjust the TMA length based on your trading style:
• Shorter lengths (20-30) for more active trading
• Longer lengths (50-60) for trend following
Settings Explained:
TMA Settings:
- TMA Length: Determines the smoothing period (default: 30)
- Slope Threshold: Controls trend sensitivity (default: 0.015)
Pivot Settings:
- Left/Right Bars: Controls pivot point calculation
- Line Length: Adjusts the visual length of pivot lines
- Line Style & Colors: Customize the visual appearance
Disclaimer:
Past performance does not guarantee future results. This indicator, like any technical tool, provides possibilities rather than certainties. Please test thoroughly on your preferred timeframes and markets before using with real capital.
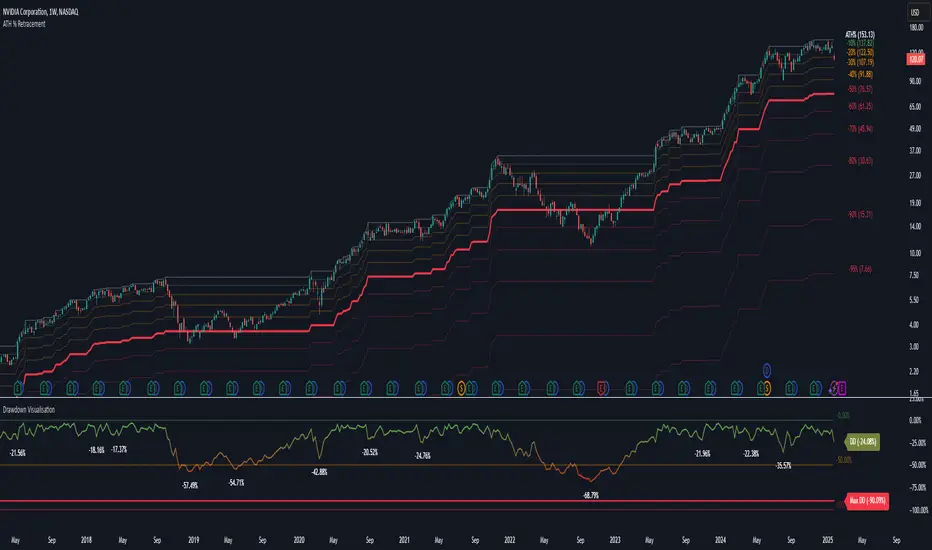
Drawdown Visualisation█ OVERVIEW
The Drawdown Visualisation indicator calculates and displays the instrument’s drawdown (in percent) relative to its all‐time high (ATH) from a user‐defined start date. It provides customisable options for label appearance, threshold lines (0%, –50%, –100%), and can plot historic drawdown levels via pivot detection.
█ USAGE
This indicator should be used with the Percentage Retracement from ATH indicator.
█ KEY FEATURES
Custom Date Settings — Use a custom start date so that only specified price action is considered.
Retracement Level Calculation — Determines ATH and computes multiple retracement levels using percentages from 0% to –100%.
Visual Signals and Customisation — Plots configurable horizontal lines and labels that display retracement percentages and prices.
Time Filtering — Bases calculations on data from the desired time period.
Historic Drawdowns — Display historical drawdowns
█ PURPOSE
Assist traders in visualising the depth of price retracements from recent or historical peaks.
Identify critical zones where the market may find support or resistance after reaching an ATH.
Facilitate more informed entry and exit decisions by clearly demarcating retracement levels on the chart.
█ IDEAL USERS
Swing Traders — Looking to exploit pullbacks following strong upward moves.
Technical Analysts — Interested in pinpointing key retracement levels as potential reversal or continuation points.
Price Action Traders — Focused on the nuances of market peaks and subsequent corrections.
Strategy Developers — Keen to backtest and refine approaches centred on retracement dynamics.
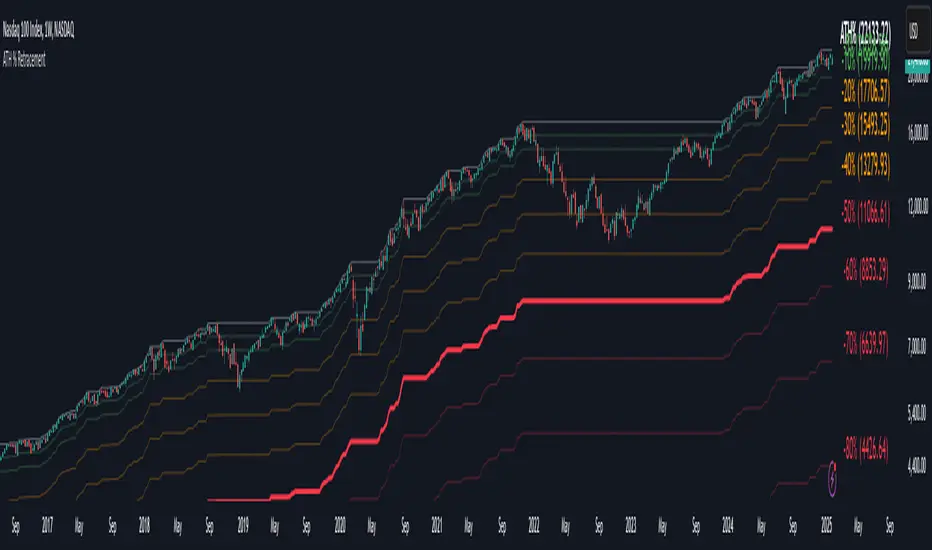
Percentage Retracement from ATH█ OVERVIEW
The Percentage Retracement from ATH indicator is a dynamic trading utility designed to help traders gauge market pullbacks from the peak price. By calculating key retracement levels based on the All-Time High (ATH) and user‑defined percentage inputs, it offers clear visual cues to assist in identifying potential support and resistance zones.
█ KEY FEATURES
Custom Date — Use a custom start date so the indicator only considers specified price action.
Retracement Calculation — Determines ATH and calculates levels based on user‑defined percentages (0% to –100%).
Visual Customisation — Plots configurable horizontal lines and labels showing retracement percentages and prices.
Time Filtering — Uses time filtering to base levels on the desired data period.
█ PURPOSE
Assist traders in visualising the depth of price retracements from recent or historical peaks.
Identify critical zones where the market may find support or resistance after reaching an ATH.
Facilitate more informed entry and exit decisions by clearly demarcating retracement levels on the chart.
█ IDEAL USERS
Swing Traders — Looking to exploit pullbacks following strong upward moves.
Technical Analysts — Interested in pinpointing key retracement levels as potential reversal or continuation points.
Price Action Traders — Focused on the nuances of market peaks and subsequent corrections.
Strategy Developers — Keen to backtest and refine approaches centred on retracement dynamics.
Triple Trend Indicator [BigBeluga]Triple Trend Indicator is a versatile trend-following tool designed to help traders identify trend strength and potential pullback levels using a three-band system. Each band represents a varying degree of price deviation from the mean, providing progressively stronger trend signals.
🔵 Key Features:
Three Adaptive Bands:
The indicator dynamically calculates three bands (1, 2, and 3) based on moving averages (SMA, EMA, WMA) and ATR multipliers.
Bands are positioned below the price in an uptrend and above the price in a downtrend, offering clear trend direction visualization.
Signal System:
Signals are generated when price interacts with the bands:
Signal 1: Triggered when the price touches Band 1, indicating a minor pullback within the trend.
Signal 2: Triggered at Band 2, showing a stronger price deviation and trend confirmation.
Signal 3: Triggered at Band 3, representing the most significant price deviation and strongest trend signal.
The further the price deviates from the mean, the stronger the trend signal, with Signal 3 being the most robust.
Color-Coded Bands:
Bands dynamically change color based on the trend direction:
Green bands signify an uptrend.
Brown bands signify a downtrend.
Dynamic Trend Line Changes:
Dashed lines highlight trend changes, helping traders visualize key turning points in the market.
🔵 Usage:
Use the bands to identify trend direction and strength.
Monitor the signal system to assess the level of price deviation and potential pullback strength.
Combine Signal 1, 2, and 3 to confirm trend momentum:
Signal 1 suggests a weaker pullback and continuation.
Signal 2 indicates a stronger trend confirmation.
Signal 3 highlights the strongest momentum and potential exhaustion points.
Utilize the color-coded bands for an intuitive understanding of current market conditions.
The Triple Trend Indicator is an ideal tool for trend traders looking for structured signals and dynamic support and resistance levels to optimize entries and exits.

VWAP Bands with ML [CryptoSea]VWAP Machine Learning Bands is an advanced indicator designed to enhance trading analysis by integrating VWAP with a machine learning-inspired adaptive smoothing approach. This tool helps traders identify trend-based support and resistance zones, predict potential price movements, and generate dynamic trade signals.
Key Features
Adaptive ML VWAP Calculation: Uses a dynamically adjusted SMA-based VWAP model with volatility sensitivity for improved trend analysis.
Forecasting Mechanism: The 'Forecast' parameter shifts the ML output forward, providing predictive insights into potential price movements.
Volatility-Based Band Adjustments: The 'Sigma' parameter fine-tunes the impact of volatility on ML smoothing, adapting to market conditions.
Multi-Tier Standard Deviation Bands: Includes two levels of bands to define potential breakout or mean-reversion zones.
Dynamic Trend-Based Colouring: The VWAP and ML lines change colour based on their relative positions, visually indicating bullish and bearish conditions.
Custom Signal Detection Modes: Allows traders to choose between signals from Band 1, Band 2, or both, for more tailored trade setups.
In the image below, you can see an example of the bands on higher timeframe showing good mean reversion signal opportunities, these tend to work better in ranging markets rather than strong trending ones.
How It Works
VWAP & ML Integration: The script computes VWAP and applies a machine learning-inspired adjustment using SMA smoothing and volatility-based adaptation.
Forecasting Impact: The 'Forecast' setting shifts the ML output forward in time, allowing for anticipatory trend analysis.
Volatility Scaling (Sigma): Adjusts the ML smoothing sensitivity based on market volatility, providing more responsive or stable trend lines.
Trend Confirmation via Colouring: The VWAP line dynamically switches colour depending on whether it is above or below the ML output.
Multi-Level Band Analysis: Two standard deviation-based bands provide a framework for identifying breakouts, trend reversals, or continuation patterns.
In the example below, we can see some of the most reliable signals where we have mean reversion signals from the band whilst the price is also pulling back into the VWAP, these signals have the additional confluence which can give you a higher probabilty move.
Alerts
Bullish Signal Band 1: Alerts when the price crosses above the lower ML Band 1.
Bearish Signal Band 1: Alerts when the price crosses below the upper ML Band 1.
Bullish Signal Band 2: Alerts when the price crosses above the lower ML Band 2.
Bearish Signal Band 2: Alerts when the price crosses below the upper ML Band 2.
Filtered Bullish Signal: Alerts when a bullish signal is triggered based on the selected signal detection mode.
Filtered Bearish Signal: Alerts when a bearish signal is triggered based on the selected signal detection mode.
Application
Trend & Momentum Analysis: Helps traders identify key market trends and potential momentum shifts.
Dynamic Support & Resistance: Standard deviation bands serve as adaptive price zones for potential breakouts or reversals.
Enhanced Trade Signal Confirmation: The integration of ML smoothing with VWAP provides clearer entry and exit signals.
Customizable Risk Management: Allows users to adjust parameters for fine-tuned signal detection, aligning with their trading strategy.
The VWAP Machine Learning Bands indicator offers traders an innovative tool to improve market entries, recognize potential reversals, and enhance trend analysis with intelligent data-driven signals.

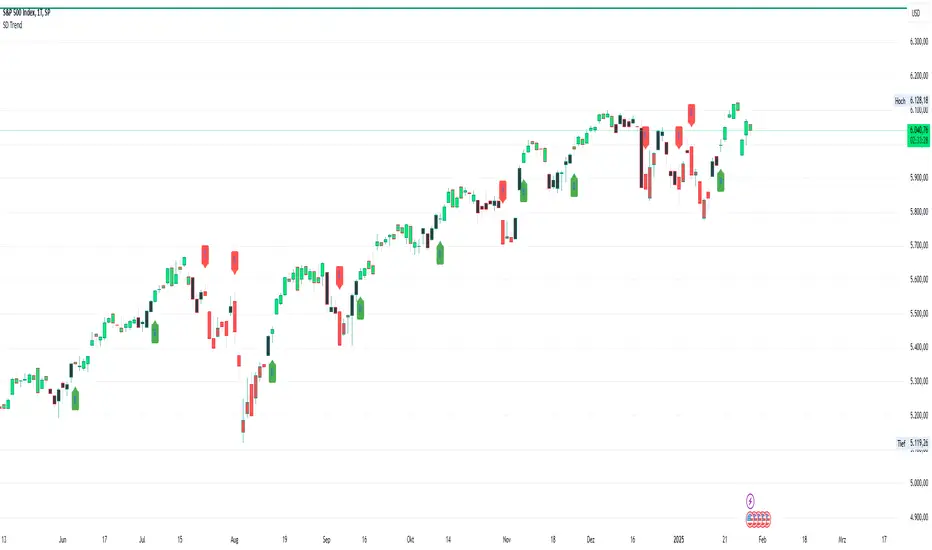
SD Trend with SignalsSD Trend Indicator
The SD Trend Indicator is a trend-following tool designed to help traders identify potential buy and sell signals based on a combination of technical indicators: MACD, RSI, and Stochastic Oscillator. It visually enhances price action by color-coding candles and plotting signals when a trend shift occurs.
How It Works:
MACD (12, 26, 9): Measures momentum and trend direction.
RSI (7): Identifies overbought and oversold conditions.
Stochastic Oscillator (14, 3, 3): Confirms trend strength and reversals.
Candle Color Coding:
Green → Bullish (Buy Condition)
Red → Bearish (Sell Condition)
Black → Neutral (No Trade)
Signal Generation:
A Buy Signal (B) is plotted below the first green candle after a neutral (black) phase.
A Sell Signal (S) is plotted above the first red candle after a neutral (black) phase.
This helps traders capture early trend reversals with clear visual confirmation.
Key Features:
✔️ Trend Confirmation using three proven indicators.
✔️ Clear Candle Coloring for easy trend visualization.
✔️ Buy/Sell Labels (B/S) for quick decision-making.
✔️ Works on any timeframe and asset class (stocks, forex, crypto, etc.).
This indicator is ideal for traders looking to follow trends, identify potential reversals, and improve entry/exit timing with a systematic approach
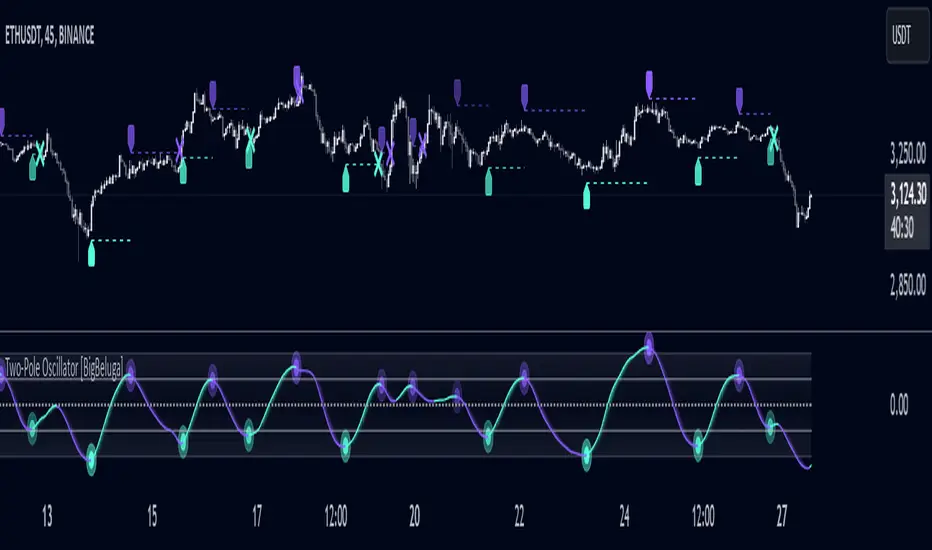
Two-Pole Oscillator [BigBeluga]
The Two-Pole Oscillator is an advanced smoothing oscillator designed to provide traders with precise market signals by leveraging deviation-based calculations combined with a unique two-pole filtering technique. It offers clear visual representation and actionable signals for smart trading decisions.
🔵Key Features:
Two-Pole Filtering: Smooths out the main oscillator signal to reduce noise, providing a cleaner and more reliable view of market momentum and trend strength.
// Two-pole smooth filter function
f_two_pole_filter(source, length) =>
var float smooth1 = na
var float smooth2 = na
alpha = 2.0 / (length + 1)
if na(smooth1)
smooth1 := source
else
smooth1 := (1 - alpha) * smooth1 + alpha * source
if na(smooth2)
smooth2 := smooth1
else
smooth2 := (1 - alpha) * smooth2 + alpha * smooth1
Deviation-Based Oscillator: Utilizes price deviations from the mean to generate dynamic signals, making it ideal for detecting overbought and oversold conditions.
float sma1 = ta.sma(close, 25)
float sma_n1 = ((close - sma1) - ta.sma(close - sma1, 25)) / ta.stdev(close - sma1, 25)
Signal Gradient Strength: Signals on the main oscillator line feature gradient coloring based on their proximity to the 0 level:
➔ Closer to 0: More transparent, indicating weaker signals.
➔ Closer to 1 or -1: Less transparent, highlighting stronger signals.
Level-Based Signal Validation: Parallel levels are plotted on the chart for each signal:
➔ If a level is crossed by price, the signal is invalidated, marked by an "X" at the invalidation point.
Trend Continuation
Invalidation Levels: Serve as potential stop-loss or trade-reversal zones, enabling traders to make more informed and disciplined trading decisions.
Dynamic Chart Plotting: Signals are plotted directly on the chart with corresponding levels, providing a comprehensive visual representation for easy interpretation.
🔵How It Works:
The oscillator calculates price deviation from a mean value and applies two-pole filtering to smooth the resulting signal.
Gradient-colored signals reflect their strength, with transparency indicating proximity to the 0 level on the oscillator scale.
Buy and sell signals are generated based on crossovers and crossunders of the oscillator line with a signal line.
If a level is crossed, the corresponding signal is marked with a "X" plotted on the chart at the crossover point.
🔵Use Cases:
Detecting overbought or oversold market conditions with a smoother, noise-free oscillator.
Using invalidation levels to set clear stop-loss or trade exit points.
Identifying strong momentum signals and filtering out weaker, less reliable ones.
Combining oscillator signals with price action for more precise trade entries and exits.
This indicator is perfect for traders seeking a refined approach to oscillator analysis, combining signal strength visualization with actionable invalidation levels to enhance trading precision and strategy.
Monthly DividerThis Trading View indicator visually marks the beginning of each month starting from January 2024. It draws vertical lines on the chart at the start of each month and labels them with the corresponding month abbreviation (e.g., "Jan", "Feb"). Users can customize the color and thickness of the lines through the indicator settings, allowing for personalized chart aesthetics. This tool is ideal for traders and analysts who want to easily identify month transitions and enhance their technical analysis.

TVMC - Composite Indicator with Technical RatingsDescription:
The TVMC (Trend, Volume, Momentum, Composite) indicator is a powerful multi-component tool designed to provide traders with a comprehensive understanding of market conditions. By combining four essential technical analysis components—trend, momentum, volume, and volatility—this indicator offers clear and actionable insights to assist in decision-making.
Key Features:
1. Trend Component (TC):
* Based on MACD (Moving Average Convergence Divergence), this component analyzes the relationship between two exponential moving averages (fast and slow) to determine the prevailing market trend.
* The MACD signal is normalized to a range of -1 to +1 for consistency and clarity.
2. Momentum Component (MC):
* Utilizes RSI (Relative Strength Index) to measure the strength and speed of price movements.
* This component highlights overbought or oversold conditions, which may indicate potential market reversals.
3. Volume Confirmation (VC):
* Compares the current trading volume to its moving average over a specified period.
* High volume relative to the average confirms the validity of the current trend.
4. Volatility Filter (VF):
* Uses ATR (Average True Range) to gauge market volatility.
* Adjusts and smooths signals to reduce noise during periods of high volatility.
5. Technical Ratings Integration:
* Incorporates TradingView’s Technical Ratings, allowing users to validate signals using moving averages, oscillators, or a combination of both.
* Users can choose their preferred source of ratings for enhanced signal confirmation.
How It Works:
The TVMC indicator combines the weighted contributions of the Trend, Momentum, and Volume components, further refined by the Volatility Filter. Each component plays a specific role:
* Trend: Identifies whether the market is bullish, bearish, or neutral.
* Momentum: Highlights the strength of price action.
* Volume: Confirms whether the current price action is supported by sufficient trading activity.
* Volatility: Filters out excessive noise in volatile market conditions, providing a smoother and more reliable output.
Visualization:
1. Bullish Signals:
* The indicator line turns green and remains above the zero line, indicating upward momentum.
2. Bearish Signals:
* The indicator line turns red and falls below the zero line, signaling downward momentum.
3. Neutral Signals:
* The line is orange and stays near zero, indicating a lack of strong trend or momentum.
4. Zones:
* Horizontal lines at +30 and -30 mark strong bullish and bearish zones, respectively.
* A zero line is included for clear separation between bullish and bearish signals.
Recommended Usage:
* Best Timeframes: The indicator is optimized for higher timeframes such as 4-hour (H4) and daily (D1) charts.
* Trading Style: Suitable for swing and positional trading.
* Customization: The indicator allows users to adjust all major parameters (e.g., MACD, RSI, volume, and ATR settings) to fit their trading preferences.
Customization Options:
* Adjustable weights for Trend, Momentum, and Volume components.
* Fully configurable settings for MACD, RSI, Volume SMA, and ATR periods.
* Timeframe selection for multi-timeframe analysis.
Important Notes:
1. Originality: The TVMC indicator combines multiple analysis methods into a unique framework. It does not replicate or minimally modify existing indicators.
2. Transparency: The description is detailed enough for users to understand the methodology without requiring access to the code.
3. Clarity: The indicator is explained in a way that is accessible even to users unfamiliar with complex technical analysis tools.
Compliance with TradingView Rules:
* The indicator is written in Pine Script version 5, adhering to TradingView’s language standards.
* The description is written in English to ensure accessibility to the global community, with a clear explanation of all components and functionality.
* No promotional content, links, or unrelated references are included.
* The chart accompanying the indicator is clean and demonstrates its intended use clearly, with no additional indicators unless explicitly explained.

Fibonacci Extension Strt StrategyCore Logic and Steps:
Weekly Trend Identification:
Find the last significant Higher High (HH) and Lower Low (LL) or vice-versa on the Weekly timeframe.
Determine if it's an uptrend (HH followed by LL) or a downtrend (LL followed by HH).
Plot a Fibonacci Extension (or Retracement in reverse order) from the swing point determined to the other significant swing point.
Weekly Retracement Levels:
Display horizontal lines at the 0.236, 0.382, and 0.5 Fibonacci levels from the weekly extension.
Monitor price action on these levels.
Daily Confirmation:
When price hits the Fib levels, examine the Daily chart.
Look for a rejection wick (indicating the pull back is ending) on the identified weekly retracement levels.
Confirm that the price is indeed starting to continue in the direction of the original weekly trend.
Four-Hour Entry:
On the 4H timeframe, plot a new Fib Extension in the opposite direction of the weekly.
If it's an uptrend, the Fib is plotted from last swing low to its swing high. If the weekly trend was bearish the Fib will be plotted from last swing high to the swing low.
Generate an entry when price breaks the high of that candle.
Trade Management:
Entry is on the breakout of the current candle.
Stop Loss: Place the stop loss below the wick of the breakout candle.
Take Profit 1: Close 50% of the position at the 0.5 Fibonacci level. Move the stop loss to breakeven on this position.
Take Profit 2: Close another 25% of the position at the 0.236 Fib level.
Trailing Take Profit: Keep the last 25% open, using a trailing stop loss. (You'll need to define the logic for the trailing stop, e.g., trailing stop using the last high/low)
How to Use in TradingView:
Open a TradingView Chart.
Click on "Pine Editor" at the bottom.
Copy and paste the corrected Pine Script code.
Click "Add to Chart".
The indicator should now be displayed on your chart.

Machine Learning Moving Average [LuxAlgo]The Machine Learning Moving Average (MLMA) is a responsive moving average making use of the weighting function obtained Gaussian Process Regression method. Characteristic such as responsiveness and smoothness can be adjusted by the user from the settings.
The moving average also includes bands, used to highlight possible reversals.
🔶 USAGE
The Machine Learning Moving Average smooths out noisy variations from the price, directly estimating the underlying trend in the price.
A higher "Window" setting will return a longer-term moving average while increasing the "Forecast" setting will affect the responsiveness and smoothness of the moving average, with higher positive values returning a more responsive moving average and negative values returning a smoother but less responsive moving average.
Do note that an excessively high "Forecast" setting will result in overshoots, with the moving average having a poor fit with the price.
The moving average color is determined according to the estimated trend direction based on the bands described below, shifting to blue (default) in an uptrend and fushia (default) in downtrends.
The upper and lower extremities represent the range within which price movements likely fluctuate.
Signals are generated when the price crosses above or below the band extremities, with turning points being highlighted by colored circles on the chart.
🔶 SETTINGS
Window: Calculation period of the moving average. Higher values yield a smoother average, emphasizing long-term trends and filtering out short-term fluctuations.
Forecast: Sets the projection horizon for Gaussian Process Regression. Higher values create a more responsive moving average but will result in more overshoots, potentially worsening the fit with the price. Negative values will result in a smoother moving average.
Sigma: Controls the standard deviation of the Gaussian kernel, influencing weight distribution. Higher Sigma values return a longer-term moving average.
Multiplicative Factor: Adjusts the upper and lower extremity bounds, with higher values widening the bands and lowering the amount of returned turning points.
🔶 RELATED SCRIPTS
Machine-Learning-Gaussian-Process-Regression
SuperTrend-AI-Clustering

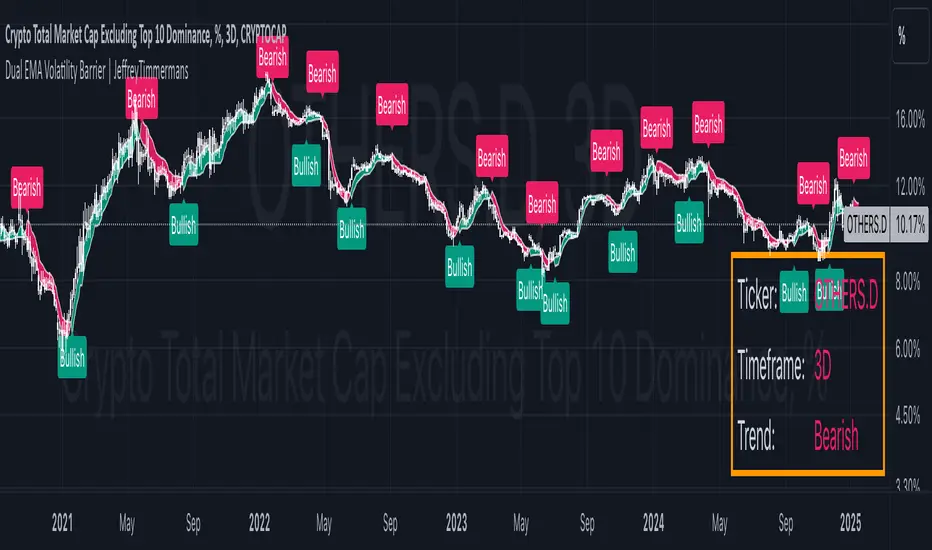
Dual EMA Volatility Barrier | JeffreyTimmermansDual EMA Volatility Barrier
The "Dual EMA Volatility Barrier" indicator combines the power of the Double Exponential Moving Average (DEMA) with volatility-based stops to provide a robust trend-following system. This indicator helps traders identify and confirm trends, offering a way to filter out noise using volatility measures like the Average True Range (ATR) and a higher timeframe filter for additional trend validation.
Key Features
Dual Exponential Moving Average (DEMA):
DEMA Calculation: A more responsive moving average that reduces lag compared to standard EMAs. This helps detect trend changes faster.
Source Customization: Allows traders to choose the source (default is close), which can help adapt the strategy for different market conditions.
Volatility Barrier (Vstop):
Volatility-Based Stops: The Vstop is calculated using the Average True Range (ATR) multiplied by a user-defined factor. This forms a dynamic stop level that adjusts based on market volatility.
Trend Direction: The Vstop adapts to whether the market is in an uptrend or downtrend, providing a stop-loss level that moves accordingly.
Higher Timeframe Trend Filter:
Higher Timeframe DEMA: The higher timeframe filter uses a DEMA from a larger timeframe to confirm the trend direction. Only consider bullish signals if the price is above the higher timeframe DEMA.
Customizable Higher Timeframe: Traders can select any timeframe (e.g., D for daily) to check the trend from a higher perspective.
Signal Generation:
Bullish Signal: Triggered when the trend is up, and the price is above the higher timeframe DEMA, with a corresponding Vstop change indicating an upward trend.
Bearish Signal: Triggered when the trend is down and the price is below the higher timeframe DEMA, with a corresponding Vstop change indicating a downward trend.
Trend Reversals: Identifies key trend reversals by showing the transition between uptrend and downtrend states.
Plotting and Visuals:
DEMA and Vstop Plot: The indicator plots both the DEMA and the Vstop on the chart, providing a visual guide for trend and volatility.
Background Color Fill: The area between the DEMA and Vstop is filled with a color (green for bullish, red for bearish) to provide a clear visual representation of the trend.
Signal Labels: Plot arrows and labels ("Bullish" and "Bearish") directly on the chart to highlight trend changes.
Dashboard:
Ticker & Timeframe Display: The dashboard in the bottom-right corner shows the current symbol (ticker) and timeframe, along with the current trend (Bullish or Bearish).
Real-Time Updates: The dashboard updates in real time, providing traders with quick insights into the current market conditions.
Alerts:
Bullish Alert: Activated when the trend is bullish and confirmed by the higher timeframe DEMA.
Bearish Alert: Activated when the trend is bearish and confirmed by the higher timeframe DEMA.
Customizable Messages: Alerts provide details about the ticker and trend conditions for easy action.
Improvements:
Higher Timeframe Filtering: The higher timeframe DEMA filter ensures that traders align their trades with the broader market trend, improving the overall accuracy of signals.
Volatility-Based Stops: The ATR-based volatility stops allow for adaptive risk management that responds to changing market conditions.
Dynamic Signal Detection: The bullish and bearish signals change in real time, providing actionable insights for traders.
Visual and Dashboard Updates: The chart visually reflects the trend and volatility dynamics, while the dashboard provides summary information at a glance.
Customizable Alerts: Alerts based on trend changes make it easy to stay informed without constantly monitoring the chart.
Use Cases:
Trend Following: Ideal for identifying and following strong trends by combining short-term and long-term trend indicators.
Volatility-Based Risk Management: Use the Vstop to manage trade exits, as it adjusts to market volatility.
Higher Timeframe Confirmation: Use the higher timeframe DEMA to ensure that the trade aligns with the overall market trend.
Alerts for Real-Time Action: Set alerts to notify when the market signals a shift, whether bullish or bearish.
The Dual EMA Volatility Barrier is a powerful tool for traders seeking to combine trend-following with volatility management. The integration of DEMA, ATR, and a higher timeframe filter allows for a more nuanced understanding of market conditions, ensuring traders can make informed decisions with minimal lag.
This script is inspired by "viResearch" . However, it is more advanced and includes additional features and options.
-Jeffrey
Trend Filter (2-pole) [BigBeluga]Trend Filter (2-pole)
The Trend Filter (2-pole) is an advanced trend-following indicator based on a two-pole filter, which smooths out market noise while effectively highlighting trends and their strength. It incorporates color gradients and support/resistance dots to enhance trend visualization and decision-making for traders.
SP500:
🔵What is a Two-Pole Filter?
A two-pole filter is a digital signal processing technique widely used in electronics, control systems, and time series data analysis to smooth data and reduce noise.
//@function Two-pole filter
//@param src (series float) Source data (e.g., price)
//@param length (float) Length of the filter (higher value means smoother output)
//@param damping (float) Damping factor for the filter
//@returns (series float) Filtered value
method two_pole_filter(float src, int length, float damping) =>
// Calculate filter coefficients
float omega = 2.0 * math.pi / length
float alpha = damping * omega
float beta = math.pow(omega, 2)
// Initialize the filter variables
var float f1 = na
var float f2 = na
// Update the filter
f1 := nz(f1 ) + alpha * (src - nz(f1 ))
f2 := nz(f2 ) + beta * (f1 - nz(f2 ))
f2
It operates using two cascaded smoothing stages (poles), allowing for a more refined and responsive output compared to simple moving averages or other basic filters.
Two-pole filters are particularly valued for their ability to maintain smooth transitions while reducing lag, making them ideal for applications where precision and responsiveness are critical.
In trading, this filter helps detect trends by smoothing price data while preserving significant directional changes.
🔵Key Features of the Indicator:
Gradient-Colored Trend Filter Line: The main filter line dynamically changes color based on trend strength and direction:
- Green: Strong uptrend.
- Red: Strong downtrend.
- Yellow: Indicates a transition phase, signaling potential trend shifts.
Support and Resistance Dots with Signals:
- Dots are plotted below the filter line during uptrends and above it during downtrends.
- These dots represent consecutive rising or falling conditions of the filter line, which traders can set in the settings (e.g., the number of consecutive rises or falls required).
- The dots often act as dynamic support or resistance levels, providing valuable guidance during trends.
- Trend Signals:
Customizable Sensitivity: The indicator allows traders to adjust the filter length, damping factor, and the threshold for rising/falling conditions, enabling it to adapt to different trading styles and timeframes.
Bar Color Option: The indicator can optionally color bars to match the gradient of the filter line, enhancing visual clarity of trends directly on the price chart.
🔵How It Works:
The Trend Filter (2-pole) smooths price data using a two-pole filter, which reduces noise and highlights the underlying trend.
The gradient coloring of the filter line helps traders visually assess the strength and direction of trends.
Rising and falling conditions of the filter line are tracked, and dots are plotted when consecutive conditions meet the threshold, acting as potential support or resistance levels during trends.
The yellow transition color signals periods of indecision, helping traders anticipate potential reversals or consolidations.
🔵Use Cases:
Identify and follow strong uptrends and downtrends with gradient-based visual cues.
Use the yellow transition color to anticipate trend shifts or consolidation zones.
Leverage the plotted dots as dynamic support and resistance levels to refine entry and exit strategies.
Combine with other indicators for confirmation of trends and reversals.
This indicator is perfect for traders who want a visually intuitive and highly customizable tool to spot trends, gauge their strength, and make informed trading decisions.

Adaptive Fourier Transform Supertrend [QuantAlgo]Discover a brand new way to analyze trend with Adaptive Fourier Transform Supertrend by QuantAlgo , an innovative technical indicator that combines the power of Fourier analysis with dynamic Supertrend methodology. In essence, it utilizes the frequency domain mathematics and the adaptive volatility control technique to transform complex wave patterns into clear and high probability signals—ideal for both sophisticated traders seeking mathematical precision and investors who appreciate robust trend confirmation!
🟢 Core Architecture
At its core, this indicator employs an adaptive Fourier Transform framework with dynamic volatility-controlled Supertrend bands. It utilizes multiple harmonic components that let you fine-tune how market frequencies influence trend detection. By combining wave analysis with adaptive volatility bands, the indicator creates a sophisticated yet clear framework for trend identification that dynamically adjusts to changing market conditions.
🟢 Technical Foundation
The indicator builds on three innovative components:
Fourier Wave Analysis: Decomposes price action into primary and harmonic components for precise trend detection
Adaptive Volatility Control: Dynamically adjusts Supertrend bands using combined ATR and standard deviation
Harmonic Integration: Merges multiple frequency components with decreasing weights for comprehensive trend analysis
🟢 Key Features & Signals
The Adaptive Fourier Transform Supertrend transforms complex wave calculations into clear visual signals with:
Dynamic trend bands that adapt to market volatility
Sophisticated cloud-fill visualization system
Strategic L/S markers at key trend reversals
Customizable bar coloring based on trend direction
Comprehensive alert system for trend shifts
🟢 Practical Usage Tips
Here's how you can get the most out of the Adaptive Fourier Transform Supertrend :
1/ Setup:
Add the indicator to your favorites, then apply it to your chart ⭐️
Start with close price as your base source
Use standard Fourier period (14) for balanced wave detection
Begin with default harmonic weight (0.5) for balanced sensitivity
Start with standard Supertrend multiplier (2.0) for reliable band width
2/ Signal Interpretation:
Monitor trend band crossovers for potential signals
Watch for convergence of price with Fourier trend
Use L/S markers for trade entry points
Monitor bar colors for trend confirmation
Configure alerts for significant trend reversals
🟢 Pro Tips
Fine-tune Fourier parameters for optimal sensitivity:
→ Lower Base Period (8-12) for more reactive analysis
→ Higher Base Period (15-30) to filter out noise
→ Adjust Harmonic Weight (0.3-0.7) to control shorter trend influence
Customize Supertrend settings:
→ Lower multiplier (1.5-2.0) for tighter bands
→ Higher multiplier (2.0-3.0) for wider bands
→ Adjust ATR length based on market volatility
Strategy Enhancement:
→ Compare signals across multiple timeframes
→ Combine with volume analysis
→ Use with support/resistance levels
→ Integrate with other momentum indicators

Multi Timeframe Market Formation [LuxAlgo]The Multi Timeframe Market Formation tool allows traders to analyze up to 6 different timeframes simultaneously to discover their current formation, S/R levels and their degree of synchronization with the current chart timeframe. Multi timeframe analysis made easy.
🔶 USAGE
By default, the tool displays the chart's timeframe formation plus up to 5 other formations on timeframes higher than the one in the chart.
When the chart formation is synchronized with any enabled timeframe formation, the tool displays labels and a trailing channel, it uses a gradient by default, so the more timeframes are synchronized, the more visible the labels and the trailing channel are.
All timeframes enabled in the settings panel must be higher than the chart timeframe, otherwise the tool will display an error message.
🔹 Formations
A formation is a market structure defined by a lower and an upper boundary (also known as support & resistance).
Each formation has a different symbol and color to identify it at a glance.
It helps traders to know the current market behavior and the tool displays up to 5 of them.
BULLISH (green ▲): higher high and higher low
BEARISH (red ▼): lower high and lower low
CONTRACTION (orange ◀): lower high and higher low
EXPANSION (blue ▶): higher high and lower low
SIDEWAYS (yellow ◀): Any that does not fit with the others
🔹 Multi Timeframe Formations
The tool displays up to 6 different timeframe formations, the chart timeframe plus 5 more configurable from the settings panel.
Each of them has an upper and lower limit, a timeframe, a color and an icon.
If a bound level is shared by more than one formation, the timeframes and symbols are displayed on the same line.
These are significant levels shared by different timeframes and traders need to be aware of them.
🔹 Sync With Chart Timeframe
If the current formation on the chart timeframe is in sync with any of the timeframes enabled in the settings panel, the tool will display this on the chart.
The more timeframes are in sync, the more they are visible, providing a clear visual representation of the common market behavior on multiple timeframes at the same time.
🔶 SETTINGS
Formation size: Size of market formations on the chart timeframe
🔹 Timeframes
TF1 to TF5: Activate/deactivate timeframe, set size of market formation and activate/deactivate high and low levels
🔹 Style
Show Labels: Enable/Disable Timeframe Sync Labels
Transparency Gradient: Enable/Disable Transparency Gradient
Show Trailing Channel | Multiplier: Enable/Disable Trailing Channel and set multiplier
Color for each formation

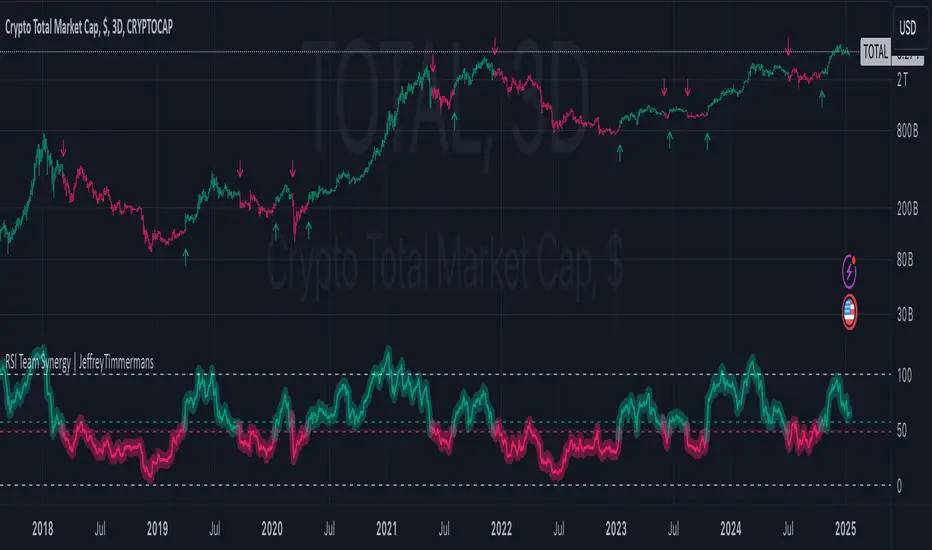
RSI Team Synergy | JeffreyTimmermansRSI Team Synergy
The "RSI Team Synergy" indicator is an advanced and highly customizable tool that integrates a Double RSI (DRSI) approach for comprehensive trend and momentum analysis. It utilizes two layers of RSI calculations, along with optional smoothing and various moving average types, to enhance signal accuracy. The dynamic visuals and alerts make this indicator a valuable resource for traders aiming to optimize their strategies.
Key Features
Double RSI (DRSI) Calculation
First RSI (Primary Layer): Captures the core price momentum using a configurable period.
Second RSI (DRSI Layer): Applies a second RSI calculation to the smoothed first RSI, refining signals and amplifying trend accuracy.
Double RSI Formula: Combines the smoothed RSI layers into a single robust indicator that adapts to market conditions.
Smoothing and Advanced Moving Averages
Optional Smoothing: Enables users to reduce noise by applying smoothing to both RSI layers.
Advanced MA Options: Supports multiple MA types, including SMA, EMA, WMA, RMA, DEMA, TEMA, VWMA, ZLEMA, and HMA. These can be applied to tailor the indicator to specific trading conditions.
Separate Configurations: Independent smoothing lengths and types for each RSI layer provide unparalleled customization.
Threshold and Signal System
Long Threshold: Highlights bullish conditions when the Double RSI exceeds the threshold.
Short Threshold: Signals bearish conditions when the Double RSI falls below the threshold.
Directional State: Tracks the overall direction using a state-based signal system (bullish, bearish, or neutral).
Dynamic Visualization
Oscillator Color Coding: Green shades for bullish momentum. Red shades for bearish momentum. Dynamic gradients for smoother transitions.
Glow Effect: Optional glowing lines enhance the visual clarity of the oscillator.
Threshold Lines: Configurable dashed horizontal lines to mark critical levels for easy reference.
Bar Color Integration
Bar Coloring: Matches bar colors to the oscillator's direction for cohesive visualization.
Advanced Control: Toggle bar coloring on/off without affecting other plots.
Alerts
Bullish Signal Alert: Triggers when the Double RSI crosses above the long threshold.
Bearish Signal Alert: Triggers when the Double RSI crosses below the short threshold.
Custom Messages: Alerts are equipped with descriptive messages for actionable insights.
Signal Arrows
Bullish Arrow (↑): Marks upward trends directly on the chart.
Bearish Arrow (↓): Highlights downward trends, ensuring traders never miss an opportunity.
Improvements
Customizable Thresholds: Adjustable long and short thresholds allow traders to fine-tune sensitivity.
Enhanced Smoothing Control: Separate smoothing options for each RSI layer provide flexibility in noise reduction.
Multiple MA Types: Extensive support for advanced moving averages to suit diverse trading preferences.
Color-Coded Oscillator: Improves trend visibility with gradient-based coloring and optional glow effects.
Signal Detection: Clear and intuitive arrows directly on the chart for quick signal interpretation.
Alerts and Notifications: Comprehensive alert conditions keep traders informed in real-time.
Use Cases
Momentum Analysis: Identify sustained bullish or bearish trends using the Double RSI calculation.
Noise Reduction: Utilize smoothing and advanced MA options to remove market noise.
Reversal Detection: Spot potential trend reversals with threshold-based signals.
Customizable Strategies: Tailor the indicator for scalping, swing trading, or long-term analysis.
The RSI Team Synergy indicator combines precision, flexibility, and intuitive design, making it an essential tool for traders at all levels. With its innovative Double RSI approach and advanced customization options, it provides actionable insights for mastering market trends.
This script is inspired by "Clokivez" . However, it is more advanced and includes additional features and options.
-Jeffrey
The Curved Market Structure [BigBeluga]Curved Market Structure
The Curved Market Structure indicator offers an innovative twist on traditional market structure tools by using curved lines instead of horizontal ones, enabling faster breakout detection for traders.
🔵Key Features:
Curved Market Structure Levels: The indicator identifies high and low pivots and plots curved lines connecting these points, adapting to market dynamics and providing a more intuitive view of potential breakout zones.
Breakout Detection: Breakouts above or below the curved levels are marked with triangle symbols (▲ or ▼), making it easy to spot critical price movements.
Dynamic Target Levels: After a breakout, the indicator plots three target levels, which serve as potential price objectives. Each target is marked with a number and a star (e.g., 1★) upon being reached.
Customizable Line Length and Angle: Users can adjust the length and angle of the curved lines to fit their trading style and timeframe, making the tool versatile and adaptable.
Market Structure Trend Filtering: To maintain a clean chart, the indicator plots curved levels only from high pivots during uptrends and low pivots during downtrends.
🔵How It Works:
The indicator identifies high and low pivots using user-defined parameters (left and right bars).
Curved lines are drawn from these pivot points, showing the structure of the market and potential breakout zones.
When a breakout occurs, the indicator highlights the direction with triangle symbols and dynamically plots three price targets.
Upon reaching these targets, the level is marked with its respective number and a star, helping traders track price progression effectively.
The lines and targets are adjusted based on market conditions, ensuring real-time relevance and accuracy.
🔵Use Cases:
Spotting key breakout zones to identify entry and exit points more effectively.
Setting dynamic target levels for take-profit or stop-loss planning.
Filtering market noise and maintaining a cleaner chart while analyzing trends.
Enhancing traditional market structure analysis with an intuitive curved visualization.
This indicator is ideal for traders who want a modern, dynamic, and visually appealing way to track market structure and breakouts while maintaining chart clarity.

Buy Sell Indicator - MicroStrategiesOverview :
The "Buy Sell Indicator - MicroStrategies" is designed to provide traders with dynamic buy and sell signals based on an adaptive channel and supertrend approach. This script is unique as it combines standard supertrend methodology with a custom channel logic to adapt more effectively to market conditions, enhancing the identification of trend reversals.
Key Features:
Adaptive Channel Logic: Utilizes a calculated channel, defined by the highest and lowest prices over a specified period, to adjust the trend sensitivity dynamically. This helps in accurately identifying potential buy and sell zones by incorporating price volatility.
Supertrend Integration: Integrates with a modified supertrend function that uses the adaptive channel to set trend thresholds. This combination allows the script to filter out less significant movements and focus on substantial trends, minimizing false signals.
Signal Alerts: Provides visual and alert-based signals for entering (Buy) and exiting (Sell) trades, enhancing user interaction and trade execution timing.
Usefulness: This indicator is particularly useful for traders who engage in medium to long-term trading strategies. It helps in determining optimal entry and exit points, thereby aiding in risk management and profit maximization.
How It Works:
The script calculates the high and low channel limits over a user-defined length.
It then calculates a range from these limits and sets upper and lower thresholds based on the trend sensitivity input.
Buy signals are generated when the price crosses above the adaptive upper limit, suggesting an upward trend.
Sell signals are triggered when the price crosses below the adaptive lower limit, indicating a potential downward trend.
How to Use:
Apply the indicator to any chart.
Adjust the trendSensitivity, channelLength, and atrLookback parameters according to your trading preferences.
Use the buy (B) and sell (S) labels to guide your trading decisions.
Originality: This script is original in its approach by merging traditional supertrend indicators with a customized channel-based method to refine signal accuracy and responsiveness to market changes. This dual approach helps in better capitalizing on trends and avoiding sideways market phases.
Performance Claims: No unrealistic performance or profitability claims are made about this script. Traders should use this tool as part of a comprehensive trading strategy, considering risk management and market conditions. Past performance does not guarantee future results, and users should test the script in different market environments.
Disclaimer: This script does not guarantee earnings. Traders should use it at their discretion and in conjunction with other analytical tools.
Conclusion: The "Buy Sell Indicator - MicroStrategies" offers an innovative combination of trend detection methodologies tailored to enhance trading strategies through precise signal generation. Its design is focused on providing clear, actionable trading signals to assist in decision-making processes.

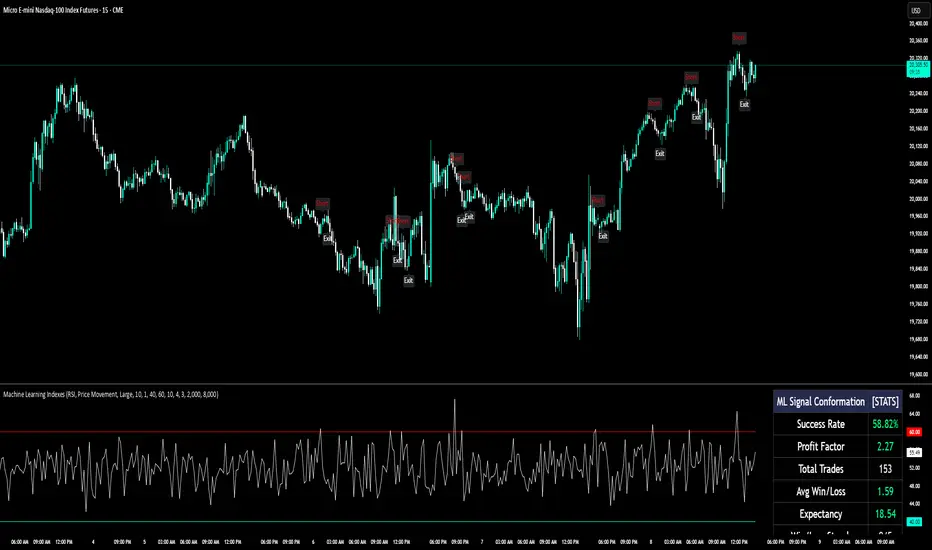
Machine Learning IndexesMachine Learning Indexes Script Description
The Machine Learning Indexes script is an advanced Pine Script™ indicator that applies machine learning techniques to analyze various market data types. It enables traders to generate adaptive long and short signals using highly customizable settings for signal detection and analysis.
Key Features:
Signal Mode: Allows the user to choose between generating signals for "Longs" (buy opportunities) or "Shorts" (sell opportunities).
Index Type: Supports multiple index types including RSI, CCI, MFI, Stochastic, and Momentum. All indexes are normalized between 0-100 for uniformity.
Data Set Selection: Provides options for analyzing Price, Volume, Volatility, or Momentum-based data sets. This enables traders to adapt the script to their preferred market analysis methodology.
Absolute vs. Directional Changes: Includes a toggle to calculate absolute changes for values or maintain directional sensitivity for trend-based analysis.
Dynamic Index Calculation: Automatically calculates and compares multiple index lengths to determine the best fit for current market conditions, adding precision to signal generation.
Input Parameters:
Signal Settings:
Signal Mode: Selects between "Longs" or "Shorts" to define the signal direction.
Index Type: Chooses the type of market index for calculations. Options include RSI, CCI, MFI, Stochastic, and Momentum.
Data Set Type: Determines the basis of the analysis, such as Price, Volume, Volatility, or Momentum-based data.
Absolute Change: Toggles whether absolute or directional changes are considered for calculations.
Index Settings:
Min Index Length: Sets the base index length used for calculations.
Index Length Variety: Adjusts the increment steps for variations in index length.
Lower/Upper Bands: Define thresholds for the selected index, indicating overbought and oversold levels.
Signal Parameters:
Target Signal Size: Number of bars used to identify pivot points.
Backtest Trade Size: Defines the number of bars over which signal performance is measured.
Sample Size: Number of data points used to calculate signal metrics.
Signal Strength Needed: Sets the minimum confidence required for a signal to be considered valid.
Require Low Variety: Option to prioritize signals with lower variability in results.
How It Works:
The script dynamically calculates multiple index variations and compares their accuracy to detect optimal parameters for generating signals.
Signal validation considers the chosen mode (longs/shorts), data set, index type, and signal parameters.
Adaptive moving averages (ADMA) and Band Signals (BS) are plotted to visualize the interaction between market trends and thresholds.
Long and short signals are displayed with clear up (L) and down (S) labels for easy interpretation.
Performance Metrics:
Success Rate: Percentage of valid signals that led to profitable outcomes.
Profit Factor: Ratio of gains from successful trades to losses from unsuccessful trades.
Disclaimer:
This indicator is for informational purposes only and does not guarantee future performance. It is designed to support traders in making informed decisions but should be used alongside other analysis methods and risk management strategies.
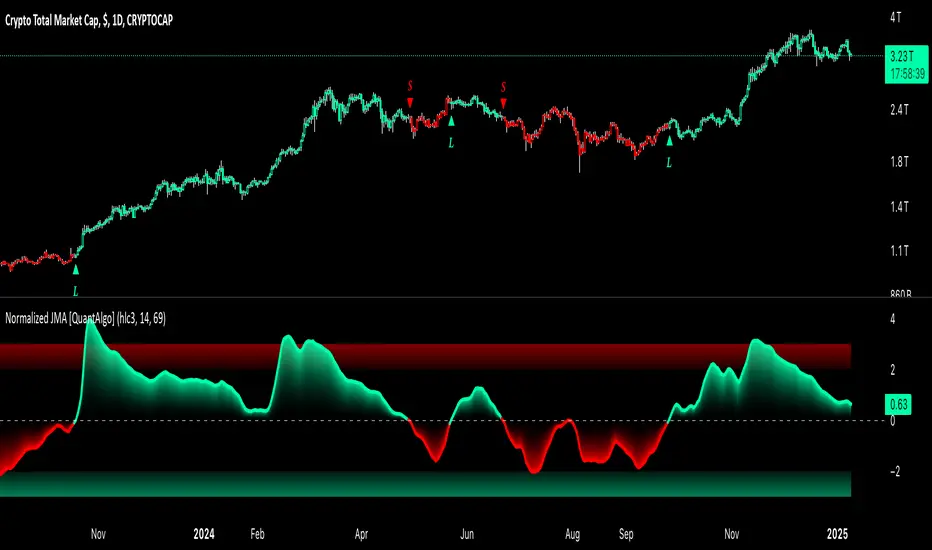
Normalized Jurik Moving Average [QuantAlgo]Upgrade your investing and trading strategy with the Normalized Jurik Moving Average (JMA) , a sophisticated oscillator that combines adaptive smoothing with statistical normalization to deliver high-quality signals! Whether you're a swing trader looking for momentum shifts or a medium- to long-term investor focusing on trend validation, this indicator's statistical approach offers valuable analytical advantages that can enhance your trading and investing decisions!
🟢 Core Architecture
The foundation of this indicator lies in its unique dual-layer calculation system. The first layer implements the Jurik Moving Average, known for its superior noise reduction and responsiveness, while the second layer applies statistical normalization (Z-Score) to create standardized readings. This sophisticated approach helps identify significant price movements while filtering out market noise across various timeframes and instruments.
🟢 Technical Foundation
Three key components power this indicator are:
Jurik Moving Average (JMA): An advanced moving average calculation that provides superior smoothing with minimal lag
Statistical Normalization: Z-Score based scaling that creates consistent, comparable readings across different market conditions
Dynamic Zone Detection: Automatically identifies overbought and oversold conditions based on statistical deviations
🟢 Key Features & Signals
The Normalized JMA delivers market insights through:
Color-adaptive oscillator line that reflects momentum strength and direction
Statistically significant overbought/oversold zones for trade validation
Smart gradient fills between signal line and zero level for enhanced visualization
Clear long (L) and short (S) markers for validated momentum shifts
Intelligent bar coloring that highlights the current market state
Customizable alert system for both bullish and bearish setups
🟢 Practical Usage Tips
Here's how to maximize your use of the Normalized JMA:
1/ Setup:
Add the indicator to your favorites, then apply it to your chart ⭐️
Begin with the default smoothing period for balanced analysis
Use the default normalization period for optimal signal generation
Start with standard visualization settings
Customize colors to match your chart preferences
Enable both bar coloring and signal markers for complete visual feedback
2/ Reading Signals:
Watch for L/S markers - they indicate validated momentum shifts
Monitor oscillator line color changes for direction confirmation
Use the built-in alert system to stay informed of potential trend changes
🟢 Pro Tips
Adjust Smoothing Period based on your trading style:
→ Lower values (8-12) for more responsive signals
→ Higher values (20-30) for more stable trend identification
Fine-tune Normalization Period based on market conditions:
→ Shorter periods (20-25) for more dynamic markets
→ Longer periods (40-50) for more stable markets
Optimize your analysis by:
→ Using +2/-2 zones for primary trade signals
→ Using +3/-3 zones for extreme market conditions
→ Combining with volume analysis for trade confirmation
→ Using multiple timeframe analysis for strategic context
Combine with:
→ Volume indicators for trade validation
→ Price action for entry timing
→ Support/resistance levels for profit targets
→ Trend-following indicators for directional bias
Prime Bands [ChartPrime]The Prime Standard Deviation Bands indicator uses custom-calculated bands based on highest and lowest price values over specific period to analyze price volatility and trend direction. Traders can set the bands to 1, 2, or 3 standard deviations from a central base, providing a dynamic view of price behavior in relation to volatility. The indicator also includes color-coded trend signals, standard deviation labels, and mean reversion signals, offering insights into trend strength and potential reversal points.
⯁ KEY FEATURES AND HOW TO USE
⯌ Standard Deviation Bands :
The indicator plots upper and lower bands based on standard deviation settings (1, 2, or 3 SDs) from a central base, allowing traders to visualize volatility and price extremes. These bands can be used to identify overbought and oversold conditions, as well as potential trend reversals.
Example of 3-standard-deviation bands around price:
⯌ Dynamic Trend Indicator :
The midline of the bands changes color based on trend direction. If the midline is rising, it turns green, indicating an uptrend. When the midline is falling, it turns orange, suggesting a downtrend. This color coding provides a quick visual reference to the current trend.
Trend color examples for rising and falling midlines:
⯌ Standard Deviation Labels :
At the end of the bands, the indicator displays labels with price levels for each standard deviation level (+3, 0, -3, etc.), helping traders quickly reference where price is relative to its statistical boundaries.
Price labels at each standard deviation level on the chart:
⯌ Mean Reversion Signals :
When price moves beyond the upper or lower bands and then reverts back inside, the indicator plots mean reversion signals with diamond icons. These signals indicate potential reversal points where the price may return to the mean after extreme moves.
Example of mean reversion signals near bands:
⯌ Standard Deviation Scale on Chart :
A visual scale on the right side of the chart shows the current price position in relation to the bands, expressed in standard deviations. This scale provides an at-a-glance view of how far price has deviated from the mean, helping traders assess risk and volatility.
⯁ USER INPUTS
Length : Sets the number of bars used in the calculation of the bands.
Standard Deviation Level : Allows selection of 1, 2, or 3 standard deviations for upper and lower bands.
Colors : Customize colors for the uptrend and downtrend midline indicators.
⯁ CONCLUSION
The Prime Standard Deviation Bands indicator provides a comprehensive view of price volatility and trend direction. Its customizable bands, trend coloring, and mean reversion signals allow traders to effectively gauge price behavior, identify extreme conditions, and make informed trading decisions based on statistical boundaries.

Machine Learning RSI Bands V3The Machine Learning RSI Bands V3 is a cutting-edge trading tool designed to provide actionable insights by combining the strength of machine learning with a traditional RSI framework. It adapts dynamically to changing market conditions, offering traders a robust, data-driven approach to identifying opportunities.
Let’s break down its functionality and the logic behind each input to give you a clear understanding of how it works and how you can use it effectively.
RSI Parameters RSI Source (rsisrc): Choose the data source for RSI calculation, such as the closing price. This allows you to focus on the specific price data that aligns with your trading strategy. RSI Length (rsilen): Set the number of periods used for RSI calculation. A shorter length makes the RSI more reactive to price changes, while a longer length smooths out volatility. These inputs allow you to customize the foundational RSI calculations, ensuring the indicator fits your style of trading.
Band Limits Lower Band Limit (lb): Defines the RSI value below which the market is considered oversold. Upper Band Limit (ub): Defines the RSI value above which the market is considered overbought. These settings give you control over the thresholds for market conditions. By adjusting the band limits, you can tailor the indicator to be more or less sensitive to market movements.
Sampling and Reaction Settings Target Reaction Size (l): Determines the number of bars used to define pivot points. Smaller values react to shorter-term price movements, while larger values focus on broader trends. Backtesting Reaction Size (btw): Sets the number of bars used to validate signal performance. This ensures signals are only considered valid if they perform consistently within the specified range. Data Format (version): Choose between Absolute (ignoring direction) and Directional (incorporating directional price changes). Sampling Method (sm): Select how the data is analyzed—options include Price Movement, Volume Movement, RSI Movement, Trend Movement, or a Hybrid approach. These settings empower you to refine how the indicator processes and interprets data, whether focusing on short-term price shifts or broader market trends.
Signal Settings Signal Confidence Method (cm): Choose between: Threshold: Signals must meet a confidence limit before being generated. Voting: Requires a majority of 5 signal components to confirm a trade. Confidence Limit (cl): Defines the confidence threshold for generating signals when using the Threshold method. Votes Needed (vn): Sets the number of votes required to confirm a trade when using the Voting method. Use All Outputs (fm): If enabled, signals are generated without filtering, providing an unfiltered view of potential opportunities. This section offers a balance between precision and flexibility, enabling you to control the rigor applied to signal generation.
How It Works
The script uses machine learning models to adaptively calculate dynamic RSI bands. These bands adjust based on market conditions, providing a more responsive and nuanced interpretation of overbought and oversold levels.
Dynamic Bands: The lower and upper RSI bands are recalibrated using machine learning to reflect current market conditions. Signals: Long and short signals are generated when RSI crosses these bands, with additional filters applied based on your chosen confidence method and sampling settings. Transparency: Real-time success rates and profit factors are displayed on the chart, giving you clear feedback on the indicator's performance.
Why Use Machine Learning RSI Bands V3?
This indicator is built for traders who want more than static thresholds and generic signals. It offers:
Adaptability: Machine learning dynamically adjusts the indicator to market conditions. Customizability: Each input serves a specific purpose, giving you full control over its behavior. Accountability: With built-in performance metrics, you always know how the tool is performing.
This is a tool designed for those who value precision and adaptability in trading.
