Hyper Insight MA Strategy [Universal]Hyper Insight MA Strategy ** is a comprehensive trend-following engine designed for traders who require precision and flexibility. Unlike standard indicators that lock you into a single calculation method, this strategy serves as a "Universal Adapter," allowing you to **Mix & Match 13 different Moving Average types** for both the Fast and Slow trend lines independently.
Whether you need the smoothness of T3, the responsiveness of HMA, or the classic reliability of SMA, this script enables you to backtest thousands of combinations to find the perfect edge for your specific asset class.
---
🔬 Deep Dive: Calculation Logic of Included MAs
This strategy includes 13 distinct calculation methods. Understanding the math behind them will help you choose the right tool for your specific market conditions.
#### 1. Standard Averages
* **SMA (Simple Moving Average):** The unweighted mean of the previous $n$ data points.
* *Logic:* Treats every price point in the period with equal importance. Good for identifying long-term macro trends but reacts slowly to recent volatility.
* **WMA (Weighted Moving Average):** A linear weighted average.
* *Logic:* Assigns heavier weight to current data linearly (e.g., $1, 2, 3... n$). It reacts faster than SMA but is still relatively smooth.
* **SWMA (Symmetrically Weighted Moving Average):**
* *Logic:* Uses a fixed-length window (usually 4 bars) with symmetrical weights $ $. It prioritizes the center of the recent data window.
#### 2. Exponential & Lag-Reducing Averages
* **EMA (Exponential Moving Average):**
* *Logic:* Applies an exponential decay weighting factor. Recent prices have significantly more impact on the average than older prices, reducing lag compared to SMA.
* **RMA (Running Moving Average):** Also known as Wilder's Smoothing (used in RSI).
* *Logic:* It is essentially an EMA but with a slower alpha weight of $1/length$. It provides a very smooth, stable line that filters out noise effectively.
* **DEMA (Double Exponential Moving Average):**
* *Logic:* Calculated as $2 \times EMA - EMA(EMA)$. By subtracting the "lag" (the smoothed EMA) from the original EMA, DEMA provides a much faster reaction to price changes with less noise than a standard EMA.
* **TEMA (Triple Exponential Moving Average):**
* *Logic:* Calculated as $3 \times EMA - 3 \times EMA(EMA) + EMA(EMA(EMA))$. This effectively eliminates the lag inherent in single and double EMAs, making it an extremely fast-tracking indicator for scalping.
#### 3. Advanced & Adaptive Averages
* **HMA (Hull Moving Average):**
* *Logic:* A composite formula involving Weighted Moving Averages: ASX:WMA (2 \times Integer(n/2)) - WMA(n)$. The result is then smoothed by a $\sqrt{n}$ WMA.
* *Effect:* It eliminates lag almost entirely while managing to improve curve smoothness, solving the traditional trade-off between speed and noise.
* **ZLEMA (Zero Lag Exponential Moving Average):**
* *Logic:* This calculation attempts to remove lag by modifying the data source before smoothing. It calculates a "lag" value $(length-1)/2$ and applies an EMA to the data: $Source + (Source - Source )$. This creates a projection effect that tracks price tightly.
* **T3 (Tillson T3 Moving Average):**
* *Logic:* A complex smoothing technique that runs an EMA through a filter multiple times using a "Volume Factor" (set to 0.7 in this script).
* *Effect:* It produces a curve that is incredibly smooth and free of "overshoot," making it excellent for filtering out market chop.
* **ALMA (Arnaud Legoux Moving Average):**
* *Logic:* Uses a Gaussian distribution (bell curve) to assign weights. It allows the user to offset the moving average (moving the peak of the weight) to align it perfectly with the price, balancing smoothness and responsiveness.
* **LSMA (Least Squares Moving Average):**
* *Logic:* Calculates the endpoint of a Linear Regression line for the lookback period. It essentially guesses where the price "should" be based on the best-fit line of the recent trend.
* **VWMA (Volume Weighted Moving Average):**
* *Logic:* Weights the closing price by the volume of that bar.
* *Effect:* Prices on high volume days pull the MA harder than prices on low volume days. This is excellent for validating true trend strength (i.e., a breakout on high volume will move the VWMA significantly).
---
### 🛠 Features & Settings
* **Universal Switching:** Change the `Fast MA` and `Slow MA` types instantly via the settings menu.
* **Trend Cloud:** A dynamic background fill (Green/Red) highlights the crossover zone for immediate visual trend identification.
* **Strategy Mode:** Built-in Backtesting logic triggers `LONG` entries when Fast MA crosses over Slow MA, and `EXIT` when Fast MA crosses under.
### ⚠️ Disclaimer
This script is intended for educational and research purposes. The wide variety of MA combinations can produce vastly different results. Past performance is not indicative of future results. Please use proper risk management.
ממוצע נע פשוט (SMA)

EB/TB V24: Fixed Risk Trend-Following (Elephant Bar / Trend Bar)This is an advanced trend-following strategy built around the Elephant Bar (EB) and Trend Bar (TB) candle patterns. It uses a fixed dollar risk per trade to automatically size positions and employs a sophisticated exit management system, including partial profit taking, a dynamic Trailing Stop Loss (SL), and a 180° immediate reversal mechanism.
Detailed Description
This strategy is designed for active trend capture and robust risk management:
Fixed Risk Position Sizing: Automatically calculates trade quantity based on a defined maximum dollar risk (mlpt_max_risk) and the initial Stop Loss placement.
Trend Identification: Entries are triggered by confirmed Elephant Bars (strong momentum candles) or Trend Bars, filtered by two short-term MAs (MA #1, MA #2) and a long-term MA (MA #3 / MA200) for context.
Dual Exit Management:
Partial Take Profit (50%): Half the position is closed at a fixed profit target (tp_fixed_pct).
Dynamic Trailing SL (50%): The remaining 50% is protected by a Trailing SL that adjusts based on the low/high of subsequent valid EB/TB signals, maximizing trend ride duration.
Emergency Exits:
SAma Exit: Uses the crossing of the price below/above the MA #1 (short period) as a dynamic exit criterion.
180° Reversal: Features an immediate close (Cap8) and reverse (180) entry when a strong, unfiltered opposite raw EB signal appears.
Note: This published version only displays the Moving Averages, the entry signals, and the Take Profit lines for a clean chart view.

PSAR with ATR Trailing Stop + SMA Filter📈 Strategy Overview: PSAR + 6×ATR Trailing Stop with SMA Filter
This strategy is built around the principle of “Cut the losers, let the winners run” — a disciplined, trend-following approach that combines the Parabolic SAR indicator with dynamic risk management and a Simple Moving Average (SMA) trend filter.
🔍 Strategy Logic
Trend Filter Trades are only taken in the direction of the prevailing trend, defined by a user-selected SMA (default: 100).
✅ Long trades only when price is above the SMA
✅ Short trades only when price is below the SMA
Entry Signal: A trade is triggered when the Parabolic SAR flips to the opposite side of the price bars, signaling a potential trend reversal.
Stop Loss: The stop loss is dynamically set at 6×ATR from the entry price. This adapts to market volatility and is recalculated every bar — effectively acting as a trailing stop.
Exit Logic: There is no fixed take profit. The trade remains open until the trailing stop is hit — allowing winners to run and losers to be cut quickly.
Risk Management: Each trade risks 0.5% of total equity, ensuring consistent position sizing and capital preservation.
📊 Visual Elements
PSAR dots mark trend direction changes
SMA line shows the broader trend filter
Trailing stop crosses (with 50% opacity) indicate the current stop level without cluttering the chart
⚙️ Customizable Inputs
PSAR parameters: Start, Increment, Maximum
ATR length and multiplier
SMA length
Risk percentage per trade
This strategy is ideal for traders who want to stay aligned with the trend, automate disciplined exits, and avoid emotional decision-making. Clean, simple, and powerful.
Wishing you calm and successful trades!

Bollinger Bands Breakout StrategyHey guys check out this strategy script.
Chart plotting:
I use a classic plot of Bollinger Bands to define a consolidation zone, I also use a separate Trend Filter (SMA).
Logic:
When the price is above the SMA and above the Bollinger Upper Band the strategy goes Long. When the price is below the SMA and below the Bollinger Lower Band the strategy goes Short. Simple.
Exits:
TP and SL are a percentage of the price.
Notes: This simple strategy can be used at any timeframe (I prefer the 15min for day trading). It avoids consolidation, when the price is inside the Bollinger Bands, and has a good success rate. Adjust the Length of the BB to suit your style of trading (Lower numbers=more volatile, Higher numbers=more restrictive). Also you can adjust the Trend Filter SMA, I presonally chose the 50 SMA. Finally the SL/TP can be also adjusted from the input menu.
Test it for yourself!
Have great trades!

SPY200SMA (+4%/-3%) TQQQ/QQQ STRATEGYSummary of the Improved Strategy: When the price of AMEX:SPY is +4% above the 200SMA BUY NASDAQ:TQQQ and when the price of SPY drops to -3% under the SPY 200SMA SELL everything and slowly DCA into NASDAQ:QQQ over the next 6-12 months or until price returns to +4% above the SPY 200SMA at which point you will go back into 100% TQQQ.
Note: (if the price of QQQ goes 30% above the 200SMA of QQQ deleverage to QQQ or Sell to protect yourself from dot com level event)
More info and stats -https://www.reddit.com/r/LETFs/comments/1nhye66/spy_200sma_43_tqqqqqq_long_term_investment/

Quanta - Free Beginner Strategysimple strategy for indian indices. it uses moving averages only to identify trend biase and generated signal based on that.


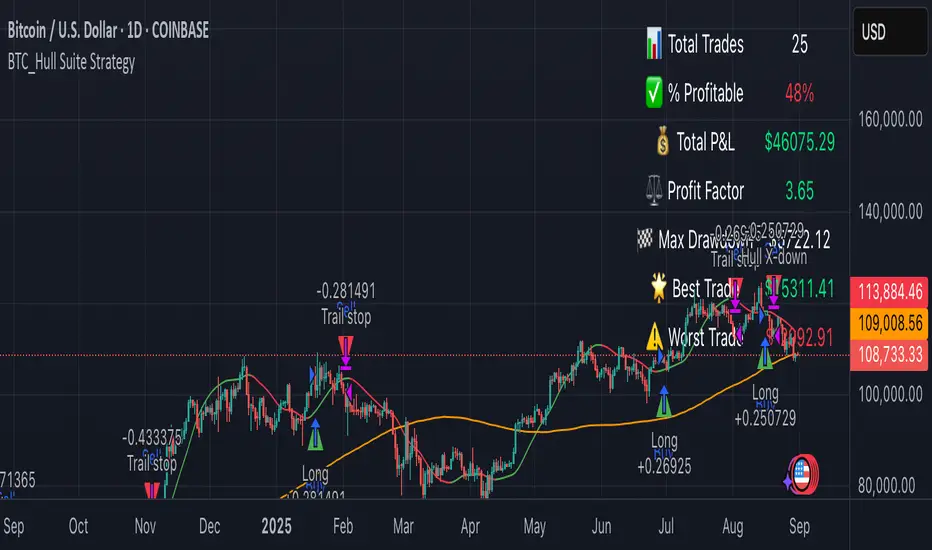
BTC_Hull Suite StrategyOverview
BTC_Hull Suite Strategy is a trend-following system designed to keep drawdowns modest while staying exposed during genuine uptrends. It uses the Hull Moving Average (HMA) for fast, low-lag trend turns, a long-term SMA filter to avoid chop, and a percentage trailing stop to protect gains.
🔧 What the strategy includes
- Hull Moving Average (HMA) with configurable length (default 55)
- SMA filter (default 130) to trade only with higher-timeframe bias
- Trailing stop in percent (default 5%) based on the running peak of close
- Execution model: signals are evaluated on the previous bar and entries are placed at the next bar’s open (TradingView default)
📈 How it works:
✅ Entry (Long):
Detects a bullish Hull turn by comparing the current HMA to its value 3 bars ago:
h > h3 and h <= h3 → HMA just turned up on the prior bar
The SMA filter must confirm: close > sma
If both are true (and within the date window), a long is opened next bar at the open
❌ Exit:
Hull turn down: h < h3 and h >= h3 , or
Trailing stop: price closes below peak * (1 – trailingPct)
Either condition closes the position at the current bar’s close
Notes:
pyramiding = 1 → allows one add-on (maximum two concurrent long positions)
Position sizing defaults to 20% of equity per entry (adjustable in Properties)
Who is this for?
This strategy is tailored for Bitcoin traders (spot or perpetuals) who want a rules-based, low-lag trend system with built-in drawdown protection.
It works best on Daily or 4H charts, but parameters can be adapted for other timeframes.
⚠️ Disclaimer
This strategy is provided for educational and research purposes only.
It is not financial advice. Markets are risky — always test on your own data, include realistic fees/slippage, and forward-test before using real capital.
Simple SMA StrategySimple strategy to buy based on closing above SMA, and sell based on closing below SMA.
You can change the SMA value and your start date to customize the strategy for your initial entry date and SMA value. SMA is based on chart time frame.

PowerTrend Pro Strategy – Gold OptimizedTired of false signals on Gold?
PowerTrend Pro combines VWAP, Supertrend, RSI, and smart MA filters with trailing stops & break-even logic to deliver high-probability trades on XAUUSD.
PowerTrend Pro Strategy is a professional-grade trading system designed to capture high-probability swing and intraday opportunities on XAUUSD (Gold) and other volatile markets.
🔑 Core Features
VWAP Anchoring – institutional fair value reference to filter trades.
Supertrend (ATR-based) – adaptive trend filter tuned for Gold’s volatility.
Multi-Timeframe RSI – confirms momentum alignment across intraday and higher timeframe.
EMA + SMA Combo – ensures trades follow strong directional bias, reducing false signals.
Dynamic Risk Management
Adjustable Take Profit / Stop Loss (%)
Trailing Stop that locks in profits on extended moves
Break-Even Logic (stop loss moves to entry once price is in profit)
⚡ Gold-Tuned Presets
XAUUSD 1H → tighter TP/SL & faster entries for active intraday trading.
XAUUSD 4H → wider ATR filter & trailing stops to capture bigger swings.
Generic Mode → works on Forex, Indices, and Crypto (fully customizable).
🎯 Why It Works
Gold is notoriously volatile — quick spikes wipe out weak strategies. PowerTrend Pro solves this by combining:
✅ Institutional bias (VWAP)
✅ Adaptive trend filter (Supertrend)
✅ Momentum confirmation (RSI MTF)
✅ Robust trend structure (EMA + SMA)
✅ Smart exits (TP, SL, trailing & breakeven)
This multi-layer confirmation makes entries stronger and keeps risk under control.
🛠️ Usage
Add the strategy to your chart.
Choose a preset (XAUUSD 1H, 4H, or Generic).
Run Strategy Tester for performance metrics.
Optimize TP/SL and ATR values for your broker & market conditions.
🔥 Pro Tip: Combine this strategy with a session filter (London/NY overlap) or volume confirmation to boost accuracy in Gold.

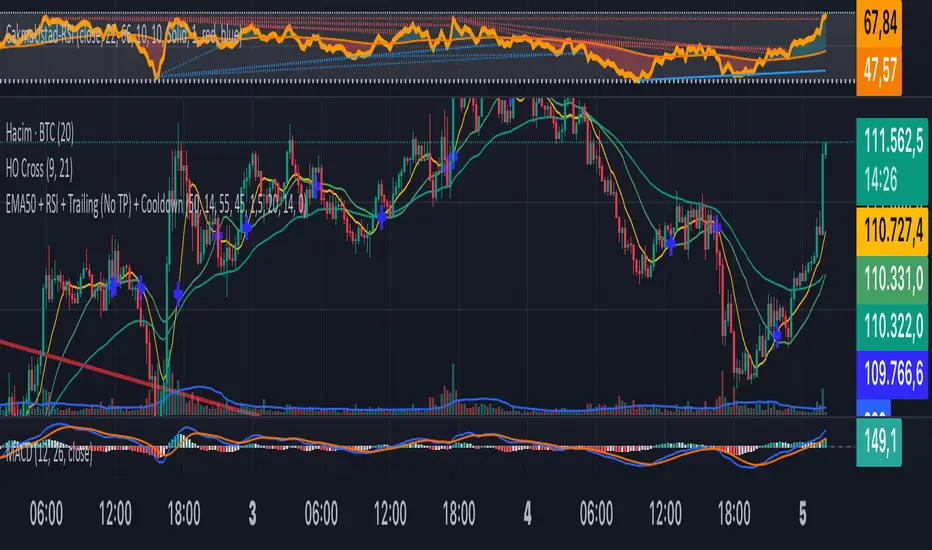
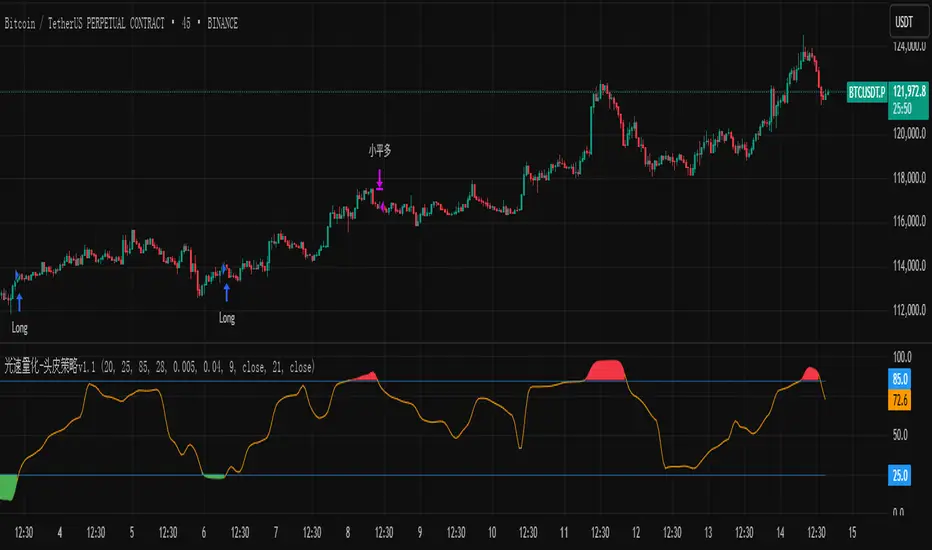
光速量化-头皮策略v1.1Version: Unlimited trial version.
Principle: RSI and moving average complement each other, taking a bite of both oscillation and trend.
Disadvantage: High drawdown.
Disclaimer: The scalp strategy v1.1 of Lightspeed Quantification is designed for trial users. Those who use this strategy are responsible for their own assets, and any losses incurred are not the responsibility of the author.
版本:无期限试用版。
原理:RSI与均线配合,震荡与趋势都吃一口。
缺点:回撤高。
声明:光速量化的头皮策略v1.1是面向试用者体验的,使用该策略的人请为自己的资产负责,产生任何损失与作者无关。
Trend Impulse Tester | Trend–Impulse–No-Chop (In development) Trend strategy. Regulate your entry and make the drawdown less than 3%, entry at % of capital. Currently under development.
Used on cryptocurrency. The 30 min timeframe was used. Adjust the values yourself, settings are provided

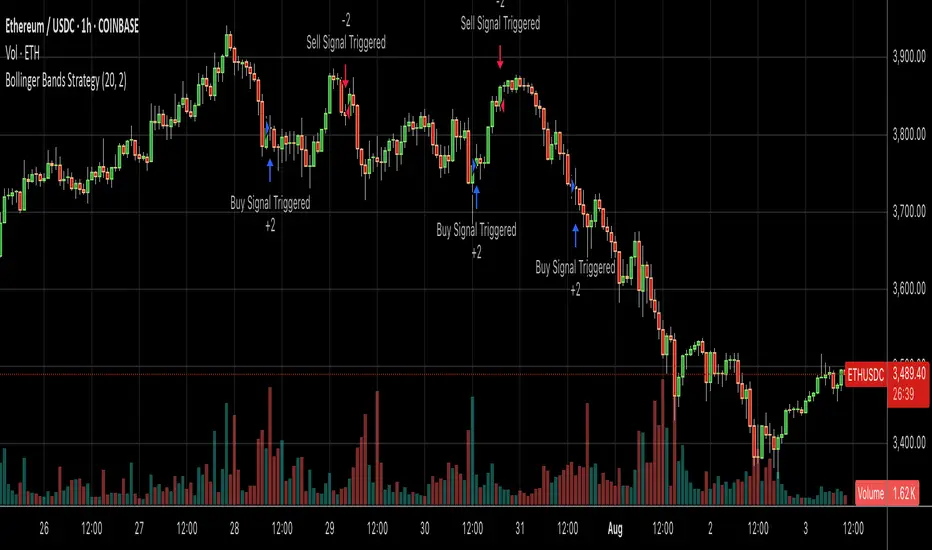
Bollinger Bands SMA 20_2 StrategyMean reversion strategy using Bollinger Bands (20-period SMA with 2.0 standard deviation bands).
Trade Triggers:
🟢 BUY SIGNAL:
When: Price crosses above the lower Bollinger Band
Logic: Price has hit oversold territory and is bouncing back
Action: Places a long position with stop at the lower band
🔴 SELL SIGNAL:
When: Price crosses below the upper Bollinger Band
Logic: Price has hit overbought territory and is pulling back
Action: Places a short position with stop at the upper band
200 SMA (5%/-3% Buffer) for SPY & QQQ In my testing TQQQ is an absolute monster of an ETF that performs extremely well even from a buy and hold standpoint over long periods of time, its largest drawback is the massive drawdown exposure that it faces which can be easily sidestepped with this strategy.
This strategy is meant to basically abuse TQQQ's insane outperformance while augmenting the typical 200SMA strategy in a way that uses all of its strengths while avoiding getting whipsawed in sideways markets.
The strategy BUYS when price crosses 5% over the 200SMA and then SELLS when price drops 3% below the 200SMA. Between trades I'll be parking my entire account in SGOV.
So maximizing profit while minimizing risk.
You use the strategy based off of QQQ and then make the trades on TQQQ when it tells you to BUY/SELL.
Here are some reasons why I will be using this strategy:
Simple emotionless BUY and SELL signals where I don't care who the president is, what is happening in the world, who is bombing who, who the leadership team is, no attachment to individual companies and diversified across the NASDAQ.
~85% win percentage and when it does lose the loses are nothing compared to the wins and after a loss you're basically set up for a massive win in the next trade.
Max drawdown of around 53% when using TQQQ
You benefit massively when the market is doing well and when there is a recession you basically sit in SGOV for a year and then are set up for a monster recovery with a clear easy BUY signal. So as long as you're patient you win regardless of what happens.
The trades are often very long term resulting in you taking advantage of Long Term Capital Gains tax advantage which could mean saving up to 15-20% in taxes.
With only a few trades you can spend time doing other stuff and don't have to track or pay attention to anything that is happening.
Simple, easy, and massively profitable.

FFI-Trend Rider ProFFI-Trend Rider Pro is a trend-following strategy designed to help traders make more structured and disciplined entries.
It uses a crossover between the 11 EMA and 21 SMA to detect potential trend shifts, while avoiding premature entries by checking how far the price is from the moving averages. If the price is extended, it waits for a pullback — just like professional traders do.
The indicator also includes:
Auto stoploss based on 21 SMA
Visual background colors based on RSI to help gauge trend strength
A built-in trade info table showing current trade type, entry price, stoploss, and trailing SL
Strategy-enabled functionality for easy backtesting
🔍 Ideal For:
Intraday & Swing Traders
Traders who want fewer, high-quality trades
Anyone looking to reduce emotional decision-making
⚠️ Disclaimer:
This script is for educational purposes only and does not constitute financial advice. Always do your own analysis before making any trading decisions. Past performance is not indicative of future results.

Holy GrailThis is a long-only educational strategy that simulates what happens if you keep adding to a position during pullbacks and only exit when the asset hits a new All-Time High (ATH). It is intended for learning purposes only — not for live trading.
🧠 How it works:
The strategy identifies pullbacks using a simple moving average (MA).
When price dips below the MA, it begins monitoring for the first green candle (close > open).
That green candle signals a potential bottom, so it adds to the position.
If price goes lower, it waits for the next green candle and adds again.
The exit happens after ATH — it sells on each red candle (close < open) once a new ATH is reached.
You can adjust:
MA length (defines what’s considered a pullback)
Initial buy % (how much to pre-fill before signals start)
Buy % per signal (after pullback green candle)
Exit % per red candle after ATH
📊 Intended assets & timeframes:
This strategy is designed for broad market indices and long-term appreciating assets, such as:
SPY, NASDAQ, DAX, FTSE
Use it only on 1D or higher timeframes — it’s not meant for scalping or short-term trading.
⚠️ Important Limitations:
Long-only: The script does not short. It assumes the asset will eventually recover to a new ATH.
Not for all assets: It won't work on assets that may never recover (e.g., single stocks or speculative tokens).
Slow capital deployment: Entries happen gradually and may take a long time to close.
Not optimized for returns: Buy & hold can outperform this strategy.
No slippage, fees, or funding costs included.
This is not a performance strategy. It’s a teaching tool to show that:
High win rate ≠ high profitability
Patience can be deceiving
Many signals = long capital lock-in
🎓 Why it exists:
The purpose of this strategy is to demonstrate market psychology and risk overconfidence. Traders often chase strategies with high win rates without considering holding time, drawdowns, or opportunity cost.
This script helps visualize that phenomenon.

NY Opening Range Breakout - MA StopCore Concept
This strategy trades breakouts from the New York opening range (9:30-9:45 AM NY time) on intraday timeframes, designed for scalping and day trading.
Setup Requirements
Timeframe: Works on any timeframe under 15 minutes (1m, 2m, 3m, 5m, 10m)
Session: New York market hours
Range Period: 9:30-9:45 AM NY time (15-minute opening range)
Entry Rules
Long Entries:
Wait for a candle to close above the opening range high
Enter long on the next candle (before 12:00 PM NY time)
Must be above moving average if using MA-based take profit
Short Entries:
Wait for a candle to close below the opening range low
Enter short on the next candle (before 12:00 PM NY time)
Must be below moving average if using MA-based take profit
Risk Management
Stop Loss:
Long trades: Opening range low
Short trades: Opening range high
Take Profit Options:
Fixed Risk Reward: 1.5x the range size (customizable ratio)
Moving Average: Exit when price crosses back through MA
Both: Whichever comes first
Key Features
Trade Direction Options:
Long Only
Short Only
Both directions
Moving Average Filter:
Prevents entries that would immediately hit stop loss
Uses EMA/SMA/WMA/VWMA with customizable length
Acts as dynamic support/resistance
Time Restrictions:
No entries after 12:00 PM NY time (customizable cutoff)
One trade per direction per day
Daily reset of all variables
Visual Elements
Red/green lines showing opening range
Purple line for moving average
Entry and breakout signals with shapes
Take profit and stop loss levels plotted
Information table with current status
Strategy Logic Flow
Morning: Capture 9:30-9:45 range high/low
Wait: Monitor for breakout (previous candle close outside range)
Filter: Check MA condition if using MA-based exits
Enter: Trade on next candle after breakout
Manage: Exit at fixed TP, MA cross, or stop loss
Reset: Start fresh next trading day
This is a momentum-based breakout strategy that capitalizes on early market volatility while using the opening range as natural support/resistance levels.

RSI SwingRadar🧠 Strategy Overview
This long-only strategy combines RSI/MA crossovers with ATR-based risk management, designed for cleaner entries during potential bounce phases — especially tuned for assets like XMR/USDT.
🔍 Core Logic:
- RSI Crossover: Entry occurs when the 14-period RSI crosses above its 14-period SMA, signaling a potential shift in momentum.
- Oversold Filter: The RSI must have been below a user-defined oversold threshold (default: 35) on the previous candle, filtering for bounce setups after a pullback.
- ATR-Based Stop/Target: Stop-loss is placed below the low by a user-adjustable ATR multiplier (default: 0.5×). Take-profit is calculated with a Risk:Reward multiplier (default: 4×).
These elements work in tandem — RSI crossovers give momentum confirmation, oversold filtering adds context, and ATR-based exits adapt to volatility, creating a compact yet responsive strategy.
📉 Visuals:
- Dynamic Bands: The chart displays the active stop-loss, entry price, and take-profit as colored bands for easy visual tracking.
- Clean Overlay: Designed with simplicity — only confirmed setups are shown, keeping noise low.
✅ Suggested Use:
- Works best on XMR/USDT or similarly trending assets.
- Best suited for pullback entries during broader uptrends.
- Adjustable for different volatility conditions and asset behaviors.
⚠️ Disclaimer
- This strategy is for educational and research purposes only.
- It does not guarantee profitability in any market.
- Always backtest, forward-test, and understand your own risk tolerance before using any
strategy in a live environment.
- Past performance is not indicative of future results.
- This script is not financial advice.

Dskyz (DAFE) GENESIS Dskyz (DAFE) GENESIS: Adaptive Quant, Real Regime Power
Let’s be honest: Most published strategies on TradingView look nearly identical—copy-paste “open-source quant,” generic “adaptive” buzzwords, the same shallow explanations. I’ve even fallen into this trap with my own previously posted strategies. Not this time.
What Makes This Unique
GENESIS is not a black-box mashup or a pre-built template. It’s the culmination of DAFE’s own adaptive, multi-factor, regime-aware quant engine—built to outperform, survive, and visualize live edge in anything from NQ/MNQ to stocks and crypto.
True multi-factor core: Volume/price imbalances, trend shifts, volatility compression/expansion, and RSI all interlock for signal creation.
Adaptive regime logic: Trades only in healthy, actionable conditions—no “one-size-fits-all” signals.
Momentum normalization: Uses rolling, percentile-based fast/slow EMA differentials, ALWAYS normalized, ALWAYS relevant—no “is it working?” ambiguity.
Position sizing that adapts: Not fixed-lot, not naive—not a loophole for revenge trading.
No hidden DCA or pyramiding—what you see is what you trade.
Dashboard and visual system: Directly connected to internal logic. If it’s shown, it’s used—and nothing cosmetic is presented on your chart that isn’t quantifiable.
📊 Inputs and What They Mean (Read Carefully)
Maximum Raw Score: How many distinct factors can contribute to regime/trade confidence (default 4). If you extend the quant logic, increase this.
RSI Length / Min RSI for Shorts / Max RSI for Longs: Fine-tunes how “overbought/oversold” matters; increase the length for smoother swings, tighten floors/ceilings for more extreme signals.
⚡ Regime & Momentum Gates
Min Normed Momentum/Score (Conf): Raise to demand only the strongest trends—your filter to avoid algorithmic chop.
🕒 Volatility & Session
ATR Lookback, ATR Low/High Percentile: These control your system’s awareness of when the market is dead or ultra-volatile. All sizing and filter logic adapts in real time.
Trading Session (hours): Easy filter for when entries are allowed; default is regular trading hours—no surprise overnight fills.
📊 Sizing & Risk
Max Dollar Risk / Base-Max Contracts: All sizing is adaptive, based on live regime and volatility state—never static or “just 1 contract.” Control your max exposures and real $ risk. ATR will effect losses in high volatility times.
🔄 Exits & Scaling
Stop/Trail/Scale multipliers: You choose how dynamic/flexible risk controls and profit-taking need to be. ATR-based, so everything auto-adjusts to the current market mode.
Visuals That Actually Matter
Dashboard (Top Right): Shows only live, relevant stats: scoring, status, position size, win %, win streak, total wins—all from actual trade engine state (not “simulated”).
Watermark (Bottom Right): Momentum bar visual is always-on, regime-aware, reflecting live regime confidence and momentum normalization. If the bar is empty, you’re truly in no-momentum. If it glows lime, you’re riding the strongest possible edge.
*No cosmetics, no hidden code distractions.
Backtest Settings
Initial capital: $10,000
Commission: Conservative, realistic roundtrip cost:
15–20 per contract (including slippage per side) I set this to $25
Slippage: 3 ticks per trade
Symbol: CME_MINI:NQ1!
Timeframe: 1 min (but works on all timeframes)
Order size: Adaptive, 1–3 contracts
No pyramiding, no hidden DCA
Why these settings?
These settings are intentionally strict and realistic, reflecting the true costs and risks of live trading. The 10,000 account size is accessible for most retail traders. 25/contract including 3 ticks of slippage are on the high side for NQ, ensuring the strategy is not curve-fit to perfect fills. If it works here, it will work in real conditions.
Why It Wins
While others put out “AI-powered” strategies with little logic or soul, GENESIS is ruthlessly practical. It is built around what keeps traders alive:
- Context-aware signals, not just patterns
- Tight, transparent risk
- Inputs that adapt, not confuse
- Visuals that clarify, not distract
- Code that runs clean, efficient, and with minimal overfitting risk (try it on QQQ, AMD, SOL, etc. out of the box)
Disclaimer (for TradingView compliance):
Trading is risky. Futures, stocks, and crypto can result in significant losses. Do not trade with funds you cannot afford to lose. This is for educational and informational purposes only. Use in simulation/backtest mode before live trading. No past performance is indicative of future results. Always understand your risk and ownership of your trades.
This will not be my last—my goal is to keep raising the bar until DAFE is a brand or I’m forced to take this private.
Use with discipline, use with clarity, and always trade smarter.
— Dskyz , powered by DAFE Trading Systems.

Express Generator StrategyExpress Generator Strategy
Pine Script™ v6
The Express Generator Strategy is an algorithmic trading system that harnesses confluence from multiple technical indicators to optimize trade entries and dynamic risk management. Developed in Pine Script v6, it is designed to operate within a user-defined backtesting period—ensuring that trades are executed only during chosen historical windows for targeted analysis.
How It Works:
- Entry Conditions:
The strategy relies on a dual confirmation approach:- A moving average crossover system where a fast (default 9-period SMA) crossing above or below a slower (default 21-period SMA) average signals a potential trend reversal.
- MACD confirmation; trades are only initiated when the MACD line crosses its signal line in the direction of the moving average signal.
- An RSI filter refines these signals by preventing entries when the market might be overextended—ensuring that long entries only occur when the RSI is below an overbought level (default 70) and short entries when above an oversold level (default 30).
- Risk Management & Dynamic Position Sizing:
The strategy takes a calculated approach to risk by enabling the adjustment of position sizes using:- A pre-defined percentage of equity risk per trade (default 1%, adjustable between 0.5% to 3%).
- A stop-loss set in pips (default 100 pips, with customizable ranges), which is then adjusted by market volatility measured through the ATR.
- Trailing stops (default 50 pips) to help protect profits as the market moves favorably.
This combination of volatility-adjusted risk and equity-based position sizing aims to harmonize trade exposure with prevailing market conditions.
- Backtest Period Flexibility:
Users can define the start and end dates for backtesting (e.g., January 1, 2020 to December 31, 2025). This ensures that the strategy only opens trades within the intended analysis window. Moreover, if the strategy is still holding a position outside this period, it automatically closes all trades to prevent unwanted exposure.
- Visual Insights:
For clarity, the strategy plots the fast (blue) and slow (red) moving averages directly on the chart, allowing for visual confirmation of crossovers and trend shifts.
By integrating multiple technical indicators with robust risk management and adaptable position sizing, the Express Generator Strategy provides a comprehensive framework for capturing trending moves while prudently managing downside risk. It’s ideally suited for traders looking to combine systematic entries with a disciplined and dynamic risk approach.

Trailing Monster StrategyTrailing Monster Strategy
This is an experimental trend-following strategy that incorporates a custom adaptive moving average (PKAMA), RSI-based momentum filtering, and dynamic trailing stop-loss logic. It is designed for educational and research purposes only, and may require further optimization or risk management considerations prior to live deployment.
Strategy Logic
The strategy attempts to participate in sustained price trends by combining:
- A Power Kaufman Adaptive Moving Average (PKAMA) for dynamic trend detection,
- RSI and Simple Moving Average (SMA) filters for market condition confirmation,
- A delayed trailing stop-loss to manage exits once a trade is in profit.
Entry Conditions
Long Entry:
- RSI exceeds the overbought threshold (default: 70),
- Price is trading above the 200-period SMA,
- PKAMA slope is positive (indicating upward momentum),
- A minimum number of bars have passed since the last entry.
Short Entry:
- RSI falls below the oversold threshold (default: 30),
- Price is trading below the 200-period SMA,
- PKAMA slope is negative (indicating downward momentum),
-A minimum number of bars have passed since the last entry.
Exit Conditions
- A trailing stop-loss is applied once the position has been open for a user-defined number of bars.
- The trailing distance is calculated as a fixed percentage of the average entry price.
Technical Notes
This script implements a custom version of the Power Kaufman Adaptive Moving Average (PKAMA), conceptually inspired by alexgrover’s public implementation on TradingView .
Unlike traditional moving averages, PKAMA dynamically adjusts its responsiveness based on recent market volatility, allowing it to better capture trend changes in fast-moving assets like altcoins.
Disclaimer
This strategy is provided for educational purposes only.
It is not financial advice, and no guarantee of profitability is implied.
Always conduct thorough backtesting and forward testing before using any strategy in a live environment.
Adjust inputs based on your individual risk tolerance, asset class, and trading style.
Feedback is encouraged. You are welcome to fork and modify this script to suit your own preferences and market approach.
